Review storm footprints, hail swaths, reports, and replay access. Create a free account to save your setup and move into map access when a storm matters.
Search filters
Newest storms first by default.
Don't see your storm?Request a qualifying storm map and we'll email you when it is ready.
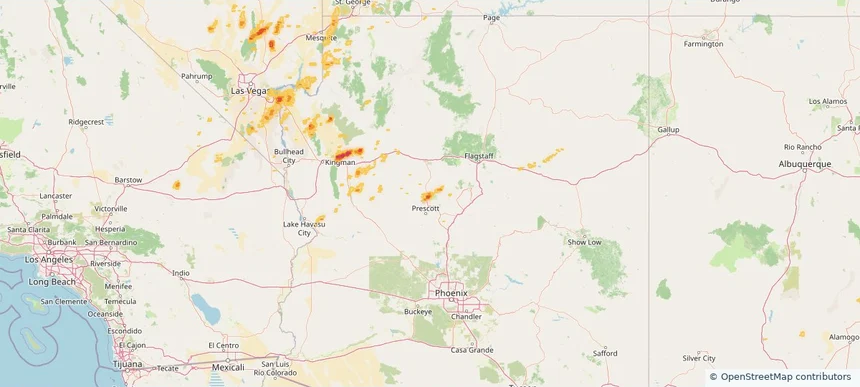
Local hail summary for the Chino Valley area: 22.74 square miles of estimated ground-hail footprint; highest mapped band 1.5+ inches. 2 official hail report(s) within the summary area. Exposure estimates are not confirmed property damage. Open the map to explore the full coverage included in your access. Statistics cover the mapped hail footprint inside the Census boundary of Chino Valley, AZ, not the entire region. The place had 13,020 residents in the 2020 Census. A boundary intersection does not mean the whole community was hit. Estimated housing exposure: 2,818 units in 1-inch-or-larger bands, including 1,852 in 1.5-inch-or-larger bands and 0 in 2-inch-or-larger bands.
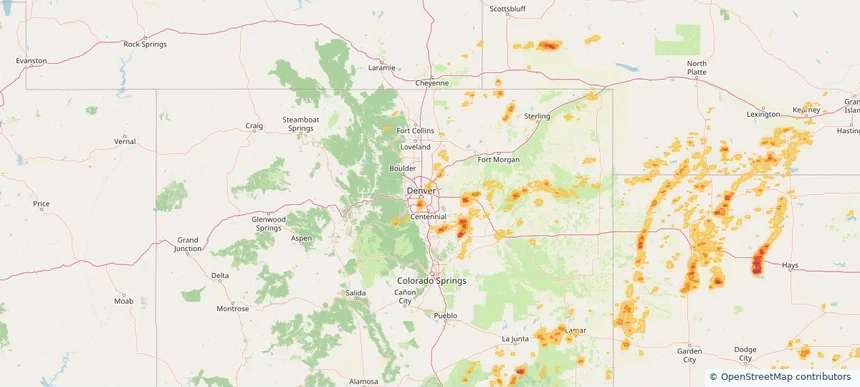
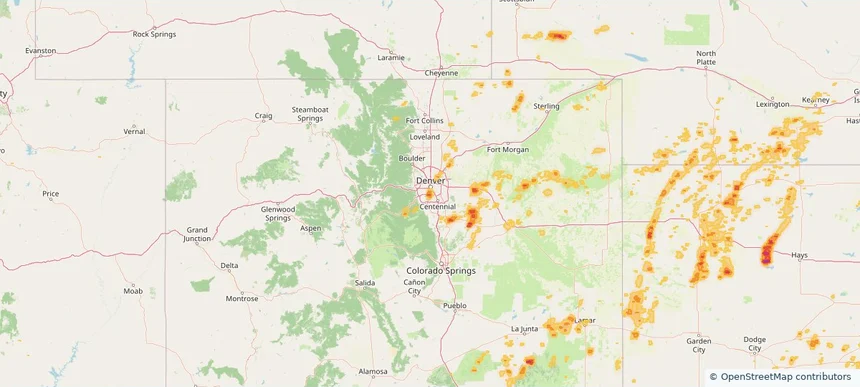
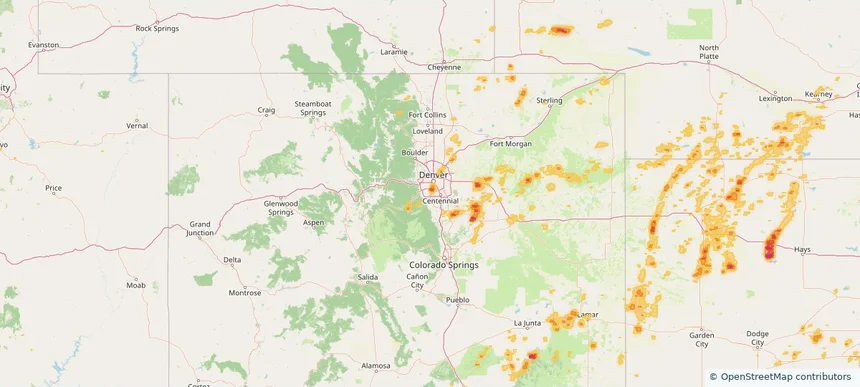
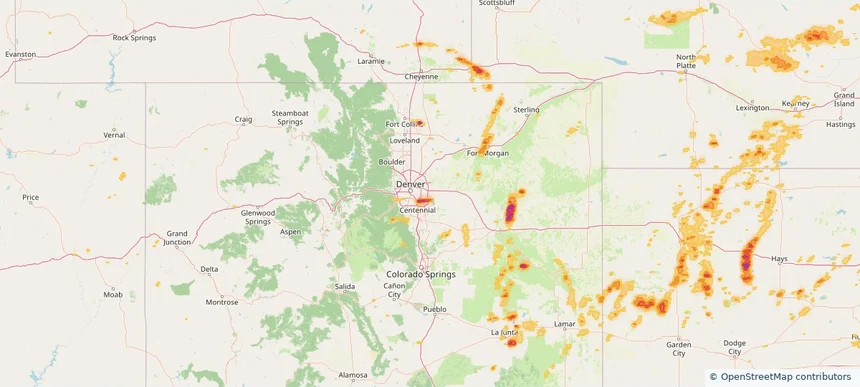
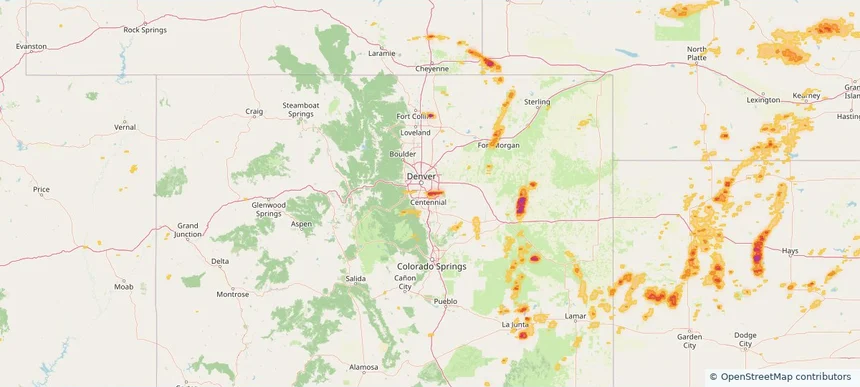
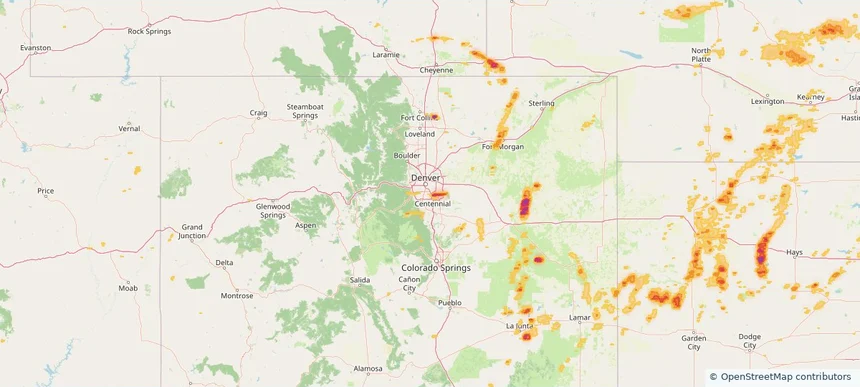
Local hail summary for the Denver area: 11.87 square miles of estimated ground-hail footprint; highest mapped band 1.5+ inches. 0 official hail report(s) within the summary area. Exposure estimates are not confirmed property damage. Open the map to explore the full coverage included in your access. Statistics cover the mapped hail footprint inside the Census boundary of Denver, CO, not the entire region. The place had 715,522 residents in the 2020 Census. A boundary intersection does not mean the whole community was hit. Estimated housing exposure: 15,673 units in 1-inch-or-larger bands, including 2,266 in 1.5-inch-or-larger bands and 0 in 2-inch-or-larger bands.
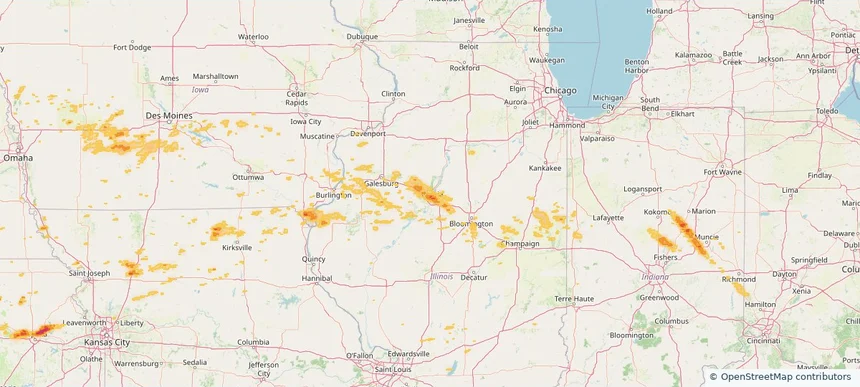
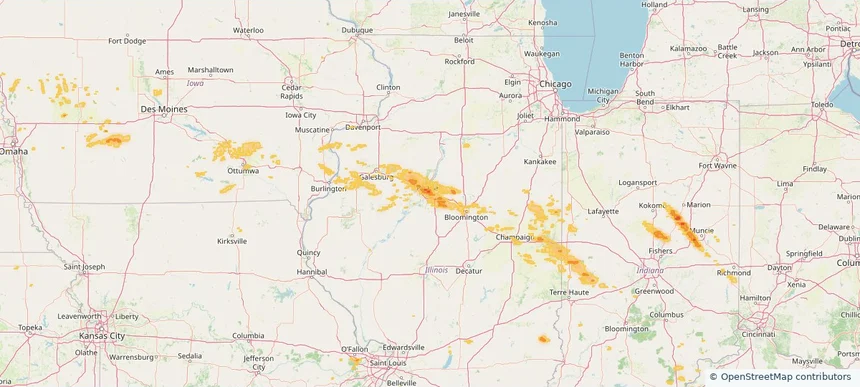
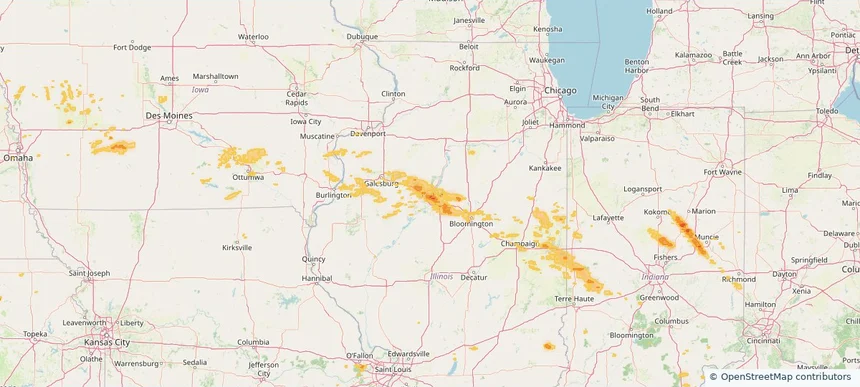
Local hail summary for the East Peoria area: 5.71 square miles of estimated ground-hail footprint; highest mapped band 1.5+ inches. 0 official hail report(s) within the summary area. Exposure estimates are not confirmed property damage. Open the map to explore the full coverage included in your access. Statistics cover the mapped hail footprint inside the Census boundary of East Peoria, IL, not the entire region. The place had 22,484 residents in the 2020 Census. A boundary intersection does not mean the whole community was hit. Estimated housing exposure: 884 units in 1-inch-or-larger bands, including 0 in 1.5-inch-or-larger bands and 0 in 2-inch-or-larger bands.
Local hail summary for the Englewood area: 6.20 square miles of estimated ground-hail footprint; highest mapped band 1.5+ inches. 0 official hail report(s) within the summary area. Exposure estimates are not confirmed property damage. Open the map to explore the full coverage included in your access. Statistics cover the mapped hail footprint inside the Census boundary of Englewood, CO, not the entire region. The place had 33,659 residents in the 2020 Census. A boundary intersection does not mean the whole community was hit. Estimated housing exposure: 11,786 units in 1-inch-or-larger bands, including 436 in 1.5-inch-or-larger bands and 0 in 2-inch-or-larger bands.
Local hail summary for the Hutchinson area: 2.31 square miles of estimated ground-hail footprint; highest mapped band 1+ inches. 0 official hail report(s) within the summary area. Exposure estimates are not confirmed property damage. Open the map to explore the full coverage included in your access. Statistics cover the mapped hail footprint inside the Census boundary of Hutchinson, KS, not the entire region. The place had 40,006 residents in the 2020 Census. A boundary intersection does not mean the whole community was hit. Estimated housing exposure: 367 units in 1-inch-or-larger bands, including 0 in 1.5-inch-or-larger bands and 0 in 2-inch-or-larger bands.
Local hail summary for the Lake Monticello area: 9.47 square miles of estimated ground-hail footprint; highest mapped band 2.5+ inches. 0 official hail report(s) within the summary area. Exposure estimates are not confirmed property damage. Open the map to explore the full coverage included in your access. Statistics cover the mapped hail footprint inside the Census boundary of Lake Monticello, VA, not the entire region. The place had 10,126 residents in the 2020 Census. A boundary intersection does not mean the whole community was hit. Estimated housing exposure: 4,447 units in 1-inch-or-larger bands, including 4,394 in 1.5-inch-or-larger bands and 3,420 in 2-inch-or-larger bands.
Local hail summary for the Littleton area: 4.01 square miles of estimated ground-hail footprint; highest mapped band 1+ inches. 0 official hail report(s) within the summary area. Exposure estimates are not confirmed property damage. Open the map to explore the full coverage included in your access. Statistics cover the mapped hail footprint inside the Census boundary of Littleton, CO, not the entire region. The place had 45,652 residents in the 2020 Census. A boundary intersection does not mean the whole community was hit. Estimated housing exposure: 2,041 units in 1-inch-or-larger bands, including 0 in 1.5-inch-or-larger bands and 0 in 2-inch-or-larger bands.
Local hail summary for the Peoria area: 13.44 square miles of estimated ground-hail footprint; highest mapped band 1.5+ inches. 0 official hail report(s) within the summary area. Exposure estimates are not confirmed property damage. Open the map to explore the full coverage included in your access. Statistics cover the mapped hail footprint inside the Census boundary of Peoria, IL, not the entire region. The place had 113,150 residents in the 2020 Census. A boundary intersection does not mean the whole community was hit. Estimated housing exposure: 19,839 units in 1-inch-or-larger bands, including 1,100 in 1.5-inch-or-larger bands and 0 in 2-inch-or-larger bands.
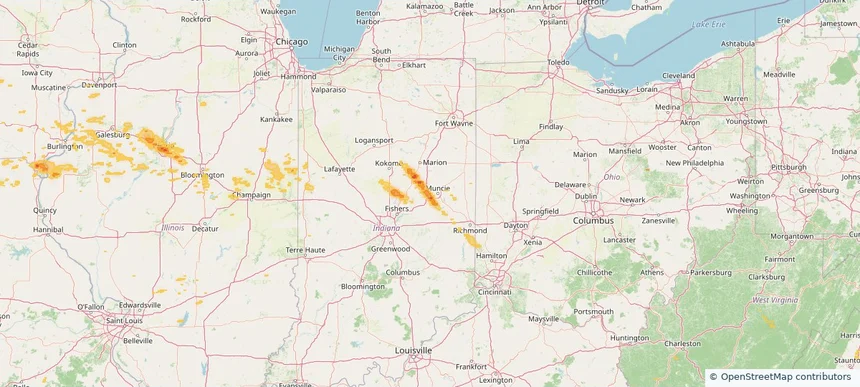
Local hail summary for the Yorktown area: 15.16 square miles of estimated ground-hail footprint; highest mapped band 1+ inches. 0 official hail report(s) within the summary area. Exposure estimates are not confirmed property damage. Open the map to explore the full coverage included in your access. Statistics cover the mapped hail footprint inside the Census boundary of Yorktown, IN, not the entire region. The place had 11,548 residents in the 2020 Census. A boundary intersection does not mean the whole community was hit. Estimated housing exposure: 609 units in 1-inch-or-larger bands, including 0 in 1.5-inch-or-larger bands and 0 in 2-inch-or-larger bands.
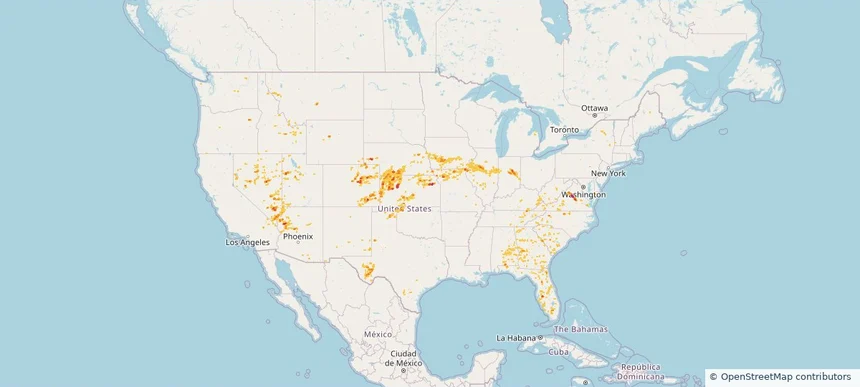
Hail as large as 3.50 inches was reported near Union Mills, VA. Wind up to 104 mph was reported near 2 miles east-northeast of Barracks, VA. A tornado was reported near 2 miles east-northeast of Commerce City, CO. The storm had 9 official hail reports.
Local hail summary for the Aurora area: 11.92 square miles of estimated ground-hail footprint; highest mapped band 2+ inches. 0 official hail report(s) within the summary area. Exposure estimates are not confirmed property damage. Open the map to explore the full coverage included in your access. Statistics cover the mapped hail footprint inside the Census boundary of Aurora, CO, not the entire region. The place had 386,261 residents in the 2020 Census. A boundary intersection does not mean the whole community was hit. Estimated housing exposure: 14,000 units in 1-inch-or-larger bands, including 5,753 in 1.5-inch-or-larger bands and 580 in 2-inch-or-larger bands.
Local hail summary for the Centennial area: 10.06 square miles of estimated ground-hail footprint; highest mapped band 2+ inches. 1 official hail report(s) within the summary area. Exposure estimates are not confirmed property damage. Open the map to explore the full coverage included in your access. Statistics cover the mapped hail footprint inside the Census boundary of Centennial, CO, not the entire region. The place had 108,418 residents in the 2020 Census. A boundary intersection does not mean the whole community was hit. Estimated housing exposure: 10,853 units in 1-inch-or-larger bands, including 9,193 in 1.5-inch-or-larger bands and 751 in 2-inch-or-larger bands.
Local hail summary for the Cherry Creek area: 1.67 square miles of estimated ground-hail footprint; highest mapped band 2+ inches. 0 official hail report(s) within the summary area. Exposure estimates are not confirmed property damage. Open the map to explore the full coverage included in your access. Statistics cover the mapped hail footprint inside the Census boundary of Cherry Creek, CO, not the entire region. The place had 11,488 residents in the 2020 Census. A boundary intersection does not mean the whole community was hit. Estimated housing exposure: 3,694 units in 1-inch-or-larger bands, including 1,898 in 1.5-inch-or-larger bands and 56 in 2-inch-or-larger bands.
Local hail summary for the East Peoria area: 5.71 square miles of estimated ground-hail footprint; highest mapped band 1.5+ inches. 0 official hail report(s) within the summary area. Exposure estimates are not confirmed property damage. Open the map to explore the full coverage included in your access. Statistics cover the mapped hail footprint inside the Census boundary of East Peoria, IL, not the entire region. The place had 22,484 residents in the 2020 Census. A boundary intersection does not mean the whole community was hit. Estimated housing exposure: 884 units in 1-inch-or-larger bands, including 0 in 1.5-inch-or-larger bands and 0 in 2-inch-or-larger bands.
Local hail summary for the Goose Creek area: 2.29 square miles of estimated ground-hail footprint; highest mapped band 1+ inches. 0 official hail report(s) within the summary area. Exposure estimates are not confirmed property damage. Open the map to explore the full coverage included in your access. Statistics cover the mapped hail footprint inside the Census boundary of Goose Creek, SC, not the entire region. The place had 45,946 residents in the 2020 Census. A boundary intersection does not mean the whole community was hit. Estimated housing exposure: 109 units in 1-inch-or-larger bands, including 0 in 1.5-inch-or-larger bands and 0 in 2-inch-or-larger bands.
Local hail summary for the Greenwood Village area: 3.40 square miles of estimated ground-hail footprint; highest mapped band 2+ inches. 0 official hail report(s) within the summary area. Exposure estimates are not confirmed property damage. Open the map to explore the full coverage included in your access. Statistics cover the mapped hail footprint inside the Census boundary of Greenwood Village, CO, not the entire region. The place had 15,691 residents in the 2020 Census. A boundary intersection does not mean the whole community was hit. Estimated housing exposure: 1,430 units in 1-inch-or-larger bands, including 325 in 1.5-inch-or-larger bands and 0 in 2-inch-or-larger bands.
Local hail summary for the Henderson area: 7.05 square miles of estimated ground-hail footprint; highest mapped band 1.5+ inches. 0 official hail report(s) within the summary area. Exposure estimates are not confirmed property damage. Open the map to explore the full coverage included in your access. Statistics cover the mapped hail footprint inside the Census boundary of Henderson, NV, not the entire region. The place had 317,610 residents in the 2020 Census. A boundary intersection does not mean the whole community was hit. Estimated housing exposure: 8,646 units in 1-inch-or-larger bands, including 368 in 1.5-inch-or-larger bands and 0 in 2-inch-or-larger bands.
Local hail summary for the Opelika area: 9.34 square miles of estimated ground-hail footprint; highest mapped band 1.5+ inches. 0 official hail report(s) within the summary area. Exposure estimates are not confirmed property damage. Open the map to explore the full coverage included in your access. Statistics cover the mapped hail footprint inside the Census boundary of Opelika, AL, not the entire region. The place had 30,995 residents in the 2020 Census. A boundary intersection does not mean the whole community was hit. Estimated housing exposure: 4,737 units in 1-inch-or-larger bands, including 794 in 1.5-inch-or-larger bands and 0 in 2-inch-or-larger bands.
Local hail summary for the Peoria area: 13.44 square miles of estimated ground-hail footprint; highest mapped band 1.5+ inches. 0 official hail report(s) within the summary area. Exposure estimates are not confirmed property damage. Open the map to explore the full coverage included in your access. Statistics cover the mapped hail footprint inside the Census boundary of Peoria, IL, not the entire region. The place had 113,150 residents in the 2020 Census. A boundary intersection does not mean the whole community was hit. Estimated housing exposure: 19,839 units in 1-inch-or-larger bands, including 1,100 in 1.5-inch-or-larger bands and 0 in 2-inch-or-larger bands.
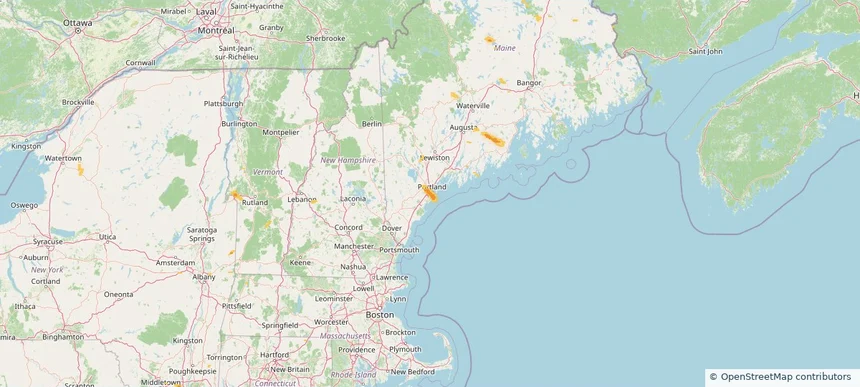
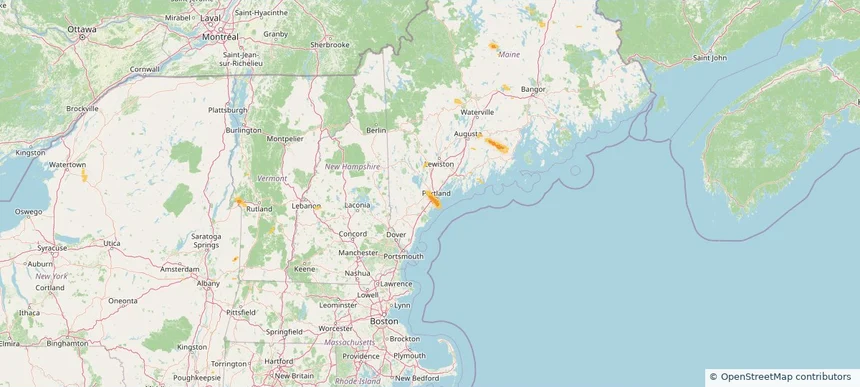
Local hail summary for the Portland area: 8.22 square miles of estimated ground-hail footprint; highest mapped band 1+ inches. 0 official hail report(s) within the summary area. Exposure estimates are not confirmed property damage. Open the map to explore the full coverage included in your access. Statistics cover the mapped hail footprint inside the Census boundary of Portland, ME, not the entire region. The place had 68,408 residents in the 2020 Census. A boundary intersection does not mean the whole community was hit. Estimated housing exposure: 4,074 units in 1-inch-or-larger bands, including 0 in 1.5-inch-or-larger bands and 0 in 2-inch-or-larger bands.
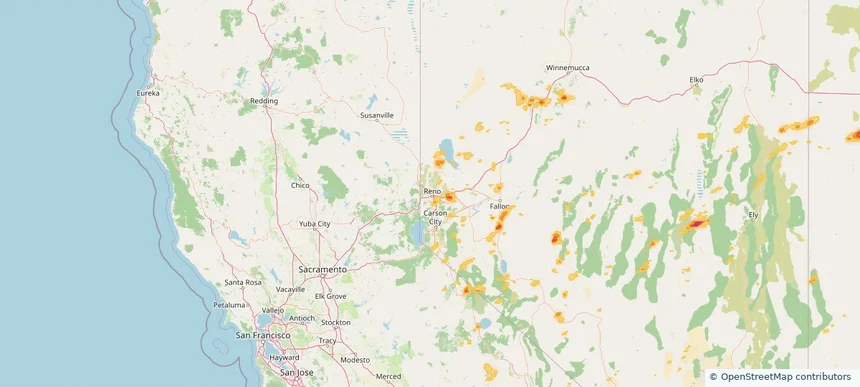
Local hail summary for the Reno area: 11.73 square miles of estimated ground-hail footprint; highest mapped band 1+ inches. 0 official hail report(s) within the summary area. Exposure estimates are not confirmed property damage. Open the map to explore the full coverage included in your access. Statistics cover the mapped hail footprint inside the Census boundary of Reno, NV, not the entire region. The place had 264,165 residents in the 2020 Census. A boundary intersection does not mean the whole community was hit. Estimated housing exposure: 3,903 units in 1-inch-or-larger bands, including 0 in 1.5-inch-or-larger bands and 0 in 2-inch-or-larger bands.
Local hail summary for the South Portland area: 6.78 square miles of estimated ground-hail footprint; highest mapped band 1+ inches. 0 official hail report(s) within the summary area. Exposure estimates are not confirmed property damage. Open the map to explore the full coverage included in your access. Statistics cover the mapped hail footprint inside the Census boundary of South Portland, ME, not the entire region. The place had 26,498 residents in the 2020 Census. A boundary intersection does not mean the whole community was hit. Estimated housing exposure: 4,009 units in 1-inch-or-larger bands, including 0 in 1.5-inch-or-larger bands and 0 in 2-inch-or-larger bands.
Local hail summary for the The Acreage area: 3.06 square miles of estimated ground-hail footprint; highest mapped band 1+ inches. 0 official hail report(s) within the summary area. Exposure estimates are not confirmed property damage. Open the map to explore the full coverage included in your access. Statistics cover the mapped hail footprint inside the Census boundary of The Acreage, FL, not the entire region. The place had 41,654 residents in the 2020 Census. A boundary intersection does not mean the whole community was hit. Estimated housing exposure: 531 units in 1-inch-or-larger bands, including 0 in 1.5-inch-or-larger bands and 0 in 2-inch-or-larger bands.
Local hail summary for the Westbrook area: 4.15 square miles of estimated ground-hail footprint; highest mapped band 1+ inches. 0 official hail report(s) within the summary area. Exposure estimates are not confirmed property damage. Open the map to explore the full coverage included in your access. Statistics cover the mapped hail footprint inside the Census boundary of Westbrook, ME, not the entire region. The place had 20,400 residents in the 2020 Census. A boundary intersection does not mean the whole community was hit. Estimated housing exposure: 149 units in 1-inch-or-larger bands, including 0 in 1.5-inch-or-larger bands and 0 in 2-inch-or-larger bands.