Review storm footprints, hail swaths, reports, and replay access. Create a free account to save your setup and move into map access when a storm matters.
Search filters
Newest storms first by default.
Don't see your storm?Request a qualifying storm map and we'll email you when it is ready.
Showing 2449-2472 of 2632 storms
· Page 103 of 110
Local hail summary for the Wichita Falls area: 5.57 square miles of estimated ground-hail footprint; highest mapped band 1+ inches. 0 official hail report(s) within the summary area. Exposure estimates are not confirmed property damage. Open the map to explore the full coverage included in your access. Statistics cover the mapped hail footprint inside the Census boundary of Wichita Falls, TX, not the entire region. The place had 102,316 residents in the 2020 Census. A boundary intersection does not mean the whole community was hit. Estimated housing exposure: 2,357 units in 1-inch-or-larger bands, including 0 in 1.5-inch-or-larger bands and 0 in 2-inch-or-larger bands.
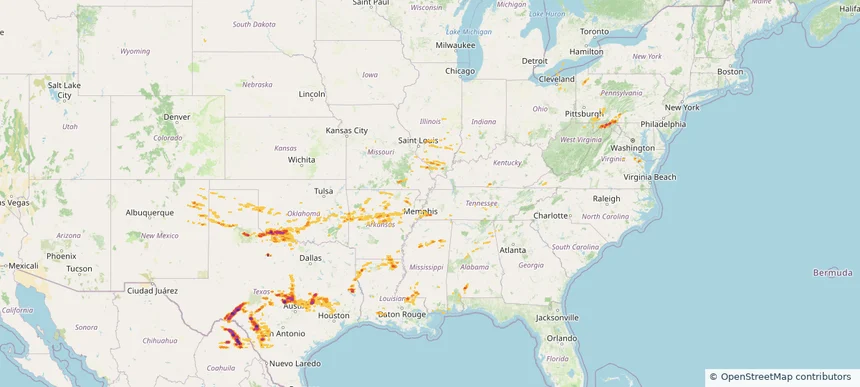
Hail as large as 2.75 inches was reported near Buchanan Lake, TEXAS. Wind up to 85 mph was reported near 4 miles north-northwest of Lebanon, OK. 31 tornadoes were reported, including one near Pickens, SOUTH CAROLINA. The storm had 27 official hail reports.
Local hail summary for the Alexandria area: 4.95 square miles of estimated ground-hail footprint; highest mapped band 1.5+ inches. 0 official hail report(s) within the summary area. Exposure estimates are not confirmed property damage. Open the map to explore the full coverage included in your access. Statistics cover the mapped hail footprint inside the Census boundary of Alexandria, KY, not the entire region. The place had 10,341 residents in the 2020 Census. A boundary intersection does not mean the whole community was hit. Estimated housing exposure: 2,356 units in 1-inch-or-larger bands, including 1,396 in 1.5-inch-or-larger bands and 0 in 2-inch-or-larger bands.
Local hail summary for the Belton area: 6.97 square miles of estimated ground-hail footprint; highest mapped band 1.5+ inches. 0 official hail report(s) within the summary area. Exposure estimates are not confirmed property damage. Open the map to explore the full coverage included in your access. Statistics cover the mapped hail footprint inside the Census boundary of Belton, TX, not the entire region. The place had 23,054 residents in the 2020 Census. A boundary intersection does not mean the whole community was hit. Estimated housing exposure: 1,800 units in 1-inch-or-larger bands, including 49 in 1.5-inch-or-larger bands and 0 in 2-inch-or-larger bands.
Local hail summary for the Copperas Cove area: 2.37 square miles of estimated ground-hail footprint; highest mapped band 1+ inches. 1 official hail report(s) within the summary area. Exposure estimates are not confirmed property damage. Open the map to explore the full coverage included in your access. Statistics cover the mapped hail footprint inside the Census boundary of Copperas Cove, TX, not the entire region. The place had 36,670 residents in the 2020 Census. A boundary intersection does not mean the whole community was hit. Estimated housing exposure: 527 units in 1-inch-or-larger bands, including 0 in 1.5-inch-or-larger bands and 0 in 2-inch-or-larger bands.
Local hail summary for the Georgetown area: 26.22 square miles of estimated ground-hail footprint; highest mapped band 1.5+ inches. 0 official hail report(s) within the summary area. Exposure estimates are not confirmed property damage. Open the map to explore the full coverage included in your access. Statistics cover the mapped hail footprint inside the Census boundary of Georgetown, TX, not the entire region. The place had 67,176 residents in the 2020 Census. A boundary intersection does not mean the whole community was hit. Estimated housing exposure: 5,567 units in 1-inch-or-larger bands, including 641 in 1.5-inch-or-larger bands and 0 in 2-inch-or-larger bands.
Local hail summary for the Harker Heights area: 12.43 square miles of estimated ground-hail footprint; highest mapped band 1+ inches. 0 official hail report(s) within the summary area. Exposure estimates are not confirmed property damage. Open the map to explore the full coverage included in your access. Statistics cover the mapped hail footprint inside the Census boundary of Harker Heights, TX, not the entire region. The place had 33,097 residents in the 2020 Census. A boundary intersection does not mean the whole community was hit. Estimated housing exposure: 9,394 units in 1-inch-or-larger bands, including 0 in 1.5-inch-or-larger bands and 0 in 2-inch-or-larger bands.
Local hail summary for the Hewitt area: 7.04 square miles of estimated ground-hail footprint; highest mapped band 1+ inches. 0 official hail report(s) within the summary area. Exposure estimates are not confirmed property damage. Open the map to explore the full coverage included in your access. Statistics cover the mapped hail footprint inside the Census boundary of Hewitt, TX, not the entire region. The place had 16,026 residents in the 2020 Census. A boundary intersection does not mean the whole community was hit. Estimated housing exposure: 4,734 units in 1-inch-or-larger bands, including 0 in 1.5-inch-or-larger bands and 0 in 2-inch-or-larger bands.
Local hail summary for the Hutto area: 9.61 square miles of estimated ground-hail footprint; highest mapped band 1.5+ inches. 0 official hail report(s) within the summary area. Exposure estimates are not confirmed property damage. Open the map to explore the full coverage included in your access. Statistics cover the mapped hail footprint inside the Census boundary of Hutto, TX, not the entire region. The place had 27,577 residents in the 2020 Census. A boundary intersection does not mean the whole community was hit. Estimated housing exposure: 6,122 units in 1-inch-or-larger bands, including 347 in 1.5-inch-or-larger bands and 0 in 2-inch-or-larger bands.
Local hail summary for the Kilgore area: 1.46 square miles of estimated ground-hail footprint; highest mapped band 1.5+ inches. 0 official hail report(s) within the summary area. Exposure estimates are not confirmed property damage. Open the map to explore the full coverage included in your access. Statistics cover the mapped hail footprint inside the Census boundary of Kilgore, TX, not the entire region. The place had 13,376 residents in the 2020 Census. A boundary intersection does not mean the whole community was hit. Estimated housing exposure: 773 units in 1-inch-or-larger bands, including 763 in 1.5-inch-or-larger bands and 0 in 2-inch-or-larger bands.
Local hail summary for the Killeen area: 35.06 square miles of estimated ground-hail footprint; highest mapped band 1.5+ inches. 0 official hail report(s) within the summary area. Exposure estimates are not confirmed property damage. Open the map to explore the full coverage included in your access. Statistics cover the mapped hail footprint inside the Census boundary of Killeen, TX, not the entire region. The place had 153,095 residents in the 2020 Census. A boundary intersection does not mean the whole community was hit. Estimated housing exposure: 25,957 units in 1-inch-or-larger bands, including 4,496 in 1.5-inch-or-larger bands and 0 in 2-inch-or-larger bands.
Local hail summary for the Pflugerville area: 0.51 square miles of estimated ground-hail footprint; highest mapped band 1+ inches. 0 official hail report(s) within the summary area. Exposure estimates are not confirmed property damage. Open the map to explore the full coverage included in your access. Statistics cover the mapped hail footprint inside the Census boundary of Pflugerville, TX, not the entire region. The place had 65,191 residents in the 2020 Census. A boundary intersection does not mean the whole community was hit. Estimated housing exposure: 723 units in 1-inch-or-larger bands, including 0 in 1.5-inch-or-larger bands and 0 in 2-inch-or-larger bands.
Local hail summary for the Robinson area: 29.56 square miles of estimated ground-hail footprint; highest mapped band 1.5+ inches. 0 official hail report(s) within the summary area. Exposure estimates are not confirmed property damage. Open the map to explore the full coverage included in your access. Statistics cover the mapped hail footprint inside the Census boundary of Robinson, TX, not the entire region. The place had 12,443 residents in the 2020 Census. A boundary intersection does not mean the whole community was hit. Estimated housing exposure: 3,667 units in 1-inch-or-larger bands, including 424 in 1.5-inch-or-larger bands and 0 in 2-inch-or-larger bands.
Local hail summary for the Taylor area: 19.83 square miles of estimated ground-hail footprint; highest mapped band 2+ inches. 2 official hail report(s) within the summary area. Exposure estimates are not confirmed property damage. Open the map to explore the full coverage included in your access. Statistics cover the mapped hail footprint inside the Census boundary of Taylor, TX, not the entire region. The place had 16,267 residents in the 2020 Census. A boundary intersection does not mean the whole community was hit. Estimated housing exposure: 5,974 units in 1-inch-or-larger bands, including 3,361 in 1.5-inch-or-larger bands and 154 in 2-inch-or-larger bands.
Local hail summary for the Temple area: 35.72 square miles of estimated ground-hail footprint; highest mapped band 1.5+ inches. 0 official hail report(s) within the summary area. Exposure estimates are not confirmed property damage. Open the map to explore the full coverage included in your access. Statistics cover the mapped hail footprint inside the Census boundary of Temple, TX, not the entire region. The place had 82,073 residents in the 2020 Census. A boundary intersection does not mean the whole community was hit. Estimated housing exposure: 10,564 units in 1-inch-or-larger bands, including 75 in 1.5-inch-or-larger bands and 0 in 2-inch-or-larger bands.
Local hail summary for the Waco area: 9.30 square miles of estimated ground-hail footprint; highest mapped band 1.5+ inches. 0 official hail report(s) within the summary area. Exposure estimates are not confirmed property damage. Open the map to explore the full coverage included in your access. Statistics cover the mapped hail footprint inside the Census boundary of Waco, TX, not the entire region. The place had 138,486 residents in the 2020 Census. A boundary intersection does not mean the whole community was hit. Estimated housing exposure: 2,485 units in 1-inch-or-larger bands, including 0 in 1.5-inch-or-larger bands and 0 in 2-inch-or-larger bands.
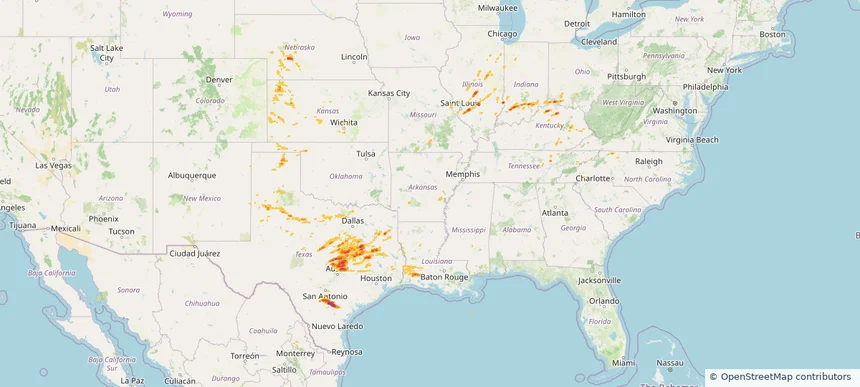
Hail as large as 2.75 inches was reported near Pawnee, TEXAS. Wind up to 90 mph was reported near Ar, AR. 50 tornadoes were reported, including one near Lawrence, MISSOURI. The storm had 29 official hail reports.
Local hail summary for the Duncan area: 23.62 square miles of estimated ground-hail footprint; highest mapped band 1+ inches. 0 official hail report(s) within the summary area. Exposure estimates are not confirmed property damage. Open the map to explore the full coverage included in your access. Statistics cover the mapped hail footprint inside the Census boundary of Duncan, OK, not the entire region. The place had 22,692 residents in the 2020 Census. A boundary intersection does not mean the whole community was hit. Estimated housing exposure: 1,165 units in 1-inch-or-larger bands, including 0 in 1.5-inch-or-larger bands and 0 in 2-inch-or-larger bands.
Local hail summary for the Frankfort area: 0.12 square miles of estimated ground-hail footprint; highest mapped band 1+ inches. 0 official hail report(s) within the summary area. Exposure estimates are not confirmed property damage. Open the map to explore the full coverage included in your access. Statistics cover the mapped hail footprint inside the Census boundary of Frankfort, KY, not the entire region. The place had 28,602 residents in the 2020 Census. A boundary intersection does not mean the whole community was hit. Estimated housing exposure: 299 units in 1-inch-or-larger bands, including 0 in 1.5-inch-or-larger bands and 0 in 2-inch-or-larger bands.
Local hail summary for the Hobbs area: 18.62 square miles of estimated ground-hail footprint; highest mapped band 1+ inches. 0 official hail report(s) within the summary area. Exposure estimates are not confirmed property damage. Open the map to explore the full coverage included in your access. Statistics cover the mapped hail footprint inside the Census boundary of Hobbs, NM, not the entire region. The place had 40,508 residents in the 2020 Census. A boundary intersection does not mean the whole community was hit. Estimated housing exposure: 6,818 units in 1-inch-or-larger bands, including 0 in 1.5-inch-or-larger bands and 0 in 2-inch-or-larger bands.
Local hail summary for the Middletown area: 10.40 square miles of estimated ground-hail footprint; highest mapped band 1+ inches. 0 official hail report(s) within the summary area. Exposure estimates are not confirmed property damage. Open the map to explore the full coverage included in your access. Statistics cover the mapped hail footprint inside the Census boundary of Middletown, OH, not the entire region. The place had 50,987 residents in the 2020 Census. A boundary intersection does not mean the whole community was hit. Estimated housing exposure: 381 units in 1-inch-or-larger bands, including 0 in 1.5-inch-or-larger bands and 0 in 2-inch-or-larger bands.
Local hail summary for the Southaven area: 6.15 square miles of estimated ground-hail footprint; highest mapped band 1+ inches. 0 official hail report(s) within the summary area. Exposure estimates are not confirmed property damage. Open the map to explore the full coverage included in your access. Statistics cover the mapped hail footprint inside the Census boundary of Southaven, MS, not the entire region. The place had 54,648 residents in the 2020 Census. A boundary intersection does not mean the whole community was hit. Estimated housing exposure: 2,384 units in 1-inch-or-larger bands, including 0 in 1.5-inch-or-larger bands and 0 in 2-inch-or-larger bands.
Local hail summary for the Sweetwater area: 10.89 square miles of estimated ground-hail footprint; highest mapped band 1.5+ inches. 0 official hail report(s) within the summary area. Exposure estimates are not confirmed property damage. Open the map to explore the full coverage included in your access. Statistics cover the mapped hail footprint inside the Census boundary of Sweetwater, TX, not the entire region. The place had 10,622 residents in the 2020 Census. A boundary intersection does not mean the whole community was hit. Estimated housing exposure: 4,839 units in 1-inch-or-larger bands, including 20 in 1.5-inch-or-larger bands and 0 in 2-inch-or-larger bands.
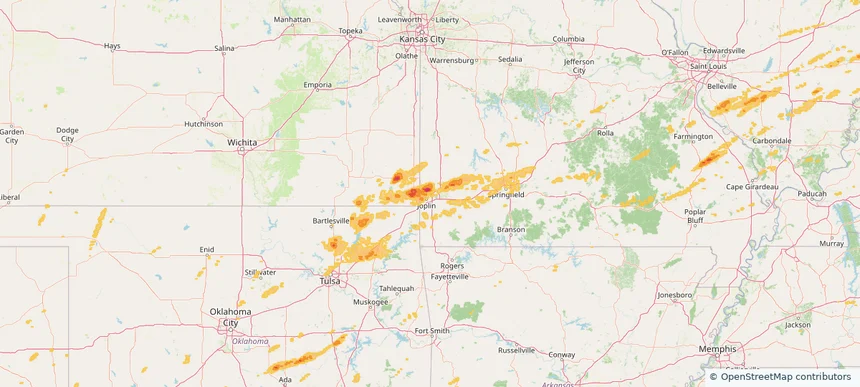
Local hail summary for the Webb City area: 2.00 square miles of estimated ground-hail footprint; highest mapped band 1+ inches. 1 official hail report(s) within the summary area. Exposure estimates are not confirmed property damage. Open the map to explore the full coverage included in your access. Statistics cover the mapped hail footprint inside the Census boundary of Webb City, MO, not the entire region. The place had 13,031 residents in the 2020 Census. A boundary intersection does not mean the whole community was hit. Estimated housing exposure: 114 units in 1-inch-or-larger bands, including 0 in 1.5-inch-or-larger bands and 0 in 2-inch-or-larger bands.