Storm library

Browse live and recent hail maps.

Review storm footprints, hail swaths, reports, and replay access. Create a free account to save your setup and move into map access when a storm matters.

Search filters
Clear
Newest storms first by default.
Don't see your storm? Request a qualifying storm map and we'll email you when it is ready.
Showing 169-192 of 2367 storms · Page 8 of 99
‹ 1 7 8 9 99 ›
Request a storm map

Tell us about the storm and we'll build the map. Once it's published you'll get an email and can purchase it from the library — just like any other event.

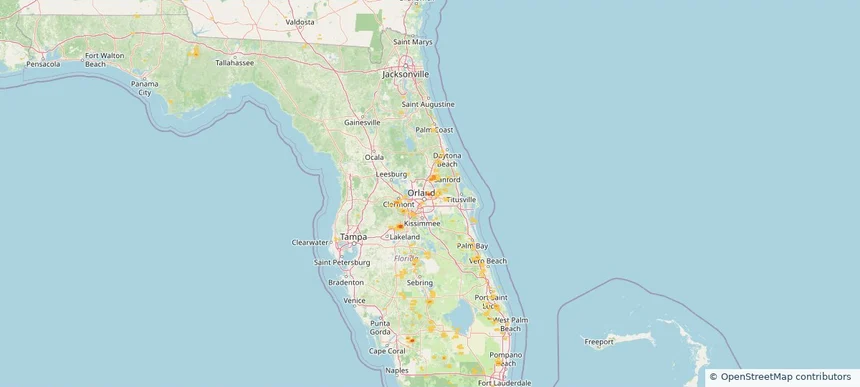
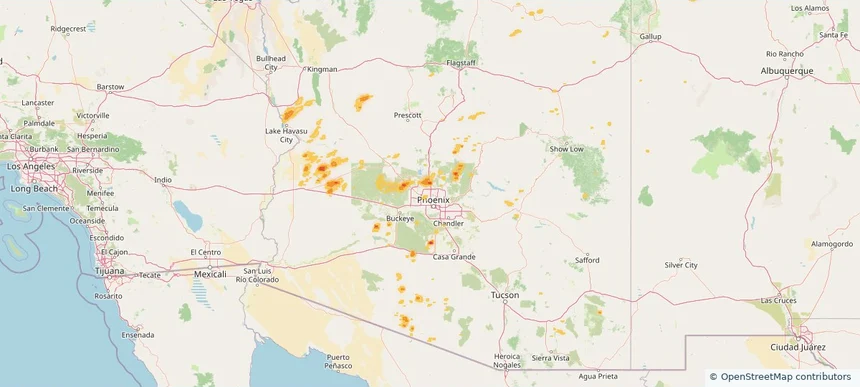
Phoenix, AZ — August 30, 2026 — regional hail footprint preview
Storm footprint preview

Local hail summary for the Phoenix area: 21.39 square miles of estimated ground-hail footprint; highest mapped band 1.5+ inches. 0 official hail report(s) within the summary area. Exposure estimates are not confirmed property damage. Open the map to explore the full coverage included in your access. Statistics cover the mapped hail footprint inside the Census boundary of Phoenix, AZ, not the entire region. The place had 1,608,139 residents in the 2020 Census. A boundary intersection does not mean the whole community was hit. Estimated housing exposure: 4,391 units in 1-inch-or-larger bands, including 20 in 1.5-inch-or-larger bands and 0 in 2-inch-or-larger bands.

Affected states: Phoenix area, AZ
1.5+ inRadar size estimate 13,623Population Affected 5,106Houses Affected HailHazards FreeAccount signup
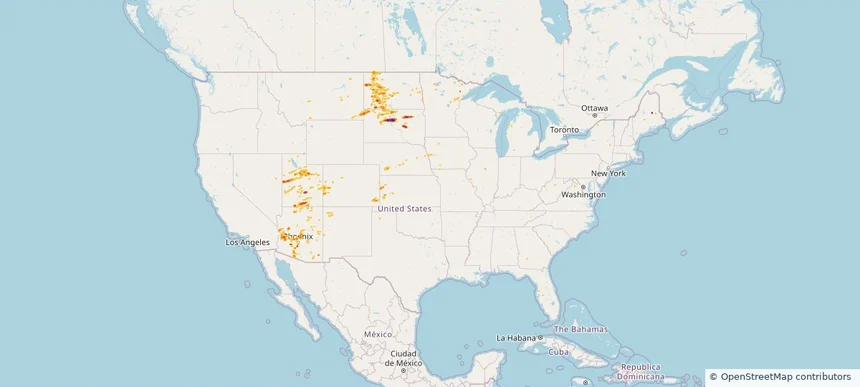
Nationwide Daily Hail & Wind Map - August 30, 2026 — regional hail footprint preview
Storm footprint preview
Aug 29, 2026 10:00 PM to Aug 31, 2026 1:45 AM CST

Nationwide Daily Hail & Wind Map - August 30, 2026

Hail as large as 1.75 inches was reported near 4 miles northeast of Miller Dale Colony, SD. Wind up to 115 mph was reported near 1 mile north of Buffalo, SD. The storm had 4 official hail reports.

Affected states: National, AZ, CA, CO, FL, IL, IA, KS, ME, MN, MT, NE, NM, ND, SD, TX, UT, WY
3.47 inRadar size estimate 103,758Population Affected 42,975Houses Affected Hail · WindHazards FreeAccount signup
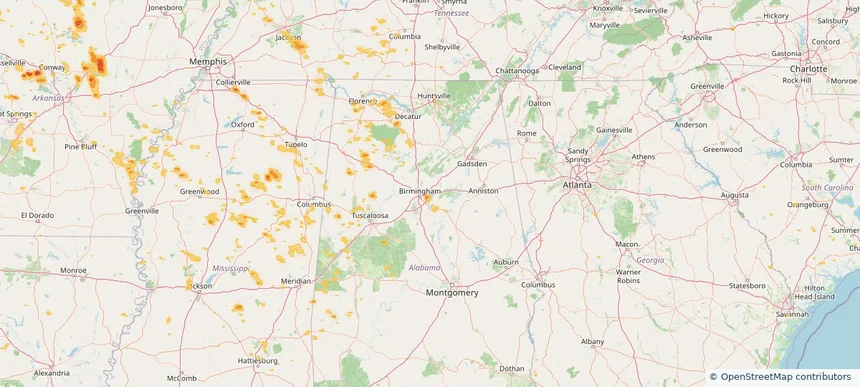
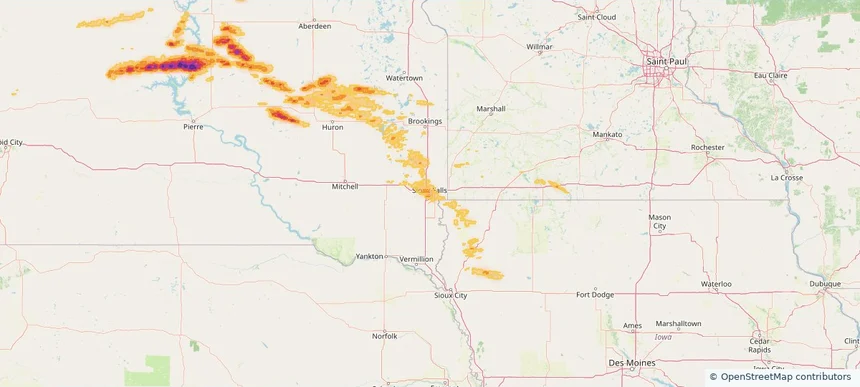
Sioux Falls, SD — August 29, 2026 — regional hail footprint preview
Storm footprint preview

Local hail summary for the Sioux Falls area: 6.22 square miles of estimated ground-hail footprint; highest mapped band 1+ inches. 0 official hail report(s) within the summary area. Exposure estimates are not confirmed property damage. Open the map to explore the full coverage included in your access. Statistics cover the mapped hail footprint inside the Census boundary of Sioux Falls, SD, not the entire region. The place had 192,517 residents in the 2020 Census. A boundary intersection does not mean the whole community was hit. Estimated housing exposure: 1,945 units in 1-inch-or-larger bands, including 0 in 1.5-inch-or-larger bands and 0 in 2-inch-or-larger bands.

Affected states: Sioux Falls area, SD
1+ inRadar size estimate 4,696Population Affected 1,969Houses Affected HailHazards FreeAccount signup
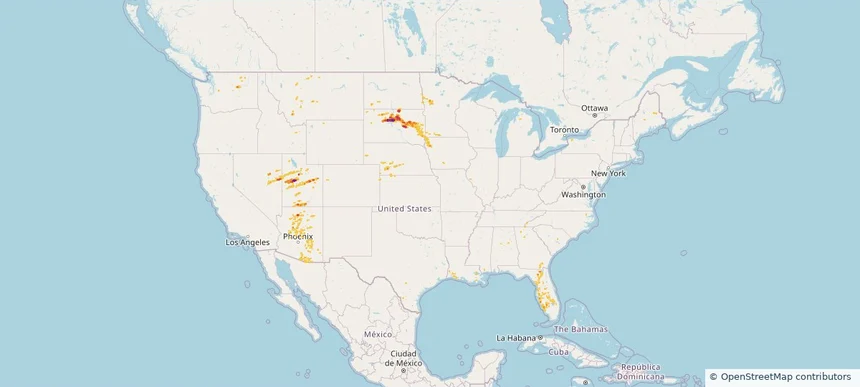
Nationwide Daily Hail & Wind Map - August 29, 2026 — regional hail footprint preview
Storm footprint preview
Aug 28, 2026 10:00 PM to Aug 30, 2026 1:45 AM CST

Nationwide Daily Hail & Wind Map - August 29, 2026

Hail as large as 1.75 inches was reported near 1 mile northeast of Lynndyl, UT. Wind up to 115 mph was reported near 1 mile northeast of Lynndyl, UT. The storm had 7 official hail reports.

Affected states: National, AL, AZ, CO, FL, GA, IA, KS, MN, MT, NE, NV, ND, SD, TX, UT, WA, WY
3.47 inRadar size estimate 318,804Population Affected 151,786Houses Affected Hail · WindHazards FreeAccount signup
Houston, TX — August 28, 2026 — regional hail footprint preview
Storm footprint preview

Local hail summary for the Houston area: 5.84 square miles of estimated ground-hail footprint; highest mapped band 1+ inches. 0 official hail report(s) within the summary area. Exposure estimates are not confirmed property damage. Open the map to explore the full coverage included in your access. Statistics cover the mapped hail footprint inside the Census boundary of Houston, TX, not the entire region. The place had 2,304,580 residents in the 2020 Census. A boundary intersection does not mean the whole community was hit. Estimated housing exposure: 2,787 units in 1-inch-or-larger bands, including 0 in 1.5-inch-or-larger bands and 0 in 2-inch-or-larger bands.

Affected states: Houston area, TX
1+ inRadar size estimate 8,046Population Affected 4,023Houses Affected HailHazards FreeAccount signup
San Antonio, TX — August 28, 2026 — regional hail footprint preview
Storm footprint preview

Local hail summary for the San Antonio area: 8.22 square miles of estimated ground-hail footprint; highest mapped band 1+ inches. 0 official hail report(s) within the summary area. Exposure estimates are not confirmed property damage. Open the map to explore the full coverage included in your access. Statistics cover the mapped hail footprint inside the Census boundary of San Antonio, TX, not the entire region. The place had 1,434,625 residents in the 2020 Census. A boundary intersection does not mean the whole community was hit. Estimated housing exposure: 360 units in 1-inch-or-larger bands, including 0 in 1.5-inch-or-larger bands and 0 in 2-inch-or-larger bands.

Affected states: San Antonio area, TX
1+ inRadar size estimate 11,490Population Affected 3,772Houses Affected HailHazards FreeAccount signup
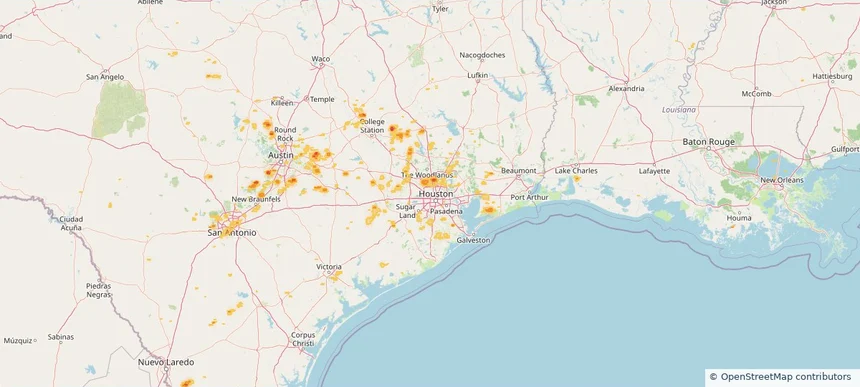
Spring, TX — August 28, 2026 — regional hail footprint preview
Storm footprint preview

Local hail summary for the Spring area: 2.42 square miles of estimated ground-hail footprint; highest mapped band 1+ inches. 0 official hail report(s) within the summary area. Exposure estimates are not confirmed property damage. Open the map to explore the full coverage included in your access. Statistics cover the mapped hail footprint inside the Census boundary of Spring, TX, not the entire region. The place had 62,559 residents in the 2020 Census. A boundary intersection does not mean the whole community was hit. Estimated housing exposure: 907 units in 1-inch-or-larger bands, including 0 in 1.5-inch-or-larger bands and 0 in 2-inch-or-larger bands.

Affected states: Spring area, TX
1+ inRadar size estimate 6,767Population Affected 2,476Houses Affected HailHazards FreeAccount signup
Nationwide Daily Hail & Wind Map - August 28, 2026 — regional hail footprint preview
Storm footprint preview
Aug 27, 2026 10:00 PM to Aug 29, 2026 1:45 AM CST

Nationwide Daily Hail & Wind Map - August 28, 2026

Hail as large as 1.00 inches was reported near 2 miles south of Spring, TX. Wind up to 91 mph was reported near 3 miles south-southwest of Santaquin, UT. The storm had 1 official hail report.

Affected states: National, AL, AZ, CA, CO, FL, GA, ID, KS, LA, ME, MD, MT, NE, NV, NJ, NM, NC, ND, OK, PA, SC, SD, TX, UT, VA, WV, WY
2.97 inRadar size estimate 769,096Population Affected 301,820Houses Affected Hail · WindHazards FreeAccount signup
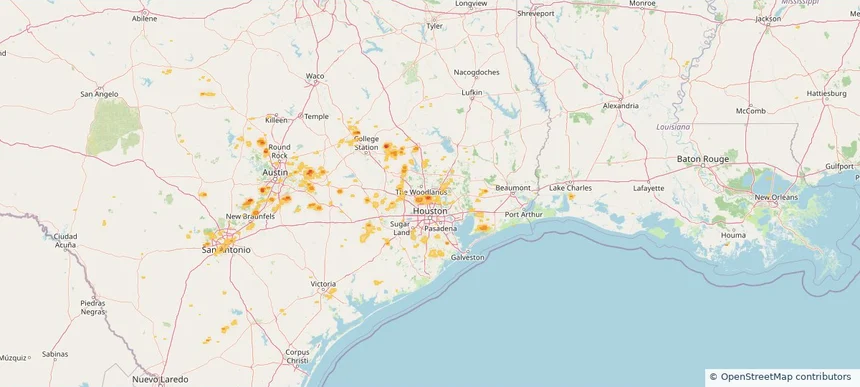
Austin, TX — August 27, 2026 — regional hail footprint preview
Storm footprint preview

Local hail summary for the Austin area: 3.56 square miles of estimated ground-hail footprint; highest mapped band 1+ inches. 0 official hail report(s) within the summary area. Exposure estimates are not confirmed property damage. Open the map to explore the full coverage included in your access. Statistics cover the mapped hail footprint inside the Census boundary of Austin, TX, not the entire region. The place had 961,855 residents in the 2020 Census. A boundary intersection does not mean the whole community was hit. Estimated housing exposure: 426 units in 1-inch-or-larger bands, including 0 in 1.5-inch-or-larger bands and 0 in 2-inch-or-larger bands.

Affected states: Austin area, TX
1+ inRadar size estimate 1,357Population Affected 427Houses Affected HailHazards FreeAccount signup
Beaumont, TX — August 27, 2026 — regional hail footprint preview
Storm footprint preview

Local hail summary for the Beaumont area: 8.02 square miles of estimated ground-hail footprint; highest mapped band 1+ inches. 0 official hail report(s) within the summary area. Exposure estimates are not confirmed property damage. Open the map to explore the full coverage included in your access. Statistics cover the mapped hail footprint inside the Census boundary of Beaumont, TX, not the entire region. The place had 115,282 residents in the 2020 Census. A boundary intersection does not mean the whole community was hit. Estimated housing exposure: 2,144 units in 1-inch-or-larger bands, including 0 in 1.5-inch-or-larger bands and 0 in 2-inch-or-larger bands.

Affected states: Beaumont area, TX
1+ inRadar size estimate 8,796Population Affected 3,486Houses Affected HailHazards FreeAccount signup
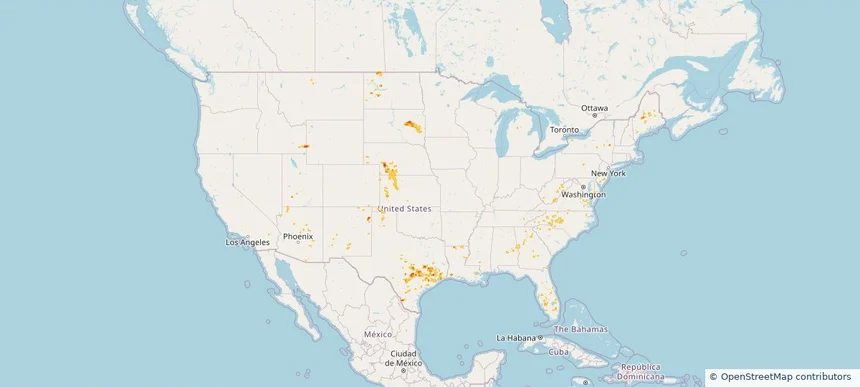
Martinsburg, WV — August 27, 2026 — regional hail footprint preview
Storm footprint preview

Local hail summary for the Martinsburg area: 6.24 square miles of estimated ground-hail footprint; highest mapped band 1+ inches. 2 official hail report(s) within the summary area. Exposure estimates are not confirmed property damage. Open the map to explore the full coverage included in your access. Statistics cover the mapped hail footprint inside the Census boundary of Martinsburg, WV, not the entire region. The place had 18,777 residents in the 2020 Census. A boundary intersection does not mean the whole community was hit. Estimated housing exposure: 7,555 units in 1-inch-or-larger bands, including 0 in 1.5-inch-or-larger bands and 0 in 2-inch-or-larger bands.

Affected states: Martinsburg area, WV
1+ inRadar size estimate 17,999Population Affected 8,448Houses Affected HailHazards FreeAccount signup
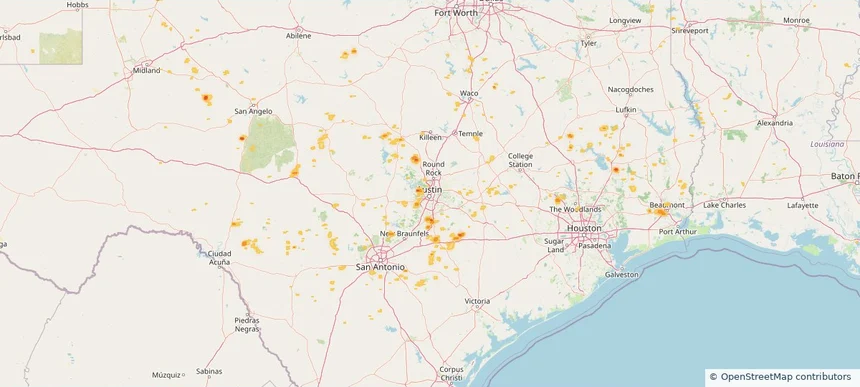
Pennsville, NJ — August 27, 2026 — regional hail footprint preview
Storm footprint preview

Local hail summary for the Pennsville area: 5.07 square miles of estimated ground-hail footprint; highest mapped band 1.5+ inches. 0 official hail report(s) within the summary area. Exposure estimates are not confirmed property damage. Open the map to explore the full coverage included in your access. Statistics cover the mapped hail footprint inside the Census boundary of Pennsville, NJ, not the entire region. The place had 12,043 residents in the 2020 Census. A boundary intersection does not mean the whole community was hit. Estimated housing exposure: 592 units in 1-inch-or-larger bands, including 0 in 1.5-inch-or-larger bands and 0 in 2-inch-or-larger bands.

Affected states: Pennsville area, NJ
1.5+ inRadar size estimate 5,766Population Affected 2,521Houses Affected HailHazards FreeAccount signup
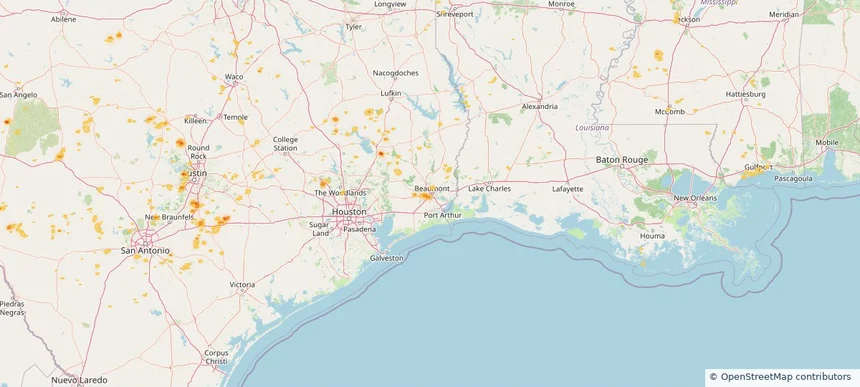
Steiner Ranch, TX — August 27, 2026 — regional hail footprint preview
Storm footprint preview

Local hail summary for the Steiner Ranch area: 2.86 square miles of estimated ground-hail footprint; highest mapped band 1+ inches. 0 official hail report(s) within the summary area. Exposure estimates are not confirmed property damage. Open the map to explore the full coverage included in your access. Statistics cover the mapped hail footprint inside the Census boundary of Steiner Ranch, TX, not the entire region. The place had 16,713 residents in the 2020 Census. A boundary intersection does not mean the whole community was hit. Estimated housing exposure: 2,216 units in 1-inch-or-larger bands, including 0 in 1.5-inch-or-larger bands and 0 in 2-inch-or-larger bands.

Affected states: Steiner Ranch area, TX
1+ inRadar size estimate 6,740Population Affected 2,216Houses Affected HailHazards FreeAccount signup
Tucson, AZ — August 27, 2026 — regional hail footprint preview
Storm footprint preview

Local hail summary for the Tucson area: 4.43 square miles of estimated ground-hail footprint; highest mapped band 1+ inches. 0 official hail report(s) within the summary area. Exposure estimates are not confirmed property damage. Open the map to explore the full coverage included in your access. Statistics cover the mapped hail footprint inside the Census boundary of Tucson, AZ, not the entire region. The place had 542,629 residents in the 2020 Census. A boundary intersection does not mean the whole community was hit. Estimated housing exposure: 2,234 units in 1-inch-or-larger bands, including 0 in 1.5-inch-or-larger bands and 0 in 2-inch-or-larger bands.

Affected states: Tucson area, AZ
1+ inRadar size estimate 14,287Population Affected 7,412Houses Affected HailHazards FreeAccount signup
Nationwide Daily Hail, Wind & Tornado Map - August 27, 2026 — regional hail footprint preview
Storm footprint preview
Aug 26, 2026 10:00 PM to Aug 28, 2026 1:45 AM CST

Nationwide Daily Hail, Wind & Tornado Map - August 27, 2026

Hail as large as 2.50 inches was reported near 21 miles west-southwest of Merritt Reservoi, NE. Wind up to 112 mph was reported near 3 miles north of Luling, TX. 3 tornadoes were reported, including one near 3 miles northeast of Rosita, CO. The storm had 24 official hail reports.

Affected states: National, AZ, AR, CO, CT, DE, FL, GA, ID, IN, KS, LA, MD, MS, MT, NE, NH, NJ, NM, NY, NC, OH, OK, PA, SC, SD, TN, TX, UT, VT, VA, WV, WY
3.5 inRadar size estimate 922,441Population Affected 389,548Houses Affected Hail · Wind · TornadoHazards FreeAccount signup
Aurora, CO — August 26, 2026 — regional hail footprint preview
Storm footprint preview

Local hail summary for the Aurora area: 2.05 square miles of estimated ground-hail footprint; highest mapped band 1+ inches. 1 official hail report(s) within the summary area. Exposure estimates are not confirmed property damage. Open the map to explore the full coverage included in your access. Statistics cover the mapped hail footprint inside the Census boundary of Aurora, CO, not the entire region. The place had 386,261 residents in the 2020 Census. A boundary intersection does not mean the whole community was hit. Estimated housing exposure: 281 units in 1-inch-or-larger bands, including 0 in 1.5-inch-or-larger bands and 0 in 2-inch-or-larger bands.

Affected states: Aurora area, CO
1+ inRadar size estimate 4,973Population Affected 1,652Houses Affected HailHazards FreeAccount signup
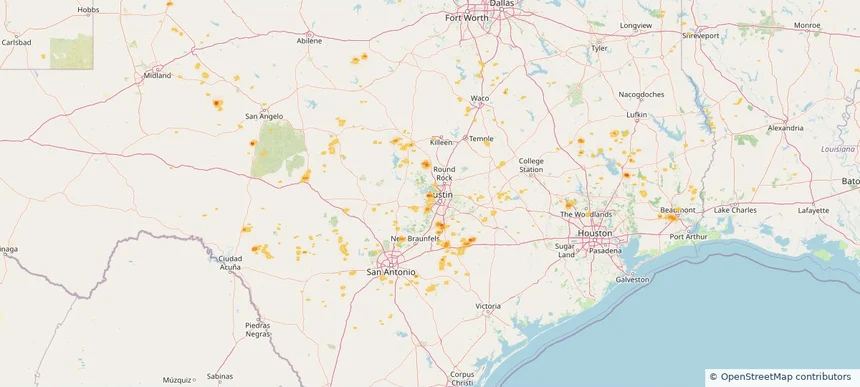
Cabot, AR — August 26, 2026 — regional hail footprint preview
Storm footprint preview

Local hail summary for the Cabot area: 4.00 square miles of estimated ground-hail footprint; highest mapped band 1+ inches. 1 official hail report(s) within the summary area. Exposure estimates are not confirmed property damage. Open the map to explore the full coverage included in your access. Statistics cover the mapped hail footprint inside the Census boundary of Cabot, AR, not the entire region. The place had 26,569 residents in the 2020 Census. A boundary intersection does not mean the whole community was hit. Estimated housing exposure: 872 units in 1-inch-or-larger bands, including 0 in 1.5-inch-or-larger bands and 0 in 2-inch-or-larger bands.

Affected states: Cabot area, AR
1+ inRadar size estimate 4,976Population Affected 1,892Houses Affected HailHazards FreeAccount signup
Casselberry, FL — August 26, 2026 — regional hail footprint preview
Storm footprint preview

Local hail summary for the Casselberry area: 0.65 square miles of estimated ground-hail footprint; highest mapped band 1.5+ inches. 0 official hail report(s) within the summary area. Exposure estimates are not confirmed property damage. Open the map to explore the full coverage included in your access. Statistics cover the mapped hail footprint inside the Census boundary of Casselberry, FL, not the entire region. The place had 28,794 residents in the 2020 Census. A boundary intersection does not mean the whole community was hit. Estimated housing exposure: 1,349 units in 1-inch-or-larger bands, including 562 in 1.5-inch-or-larger bands and 0 in 2-inch-or-larger bands.

Affected states: Casselberry area, FL
1.5+ inRadar size estimate 4,762Population Affected 2,394Houses Affected HailHazards FreeAccount signup
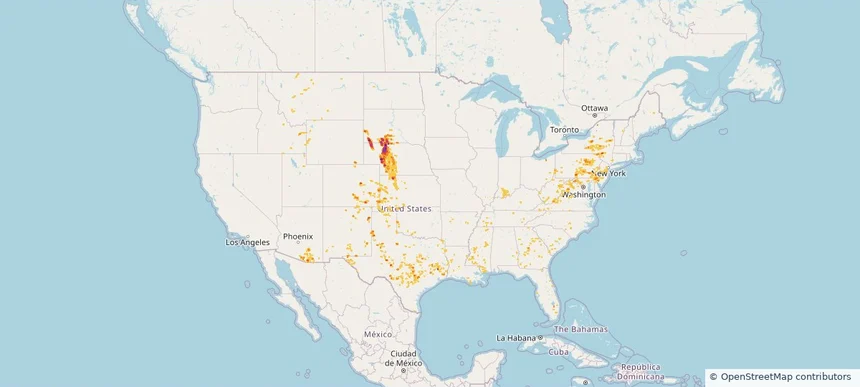
Castle Pines, CO — August 26, 2026 — regional hail footprint preview
Storm footprint preview

Local hail summary for the Castle Pines area: 8.84 square miles of estimated ground-hail footprint; highest mapped band 1.5+ inches. 1 official hail report(s) within the summary area. Exposure estimates are not confirmed property damage. Open the map to explore the full coverage included in your access. Statistics cover the mapped hail footprint inside the Census boundary of Castle Pines, CO, not the entire region. The place had 11,036 residents in the 2020 Census. A boundary intersection does not mean the whole community was hit. Estimated housing exposure: 3,668 units in 1-inch-or-larger bands, including 1,546 in 1.5-inch-or-larger bands and 0 in 2-inch-or-larger bands.

Affected states: Castle Pines area, CO
1.5+ inRadar size estimate 10,054Population Affected 3,677Houses Affected HailHazards FreeAccount signup
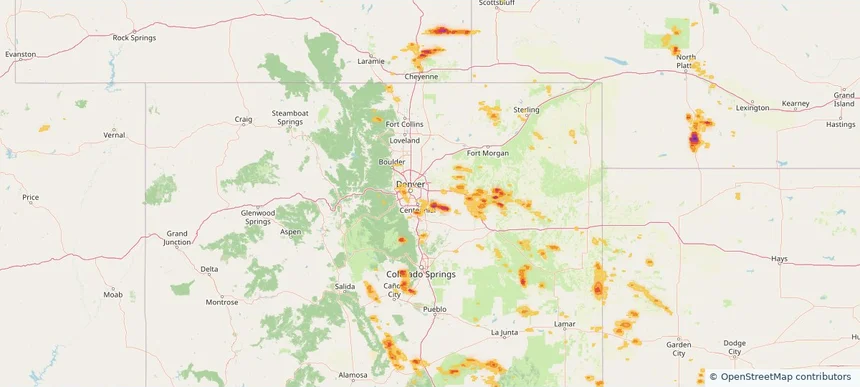
Cheyenne, WY — August 26, 2026 — regional hail footprint preview
Storm footprint preview

Local hail summary for the Cheyenne area: 6.84 square miles of estimated ground-hail footprint; highest mapped band 1+ inches. 1 official hail report(s) within the summary area. Exposure estimates are not confirmed property damage. Open the map to explore the full coverage included in your access. Statistics cover the mapped hail footprint inside the Census boundary of Cheyenne, WY, not the entire region. The place had 65,132 residents in the 2020 Census. A boundary intersection does not mean the whole community was hit. Estimated housing exposure: 3,464 units in 1-inch-or-larger bands, including 0 in 1.5-inch-or-larger bands and 0 in 2-inch-or-larger bands.

Affected states: Cheyenne area, WY
1+ inRadar size estimate 18,430Population Affected 9,380Houses Affected HailHazards FreeAccount signup
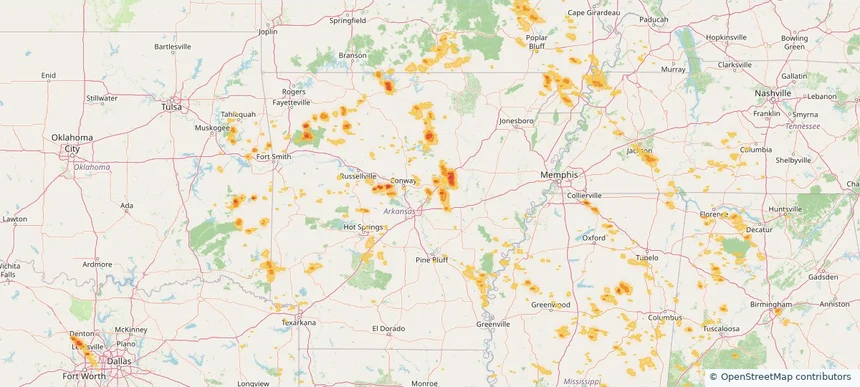
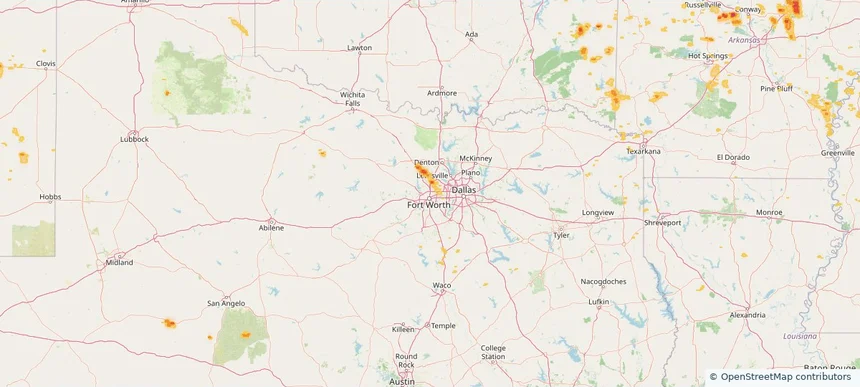
Fort Worth, TX — August 26, 2026 — regional hail footprint preview
Storm footprint preview

Local hail summary for the Fort Worth area: 4.64 square miles of estimated ground-hail footprint; highest mapped band 1+ inches. 2 official hail report(s) within the summary area. Exposure estimates are not confirmed property damage. Open the map to explore the full coverage included in your access. Statistics cover the mapped hail footprint inside the Census boundary of Fort Worth, TX, not the entire region. The place had 918,915 residents in the 2020 Census. A boundary intersection does not mean the whole community was hit. Estimated housing exposure: 4,964 units in 1-inch-or-larger bands, including 0 in 1.5-inch-or-larger bands and 0 in 2-inch-or-larger bands.

Affected states: Fort Worth area, TX
1+ inRadar size estimate 21,272Population Affected 6,916Houses Affected HailHazards FreeAccount signup
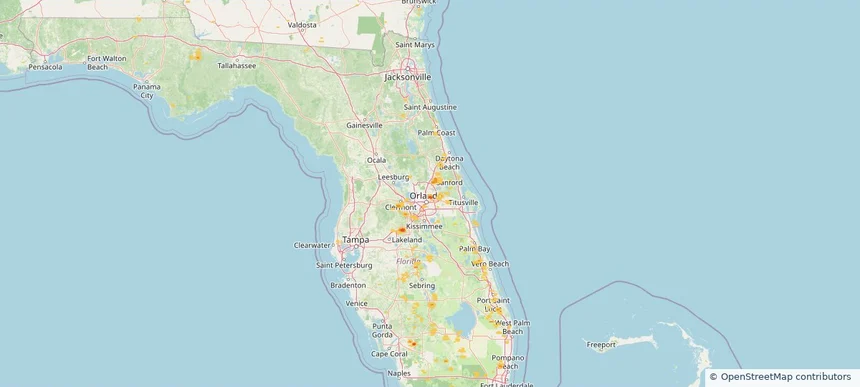
Goldenrod, FL — August 26, 2026 — regional hail footprint preview
Storm footprint preview

Local hail summary for the Goldenrod area: 0.87 square miles of estimated ground-hail footprint; highest mapped band 1+ inches. 0 official hail report(s) within the summary area. Exposure estimates are not confirmed property damage. Open the map to explore the full coverage included in your access. Statistics cover the mapped hail footprint inside the Census boundary of Goldenrod, FL, not the entire region. The place had 13,431 residents in the 2020 Census. A boundary intersection does not mean the whole community was hit. Estimated housing exposure: 2,112 units in 1-inch-or-larger bands, including 0 in 1.5-inch-or-larger bands and 0 in 2-inch-or-larger bands.

Affected states: Goldenrod area, FL
1+ inRadar size estimate 5,001Population Affected 2,112Houses Affected HailHazards FreeAccount signup
Irondale, AL — August 26, 2026 — regional hail footprint preview
Storm footprint preview

Local hail summary for the Irondale area: 0.92 square miles of estimated ground-hail footprint; highest mapped band 1+ inches. 0 official hail report(s) within the summary area. Exposure estimates are not confirmed property damage. Open the map to explore the full coverage included in your access. Statistics cover the mapped hail footprint inside the Census boundary of Irondale, AL, not the entire region. The place had 13,497 residents in the 2020 Census. A boundary intersection does not mean the whole community was hit. Estimated housing exposure: 102 units in 1-inch-or-larger bands, including 0 in 1.5-inch-or-larger bands and 0 in 2-inch-or-larger bands.

Affected states: Irondale area, AL
1+ inRadar size estimate 2,589Population Affected 1,258Houses Affected HailHazards FreeAccount signup
Lakewood, CO — August 26, 2026 — regional hail footprint preview
Storm footprint preview

Local hail summary for the Lakewood area: 17.80 square miles of estimated ground-hail footprint; highest mapped band 1+ inches. 0 official hail report(s) within the summary area. Exposure estimates are not confirmed property damage. Open the map to explore the full coverage included in your access. Statistics cover the mapped hail footprint inside the Census boundary of Lakewood, CO, not the entire region. The place had 155,984 residents in the 2020 Census. A boundary intersection does not mean the whole community was hit. Estimated housing exposure: 14,271 units in 1-inch-or-larger bands, including 0 in 1.5-inch-or-larger bands and 0 in 2-inch-or-larger bands.

Affected states: Lakewood area, CO
1+ inRadar size estimate 74,263Population Affected 33,013Houses Affected HailHazards FreeAccount signup
Page 8 of 99
‹ 1 7 8 9 99 ›

Frequently asked questions

Can I search hail maps by coverage area?

Yes. The storm library supports coverage-area filtering so you can find hail maps and hail swaths in a target service area.

What kinds of storms appear in the HailMapr library?

The library focuses on published hail events, including ready storm maps and live storms once hail has been detected and a public swath is available.

Are HailMapr storm pages useful for roofers and adjusters?

Yes. They are built to help roofers, adjusters, restoration teams, and property owners review storm footprints before purchase.