Storm library

Browse live and recent hail maps.

Review storm footprints, hail swaths, reports, and replay access. Create a free account to save your setup and move into map access when a storm matters.

Search filters
Clear
Newest storms first by default.
Don't see your storm? Request a qualifying storm map and we'll email you when it is ready.
Showing 145-168 of 2367 storms · Page 7 of 99
‹ 1 6 7 8 99 ›
Request a storm map

Tell us about the storm and we'll build the map. Once it's published you'll get an email and can purchase it from the library — just like any other event.

Pittsburgh, PA — September 03, 2026 — regional hail footprint preview
Storm footprint preview

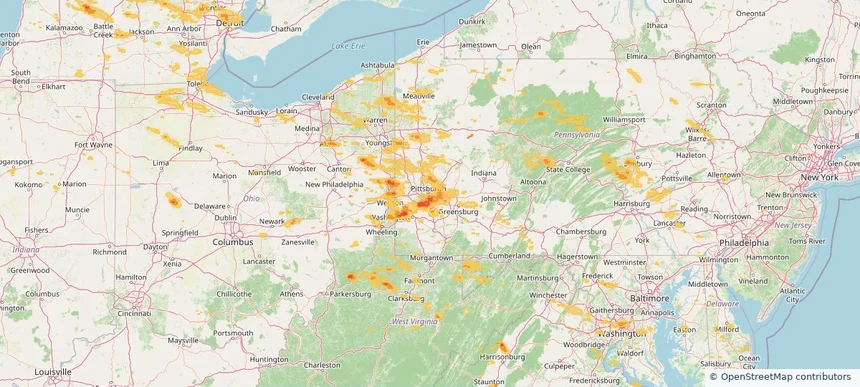
Local hail summary for the Pittsburgh area: 15.99 square miles of estimated ground-hail footprint; highest mapped band 1.5+ inches. 0 official hail report(s) within the summary area. Exposure estimates are not confirmed property damage. Open the map to explore the full coverage included in your access. Statistics cover the mapped hail footprint inside the Census boundary of Pittsburgh, PA, not the entire region. The place had 302,971 residents in the 2020 Census. A boundary intersection does not mean the whole community was hit. Estimated housing exposure: 24,493 units in 1-inch-or-larger bands, including 4,220 in 1.5-inch-or-larger bands and 0 in 2-inch-or-larger bands.

Affected states: Pittsburgh area, PA
1.5+ inRadar size estimate 64,899Population Affected 34,176Houses Affected HailHazards FreeAccount signup
Richfield, WI — September 03, 2026 — regional hail footprint preview
Storm footprint preview

Local hail summary for the Richfield area: 16.01 square miles of estimated ground-hail footprint; highest mapped band 1+ inches. 0 official hail report(s) within the summary area. Exposure estimates are not confirmed property damage. Open the map to explore the full coverage included in your access. Statistics cover the mapped hail footprint inside the Census boundary of Richfield, WI, not the entire region. The place had 11,739 residents in the 2020 Census. A boundary intersection does not mean the whole community was hit. Estimated housing exposure: 258 units in 1-inch-or-larger bands, including 0 in 1.5-inch-or-larger bands and 0 in 2-inch-or-larger bands.

Affected states: Richfield area, WI
1+ inRadar size estimate 3,683Population Affected 1,491Houses Affected HailHazards FreeAccount signup
Royal Oak, MI — September 03, 2026 — regional hail footprint preview
Storm footprint preview

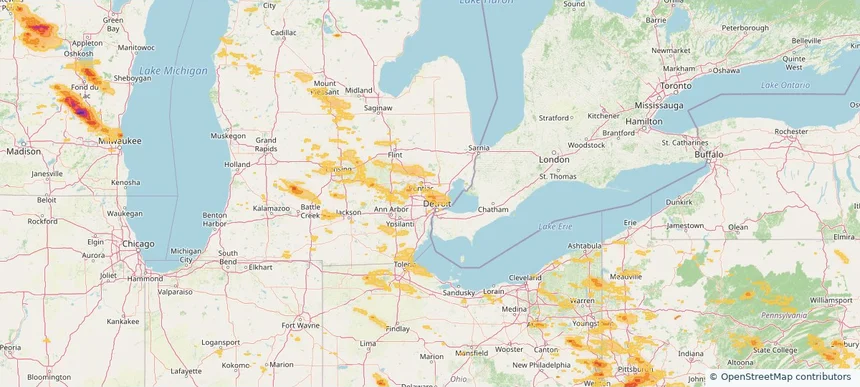
Local hail summary for the Royal Oak area: 0.48 square miles of estimated ground-hail footprint; highest mapped band 1+ inches. 0 official hail report(s) within the summary area. Exposure estimates are not confirmed property damage. Open the map to explore the full coverage included in your access. Statistics cover the mapped hail footprint inside the Census boundary of Royal Oak, MI, not the entire region. The place had 58,211 residents in the 2020 Census. A boundary intersection does not mean the whole community was hit. Estimated housing exposure: 734 units in 1-inch-or-larger bands, including 0 in 1.5-inch-or-larger bands and 0 in 2-inch-or-larger bands.

Affected states: Royal Oak area, MI
1+ inRadar size estimate 2,602Population Affected 1,339Houses Affected HailHazards FreeAccount signup
Washington, DC — September 03, 2026 — regional hail footprint preview
Storm footprint preview

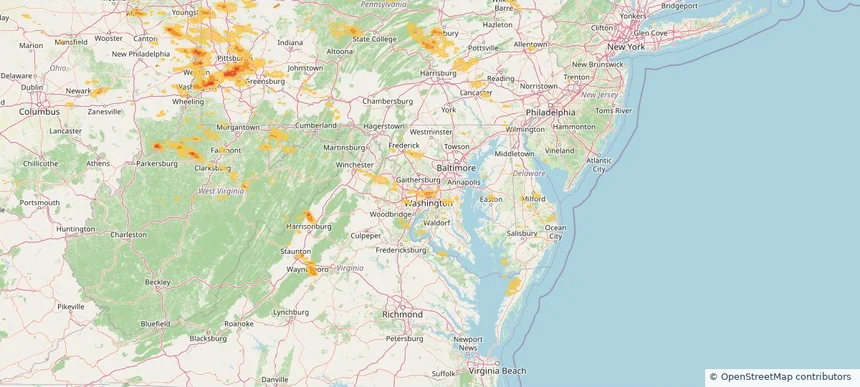
Local hail summary for the Washington area: 4.90 square miles of estimated ground-hail footprint; highest mapped band 1+ inches. 0 official hail report(s) within the summary area. Exposure estimates are not confirmed property damage. Open the map to explore the full coverage included in your access. Statistics cover the mapped hail footprint inside the Census boundary of Washington, DC, not the entire region. The place had 689,545 residents in the 2020 Census. A boundary intersection does not mean the whole community was hit. Estimated housing exposure: 58,200 units in 1-inch-or-larger bands, including 0 in 1.5-inch-or-larger bands and 0 in 2-inch-or-larger bands.

Affected states: Washington area, DC
1+ inRadar size estimate 106,988Population Affected 67,353Houses Affected HailHazards FreeAccount signup
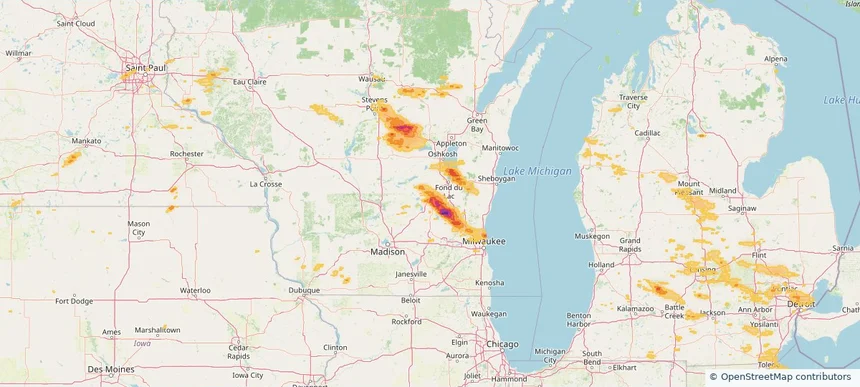
Waupun, WI — September 03, 2026 — regional hail footprint preview
Storm footprint preview

Local hail summary for the Waupun area: 4.68 square miles of estimated ground-hail footprint; highest mapped band 1+ inches. 0 official hail report(s) within the summary area. Exposure estimates are not confirmed property damage. Open the map to explore the full coverage included in your access. Statistics cover the mapped hail footprint inside the Census boundary of Waupun, WI, not the entire region. The place had 11,344 residents in the 2020 Census. A boundary intersection does not mean the whole community was hit. Estimated housing exposure: 3,495 units in 1-inch-or-larger bands, including 0 in 1.5-inch-or-larger bands and 0 in 2-inch-or-larger bands.

Affected states: Waupun area, WI
1+ inRadar size estimate 11,027Population Affected 3,698Houses Affected HailHazards FreeAccount signup
West Mifflin, PA — September 03, 2026 — regional hail footprint preview
Storm footprint preview

Local hail summary for the West Mifflin area: 11.53 square miles of estimated ground-hail footprint; highest mapped band 1.5+ inches. 1 official hail report(s) within the summary area. Exposure estimates are not confirmed property damage. Open the map to explore the full coverage included in your access. Statistics cover the mapped hail footprint inside the Census boundary of West Mifflin, PA, not the entire region. The place had 19,589 residents in the 2020 Census. A boundary intersection does not mean the whole community was hit. Estimated housing exposure: 5,861 units in 1-inch-or-larger bands, including 109 in 1.5-inch-or-larger bands and 0 in 2-inch-or-larger bands.

Affected states: West Mifflin area, PA
1.5+ inRadar size estimate 17,609Population Affected 8,479Houses Affected HailHazards FreeAccount signup
Whitehall, PA — September 03, 2026 — regional hail footprint preview
Storm footprint preview

Local hail summary for the Whitehall area: 3.33 square miles of estimated ground-hail footprint; highest mapped band 1.5+ inches. 0 official hail report(s) within the summary area. Exposure estimates are not confirmed property damage. Open the map to explore the full coverage included in your access. Statistics cover the mapped hail footprint inside the Census boundary of Whitehall, PA, not the entire region. The place had 15,064 residents in the 2020 Census. A boundary intersection does not mean the whole community was hit. Estimated housing exposure: 6,799 units in 1-inch-or-larger bands, including 1,752 in 1.5-inch-or-larger bands and 0 in 2-inch-or-larger bands.

Affected states: Whitehall area, PA
1.5+ inRadar size estimate 14,807Population Affected 6,799Houses Affected HailHazards FreeAccount signup
Nationwide Daily Hail, Wind & Tornado Map - September 3, 2026 — regional hail footprint preview
Storm footprint preview
Sep 2, 2026 10:00 PM to Sep 4, 2026 1:45 AM CST

Nationwide Daily Hail, Wind & Tornado Map - September 3, 2026

Hail as large as 2.30 inches was reported near 3 miles west-northwest of Elbow Lake, MN. Wind up to 86 mph was reported near 1 mile southwest of Braddock, PA. 2 tornadoes were reported, including one near Lincoln Park, MI. The storm had 20 official hail reports.

Affected states: National, AL, AR, CO, DE, DC, FL, IL, IN, IA, LA, MD, MI, MN, MS, MT, NE, NJ, NY, NC, ND, OH, PA, SD, TX, VA, WV, WI
3.0 inRadar size estimate 3,351,519Population Affected 1,557,630Houses Affected Hail · Wind · TornadoHazards FreeAccount signup
Conneaut, OH — September 02, 2026 — regional hail footprint preview
Storm footprint preview

Local hail summary for the Conneaut area: 15.93 square miles of estimated ground-hail footprint; highest mapped band 1.5+ inches. 0 official hail report(s) within the summary area. Exposure estimates are not confirmed property damage. Open the map to explore the full coverage included in your access. Statistics cover the mapped hail footprint inside the Census boundary of Conneaut, OH, not the entire region. The place had 12,318 residents in the 2020 Census. A boundary intersection does not mean the whole community was hit. Estimated housing exposure: 846 units in 1-inch-or-larger bands, including 63 in 1.5-inch-or-larger bands and 0 in 2-inch-or-larger bands.

Affected states: Conneaut area, OH
1.5+ inRadar size estimate 4,154Population Affected 2,261Houses Affected HailHazards FreeAccount signup
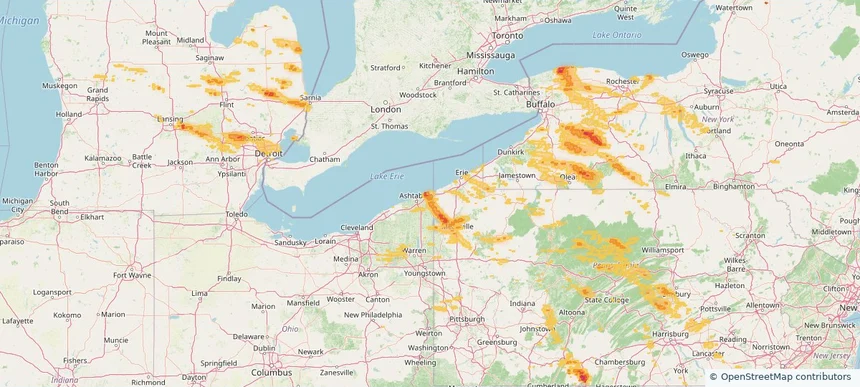
Le Mars, IA — September 02, 2026 — regional hail footprint preview
Storm footprint preview

Local hail summary for the Le Mars area: 6.56 square miles of estimated ground-hail footprint; highest mapped band 1+ inches. 0 official hail report(s) within the summary area. Exposure estimates are not confirmed property damage. Open the map to explore the full coverage included in your access. Statistics cover the mapped hail footprint inside the Census boundary of Le Mars, IA, not the entire region. The place had 10,571 residents in the 2020 Census. A boundary intersection does not mean the whole community was hit. Estimated housing exposure: 4,074 units in 1-inch-or-larger bands, including 0 in 1.5-inch-or-larger bands and 0 in 2-inch-or-larger bands.

Affected states: Le Mars area, IA
1+ inRadar size estimate 10,425Population Affected 4,476Houses Affected HailHazards FreeAccount signup
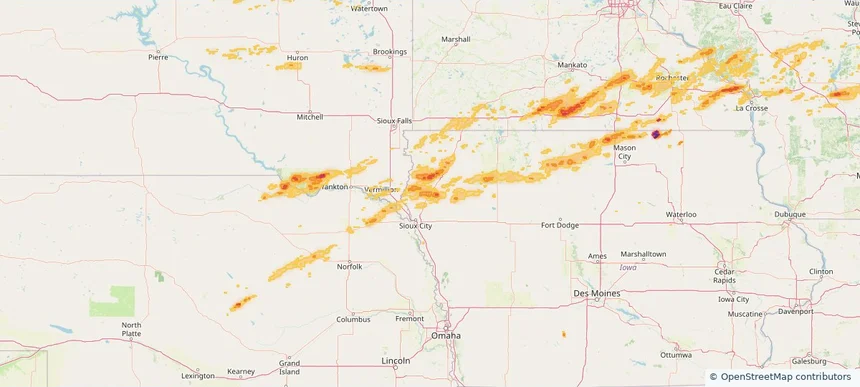
Owatonna, MN — September 02, 2026 — regional hail footprint preview
Storm footprint preview

Local hail summary for the Owatonna area: 13.48 square miles of estimated ground-hail footprint; highest mapped band 1.5+ inches. 1 official hail report(s) within the summary area. Exposure estimates are not confirmed property damage. Open the map to explore the full coverage included in your access. Statistics cover the mapped hail footprint inside the Census boundary of Owatonna, MN, not the entire region. The place had 26,420 residents in the 2020 Census. A boundary intersection does not mean the whole community was hit. Estimated housing exposure: 10,185 units in 1-inch-or-larger bands, including 366 in 1.5-inch-or-larger bands and 0 in 2-inch-or-larger bands.

Affected states: Owatonna area, MN
1.5+ inRadar size estimate 26,349Population Affected 11,116Houses Affected HailHazards FreeAccount signup
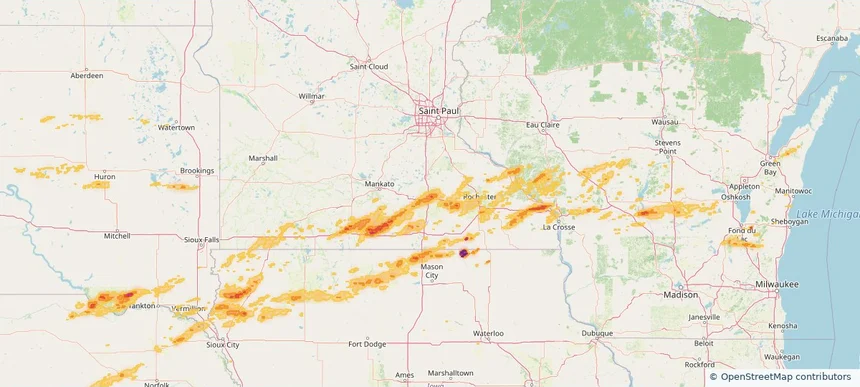
Wixom, MI — September 02, 2026 — regional hail footprint preview
Storm footprint preview

Local hail summary for the Wixom area: 3.04 square miles of estimated ground-hail footprint; highest mapped band 1+ inches. 0 official hail report(s) within the summary area. Exposure estimates are not confirmed property damage. Open the map to explore the full coverage included in your access. Statistics cover the mapped hail footprint inside the Census boundary of Wixom, MI, not the entire region. The place had 17,193 residents in the 2020 Census. A boundary intersection does not mean the whole community was hit. Estimated housing exposure: 1,440 units in 1-inch-or-larger bands, including 0 in 1.5-inch-or-larger bands and 0 in 2-inch-or-larger bands.

Affected states: Wixom area, MI
1+ inRadar size estimate 7,750Population Affected 2,982Houses Affected HailHazards FreeAccount signup
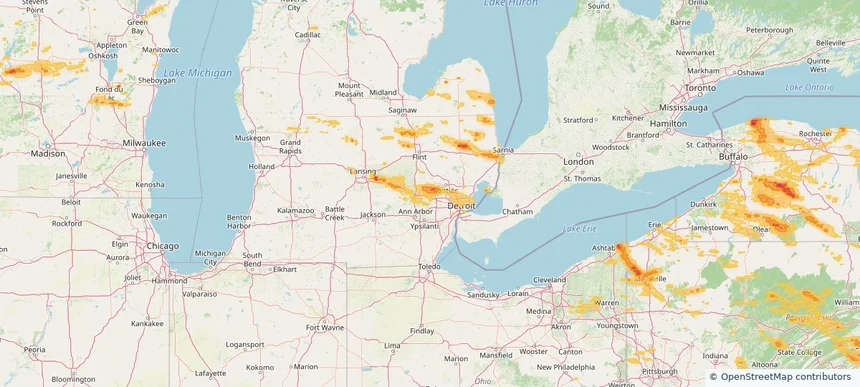
Nationwide Daily Hail, Wind & Tornado Map - September 2, 2026 — regional hail footprint preview
Storm footprint preview
Sep 1, 2026 10:00 PM to Sep 3, 2026 1:45 AM CST

Nationwide Daily Hail, Wind & Tornado Map - September 2, 2026

Hail as large as 4.00 inches was reported near 1 mile west of Easton, MN. Wind up to 100 mph was reported near 4 miles north of Britt, IA. 10 tornadoes were reported, including one near Olcott, NY. The storm had 14 official hail reports.

Affected states: National, AZ, CO, FL, ID, IA, MD, MI, MN, MS, MT, NE, NY, NC, ND, OH, PA, SD, TX, UT, VA, WV, WI
3.0 inRadar size estimate 1,614,919Population Affected 717,403Houses Affected Hail · Wind · TornadoHazards FreeAccount signup
Le Mars, IA — September 01, 2026 — regional hail footprint preview
Storm footprint preview

Local hail summary for the Le Mars area: 6.56 square miles of estimated ground-hail footprint; highest mapped band 1+ inches. 0 official hail report(s) within the summary area. Exposure estimates are not confirmed property damage. Open the map to explore the full coverage included in your access. Statistics cover the mapped hail footprint inside the Census boundary of Le Mars, IA, not the entire region. The place had 10,571 residents in the 2020 Census. A boundary intersection does not mean the whole community was hit. Estimated housing exposure: 4,074 units in 1-inch-or-larger bands, including 0 in 1.5-inch-or-larger bands and 0 in 2-inch-or-larger bands.

Affected states: Le Mars area, IA
1+ inRadar size estimate 10,425Population Affected 4,476Houses Affected HailHazards FreeAccount signup
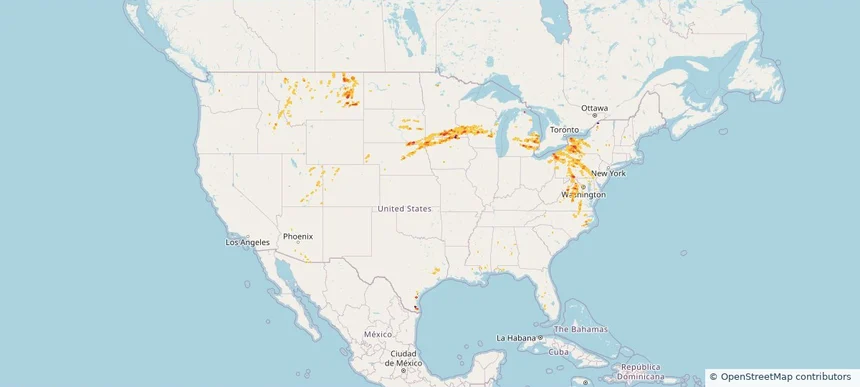
Owatonna, MN — September 01, 2026 — regional hail footprint preview
Storm footprint preview

Local hail summary for the Owatonna area: 13.48 square miles of estimated ground-hail footprint; highest mapped band 1.5+ inches. 1 official hail report(s) within the summary area. Exposure estimates are not confirmed property damage. Open the map to explore the full coverage included in your access. Statistics cover the mapped hail footprint inside the Census boundary of Owatonna, MN, not the entire region. The place had 26,420 residents in the 2020 Census. A boundary intersection does not mean the whole community was hit. Estimated housing exposure: 10,185 units in 1-inch-or-larger bands, including 338 in 1.5-inch-or-larger bands and 0 in 2-inch-or-larger bands.

Affected states: Owatonna area, MN
1.5+ inRadar size estimate 26,349Population Affected 11,116Houses Affected HailHazards FreeAccount signup
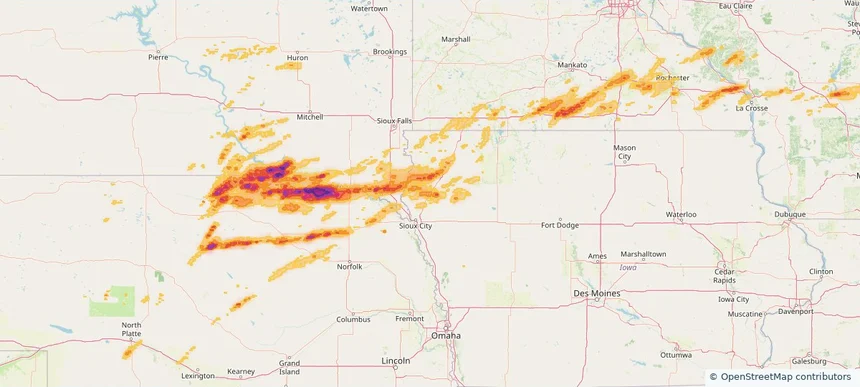
Robertsville, NJ — September 01, 2026 — regional hail footprint preview
Storm footprint preview

Local hail summary for the Robertsville area: 0.95 square miles of estimated ground-hail footprint; highest mapped band 1+ inches. 0 official hail report(s) within the summary area. Exposure estimates are not confirmed property damage. Open the map to explore the full coverage included in your access. Statistics cover the mapped hail footprint inside the Census boundary of Robertsville, NJ, not the entire region. The place had 11,399 residents in the 2020 Census. A boundary intersection does not mean the whole community was hit. Estimated housing exposure: 138 units in 1-inch-or-larger bands, including 0 in 1.5-inch-or-larger bands and 0 in 2-inch-or-larger bands.

Affected states: Robertsville area, NJ
1+ inRadar size estimate 1,666Population Affected 527Houses Affected HailHazards FreeAccount signup
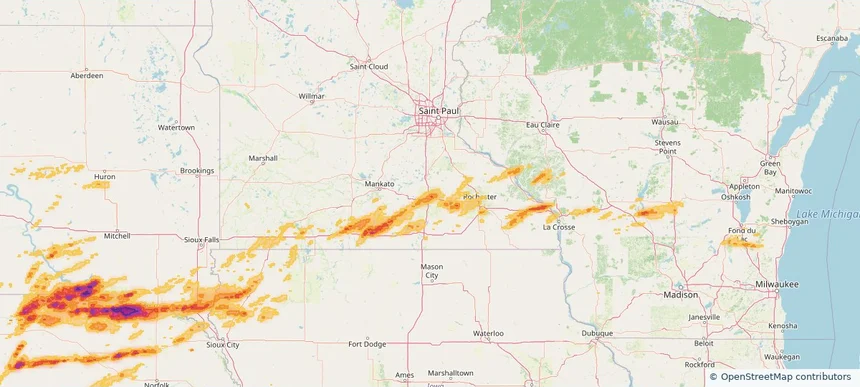
Twin Falls, ID — September 01, 2026 — regional hail footprint preview
Storm footprint preview

Local hail summary for the Twin Falls area: 4.96 square miles of estimated ground-hail footprint; highest mapped band 1+ inches. 0 official hail report(s) within the summary area. Exposure estimates are not confirmed property damage. Open the map to explore the full coverage included in your access. Statistics cover the mapped hail footprint inside the Census boundary of Twin Falls, ID, not the entire region. The place had 51,807 residents in the 2020 Census. A boundary intersection does not mean the whole community was hit. Estimated housing exposure: 769 units in 1-inch-or-larger bands, including 0 in 1.5-inch-or-larger bands and 0 in 2-inch-or-larger bands.

Affected states: Twin Falls area, ID
1+ inRadar size estimate 13,933Population Affected 5,357Houses Affected HailHazards FreeAccount signup
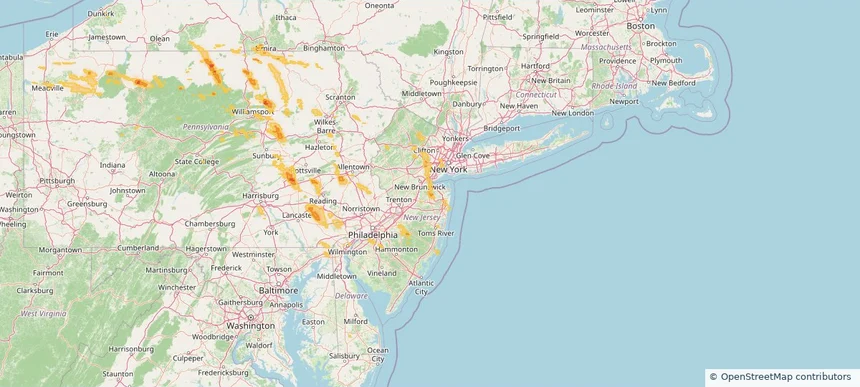
Nationwide Daily Hail, Wind & Tornado Map - September 1, 2026 — regional hail footprint preview
Storm footprint preview
Aug 31, 2026 10:00 PM to Sep 2, 2026 1:45 AM CST

Nationwide Daily Hail, Wind & Tornado Map - September 1, 2026

Hail as large as 4.00 inches was reported near 1 mile west of Easton, MN. Wind up to 130 mph was reported near 4 miles north-northwest of Fordyce, NE. 3 tornadoes were reported, including one near 4 miles west-northwest of Gaines, PA. The storm had 21 official hail reports.

Affected states: National, AZ, CA, CO, DE, FL, ID, IA, KS, MD, MI, MN, NE, NV, NJ, NY, PA, SD, TX, UT, WI, WY
4.49 inRadar size estimate 821,826Population Affected 333,181Houses Affected Hail · Wind · TornadoHazards FreeAccount signup
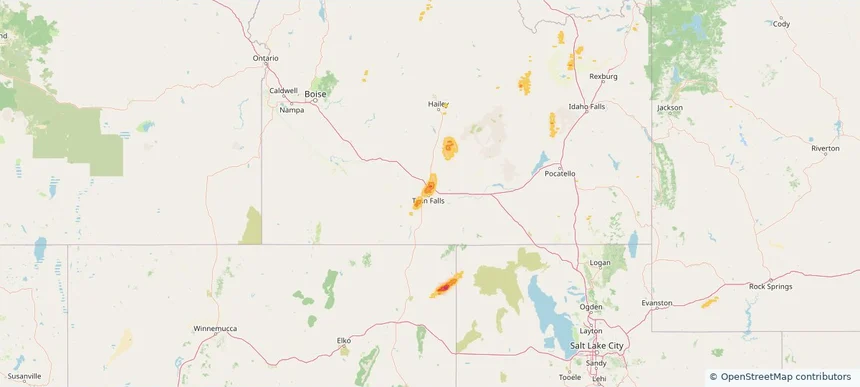
Ogden, UT — August 31, 2026 — regional hail footprint preview
Storm footprint preview

Local hail summary for the Ogden area: 4.33 square miles of estimated ground-hail footprint; highest mapped band 1+ inches. 0 official hail report(s) within the summary area. Exposure estimates are not confirmed property damage. Open the map to explore the full coverage included in your access. Statistics cover the mapped hail footprint inside the Census boundary of Ogden, UT, not the entire region. The place had 87,321 residents in the 2020 Census. A boundary intersection does not mean the whole community was hit. Estimated housing exposure: 1,002 units in 1-inch-or-larger bands, including 0 in 1.5-inch-or-larger bands and 0 in 2-inch-or-larger bands.

Affected states: Ogden area, UT
1+ inRadar size estimate 17,809Population Affected 7,121Houses Affected HailHazards FreeAccount signup
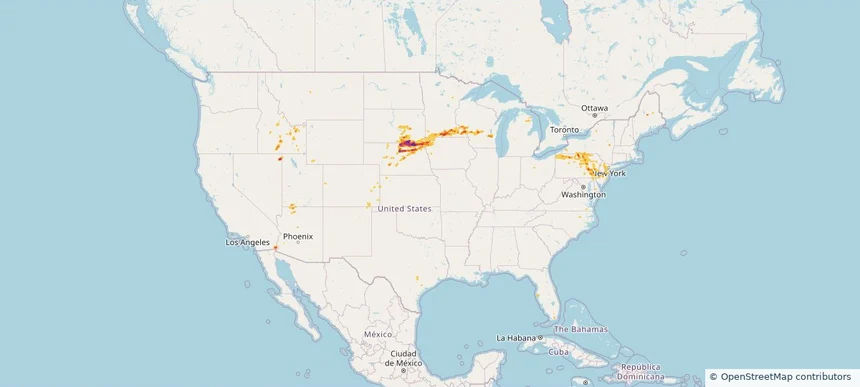
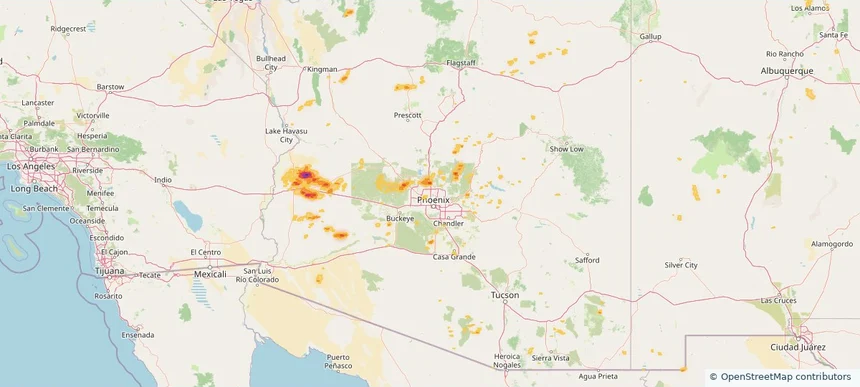
Peoria, AZ — August 31, 2026 — regional hail footprint preview
Storm footprint preview

Local hail summary for the Peoria area: 1.94 square miles of estimated ground-hail footprint; highest mapped band 1+ inches. 0 official hail report(s) within the summary area. Exposure estimates are not confirmed property damage. Open the map to explore the full coverage included in your access. Statistics cover the mapped hail footprint inside the Census boundary of Peoria, AZ, not the entire region. The place had 190,985 residents in the 2020 Census. A boundary intersection does not mean the whole community was hit. Estimated housing exposure: 529 units in 1-inch-or-larger bands, including 0 in 1.5-inch-or-larger bands and 0 in 2-inch-or-larger bands.

Affected states: Peoria area, AZ
1+ inRadar size estimate 3,013Population Affected 986Houses Affected HailHazards FreeAccount signup
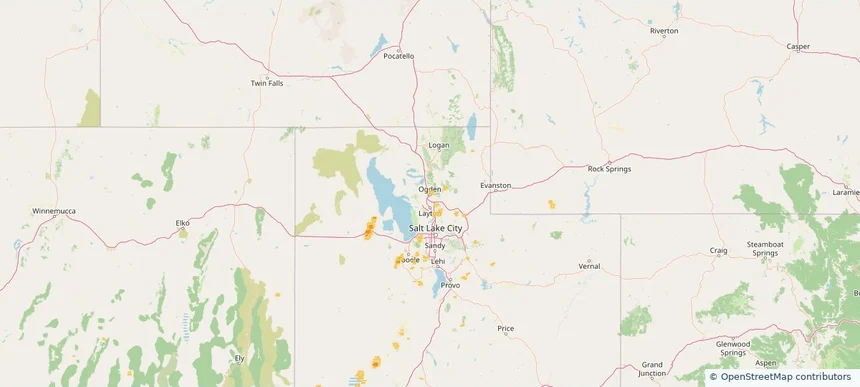
Phoenix, AZ — August 31, 2026 — regional hail footprint preview
Storm footprint preview

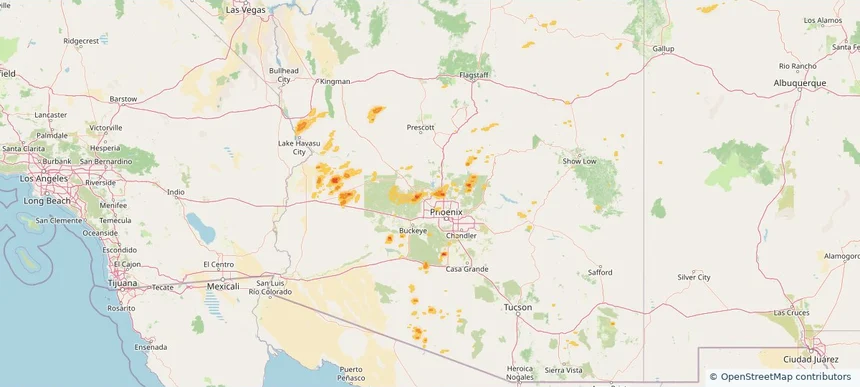
Local hail summary for the Phoenix area: 21.39 square miles of estimated ground-hail footprint; highest mapped band 1.5+ inches. 0 official hail report(s) within the summary area. Exposure estimates are not confirmed property damage. Open the map to explore the full coverage included in your access. Statistics cover the mapped hail footprint inside the Census boundary of Phoenix, AZ, not the entire region. The place had 1,608,139 residents in the 2020 Census. A boundary intersection does not mean the whole community was hit. Estimated housing exposure: 4,391 units in 1-inch-or-larger bands, including 20 in 1.5-inch-or-larger bands and 0 in 2-inch-or-larger bands.

Affected states: Phoenix area, AZ
1.5+ inRadar size estimate 13,623Population Affected 5,106Houses Affected HailHazards FreeAccount signup
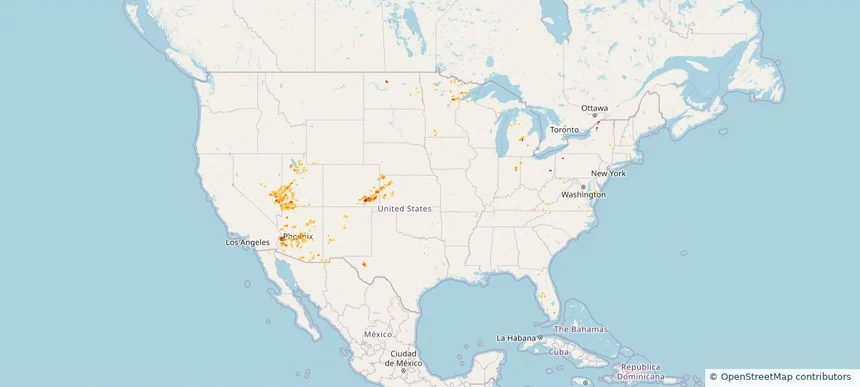
Nationwide Daily Hail & Wind Map - August 31, 2026 — regional hail footprint preview
Storm footprint preview
Aug 30, 2026 10:00 PM to Sep 1, 2026 1:45 AM CST

Nationwide Daily Hail & Wind Map - August 31, 2026

Hail as large as 1.00 inches was reported near 2 miles south-southwest of Caliente, NV. Wind up to 89 mph was reported near 7 miles southeast of Lamar, CO. The storm had 6 official hail reports.

Affected states: National, AZ, CO, FL, IN, KS, MD, MI, MN, NE, NV, NM, NY, ND, OH, PA, TX, UT, WY
3.0 inRadar size estimate 110,238Population Affected 43,609Houses Affected Hail · WindHazards FreeAccount signup
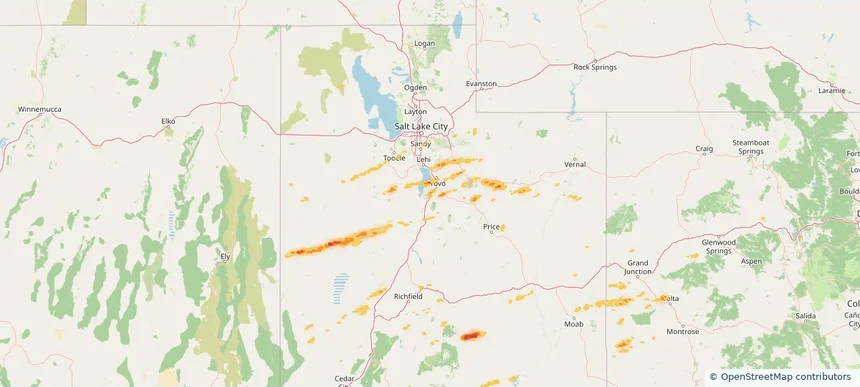
Payson, UT — August 30, 2026 — regional hail footprint preview
Storm footprint preview

Local hail summary for the Payson area: 3.08 square miles of estimated ground-hail footprint; highest mapped band 1+ inches. 0 official hail report(s) within the summary area. Exposure estimates are not confirmed property damage. Open the map to explore the full coverage included in your access. Statistics cover the mapped hail footprint inside the Census boundary of Payson, UT, not the entire region. The place had 21,101 residents in the 2020 Census. A boundary intersection does not mean the whole community was hit. Estimated housing exposure: 320 units in 1-inch-or-larger bands, including 0 in 1.5-inch-or-larger bands and 0 in 2-inch-or-larger bands.

Affected states: Payson area, UT
1+ inRadar size estimate 2,994Population Affected 903Houses Affected HailHazards FreeAccount signup
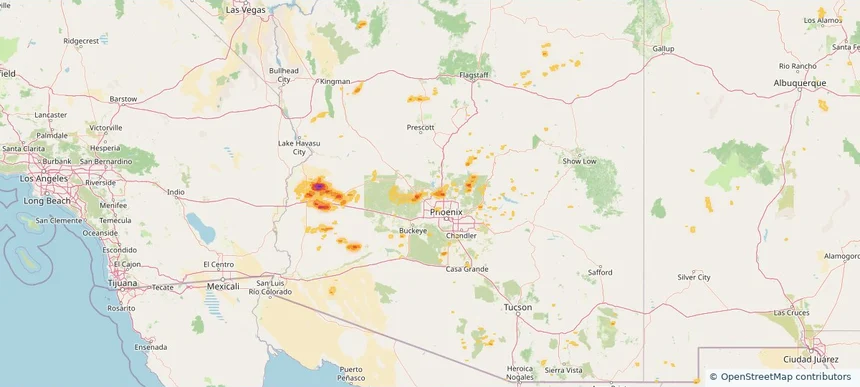
Peoria, AZ — August 30, 2026 — regional hail footprint preview
Storm footprint preview

Local hail summary for the Peoria area: 1.94 square miles of estimated ground-hail footprint; highest mapped band 1+ inches. 0 official hail report(s) within the summary area. Exposure estimates are not confirmed property damage. Open the map to explore the full coverage included in your access. Statistics cover the mapped hail footprint inside the Census boundary of Peoria, AZ, not the entire region. The place had 190,985 residents in the 2020 Census. A boundary intersection does not mean the whole community was hit. Estimated housing exposure: 529 units in 1-inch-or-larger bands, including 0 in 1.5-inch-or-larger bands and 0 in 2-inch-or-larger bands.

Affected states: Peoria area, AZ
1+ inRadar size estimate 3,013Population Affected 986Houses Affected HailHazards FreeAccount signup
Page 7 of 99
‹ 1 6 7 8 99 ›

Frequently asked questions

Can I search hail maps by coverage area?

Yes. The storm library supports coverage-area filtering so you can find hail maps and hail swaths in a target service area.

What kinds of storms appear in the HailMapr library?

The library focuses on published hail events, including ready storm maps and live storms once hail has been detected and a public swath is available.

Are HailMapr storm pages useful for roofers and adjusters?

Yes. They are built to help roofers, adjusters, restoration teams, and property owners review storm footprints before purchase.