
Storm library

Browse live and recent hail maps.

Review storm footprints, hail swaths, reports, and replay access. Create a free account to save your setup and move into map access when a storm matters.

Search filters
Clear
Newest storms first by default.
Don't see your storm? Request a qualifying storm map and we'll email you when it is ready.
Showing 2257-2280 of 2368 storms · Page 95 of 99
‹ 1 94 95 96 99 ›
Request a storm map

Tell us about the storm and we'll build the map. Once it's published you'll get an email and can purchase it from the library — just like any other event.

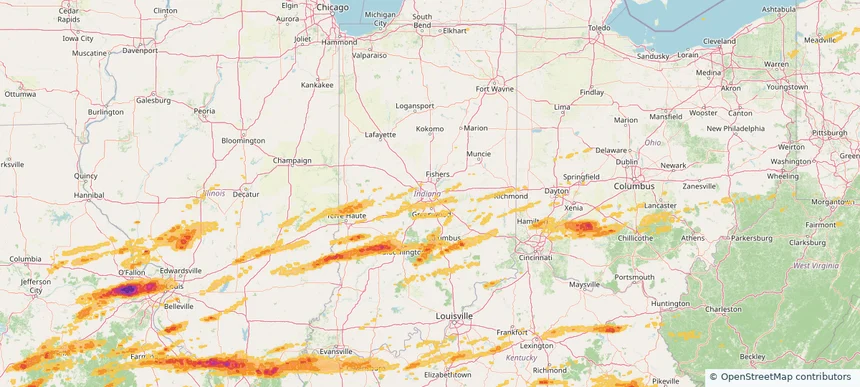
Indianapolis city (balance), IN — May 16, 2025 — regional hail footprint preview
Storm footprint preview

Local hail summary for the Indianapolis city (balance) area: 29.55 square miles of estimated ground-hail footprint; highest mapped band 1+ inches. 0 official hail report(s) within the summary area. Exposure estimates are not confirmed property damage. Open the map to explore the full coverage included in your access. Statistics cover the mapped hail footprint inside the Census boundary of Indianapolis city (balance), IN, not the entire region. The place had 887,642 residents in the 2020 Census. A boundary intersection does not mean the whole community was hit. Estimated housing exposure: 491 units in 1-inch-or-larger bands, including 0 in 1.5-inch-or-larger bands and 0 in 2-inch-or-larger bands.

Affected states: Indianapolis city (balance) area, IN
1+ inRadar size estimate 42,172Population Affected 15,664Houses Affected HailHazards FreeAccount signup
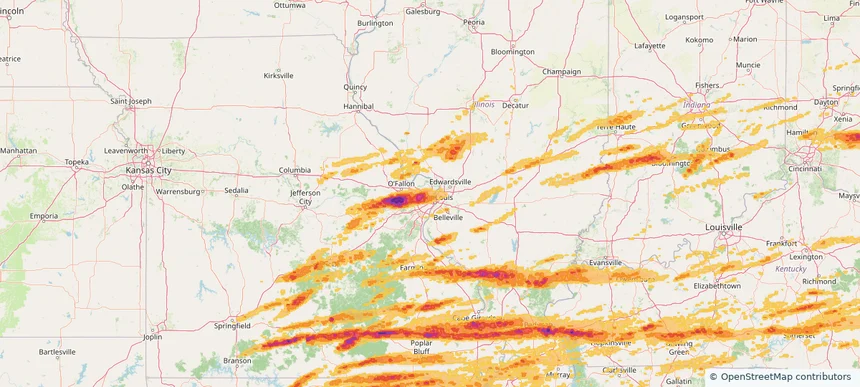
Jennings, MO — May 16, 2025 — regional hail footprint preview
Storm footprint preview

Local hail summary for the Jennings area: 3.73 square miles of estimated ground-hail footprint; highest mapped band 1+ inches. 0 official hail report(s) within the summary area. Exposure estimates are not confirmed property damage. Open the map to explore the full coverage included in your access. Statistics cover the mapped hail footprint inside the Census boundary of Jennings, MO, not the entire region. The place had 12,895 residents in the 2020 Census. A boundary intersection does not mean the whole community was hit. Estimated housing exposure: 1,476 units in 1-inch-or-larger bands, including 0 in 1.5-inch-or-larger bands and 0 in 2-inch-or-larger bands.

Affected states: Jennings area, MO
1+ inRadar size estimate 12,895Population Affected 6,781Houses Affected HailHazards FreeAccount signup
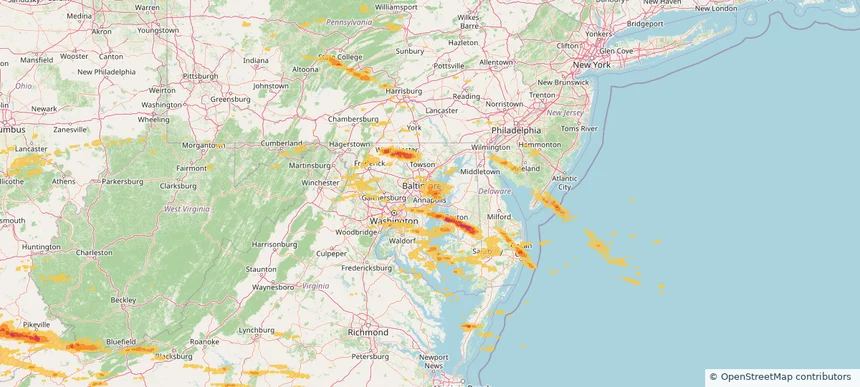
Lake Shore, MD — May 16, 2025 — regional hail footprint preview
Storm footprint preview

Local hail summary for the Lake Shore area: 6.73 square miles of estimated ground-hail footprint; highest mapped band 1+ inches. 0 official hail report(s) within the summary area. Exposure estimates are not confirmed property damage. Open the map to explore the full coverage included in your access. Statistics cover the mapped hail footprint inside the Census boundary of Lake Shore, MD, not the entire region. The place had 19,551 residents in the 2020 Census. A boundary intersection does not mean the whole community was hit. Estimated housing exposure: 1,067 units in 1-inch-or-larger bands, including 0 in 1.5-inch-or-larger bands and 0 in 2-inch-or-larger bands.

Affected states: Lake Shore area, MD
1+ inRadar size estimate 6,766Population Affected 2,331Houses Affected HailHazards FreeAccount signup
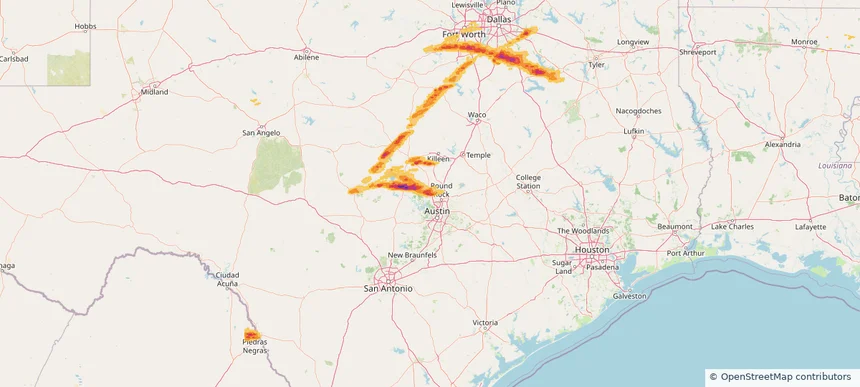
Leander, TX — May 16, 2025 — regional hail footprint preview
Storm footprint preview

Local hail summary for the Leander area: 24.26 square miles of estimated ground-hail footprint; highest mapped band 2+ inches. 3 official hail report(s) within the summary area. Exposure estimates are not confirmed property damage. Open the map to explore the full coverage included in your access. Statistics cover the mapped hail footprint inside the Census boundary of Leander, TX, not the entire region. The place had 59,202 residents in the 2020 Census. A boundary intersection does not mean the whole community was hit. Estimated housing exposure: 11,706 units in 1-inch-or-larger bands, including 8,100 in 1.5-inch-or-larger bands and 826 in 2-inch-or-larger bands.

Affected states: Leander area, TX
2+ inRadar size estimate 32,256Population Affected 12,357Houses Affected HailHazards FreeAccount signup
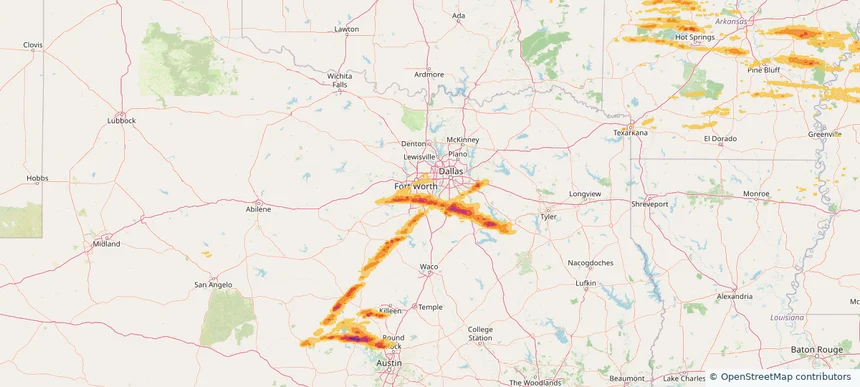
Mansfield, TX — May 16, 2025 — regional hail footprint preview
Storm footprint preview

Local hail summary for the Mansfield area: 3.28 square miles of estimated ground-hail footprint; highest mapped band 1+ inches. 0 official hail report(s) within the summary area. Exposure estimates are not confirmed property damage. Open the map to explore the full coverage included in your access. Statistics cover the mapped hail footprint inside the Census boundary of Mansfield, TX, not the entire region. The place had 72,602 residents in the 2020 Census. A boundary intersection does not mean the whole community was hit. Estimated housing exposure: 447 units in 1-inch-or-larger bands, including 0 in 1.5-inch-or-larger bands and 0 in 2-inch-or-larger bands.

Affected states: Mansfield area, TX
1+ inRadar size estimate 1,915Population Affected 640Houses Affected HailHazards FreeAccount signup
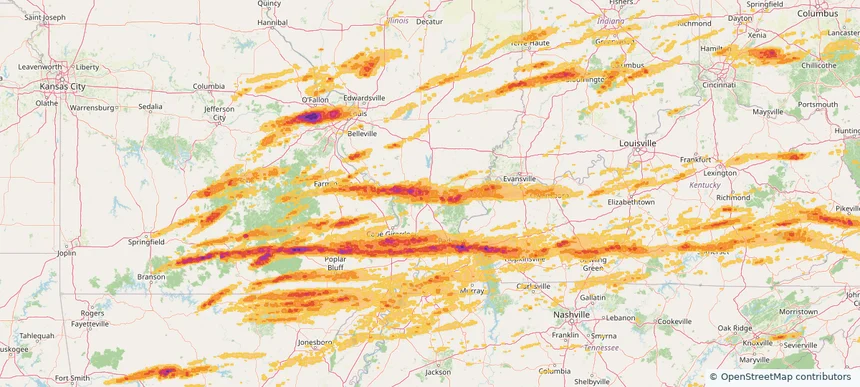
Marion, IL — May 16, 2025 — regional hail footprint preview
Storm footprint preview

Local hail summary for the Marion area: 14.61 square miles of estimated ground-hail footprint; highest mapped band 1.5+ inches. 1 official hail report(s) within the summary area. Exposure estimates are not confirmed property damage. Open the map to explore the full coverage included in your access. Statistics cover the mapped hail footprint inside the Census boundary of Marion, IL, not the entire region. The place had 16,855 residents in the 2020 Census. A boundary intersection does not mean the whole community was hit. Estimated housing exposure: 8,403 units in 1-inch-or-larger bands, including 1,285 in 1.5-inch-or-larger bands and 0 in 2-inch-or-larger bands.

Affected states: Marion area, IL
1.5+ inRadar size estimate 16,309Population Affected 8,403Houses Affected HailHazards FreeAccount signup
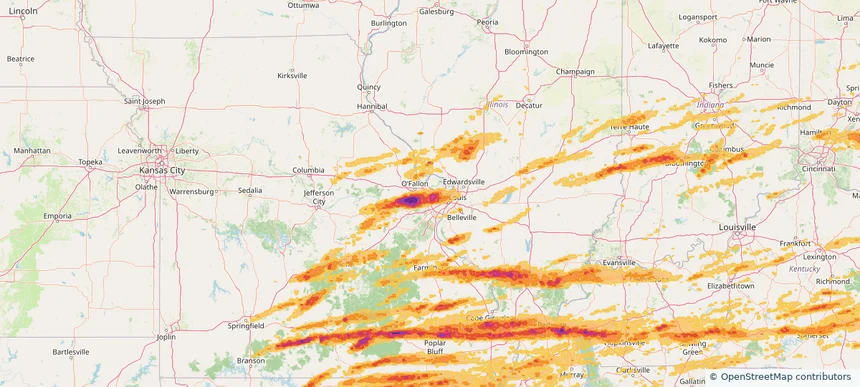
Maryland Heights, MO — May 16, 2025 — regional hail footprint preview
Storm footprint preview

Local hail summary for the Maryland Heights area: 23.61 square miles of estimated ground-hail footprint; highest mapped band 2+ inches. 0 official hail report(s) within the summary area. Exposure estimates are not confirmed property damage. Open the map to explore the full coverage included in your access. Statistics cover the mapped hail footprint inside the Census boundary of Maryland Heights, MO, not the entire region. The place had 28,284 residents in the 2020 Census. A boundary intersection does not mean the whole community was hit. Estimated housing exposure: 12,016 units in 1-inch-or-larger bands, including 10,218 in 1.5-inch-or-larger bands and 4,463 in 2-inch-or-larger bands.

Affected states: Maryland Heights area, MO
2+ inRadar size estimate 28,267Population Affected 13,423Houses Affected HailHazards FreeAccount signup
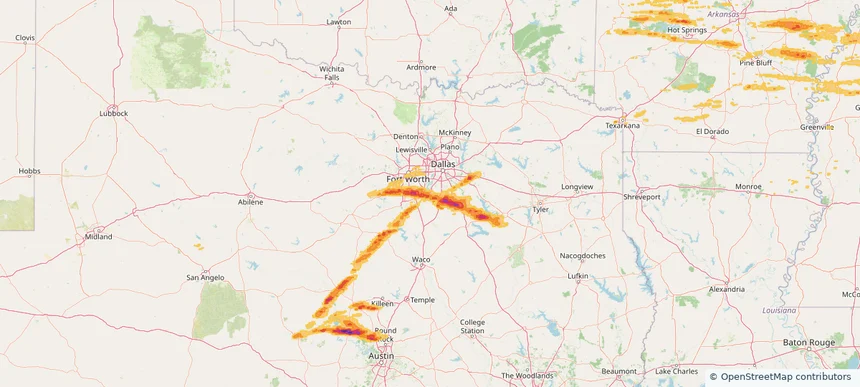
Midlothian, TX — May 16, 2025 — regional hail footprint preview
Storm footprint preview

Local hail summary for the Midlothian area: 34.39 square miles of estimated ground-hail footprint; highest mapped band 1.5+ inches. 1 official hail report(s) within the summary area. Exposure estimates are not confirmed property damage. Open the map to explore the full coverage included in your access. Statistics cover the mapped hail footprint inside the Census boundary of Midlothian, TX, not the entire region. The place had 35,125 residents in the 2020 Census. A boundary intersection does not mean the whole community was hit. Estimated housing exposure: 5,849 units in 1-inch-or-larger bands, including 1,415 in 1.5-inch-or-larger bands and 0 in 2-inch-or-larger bands.

Affected states: Midlothian area, TX
1.5+ inRadar size estimate 19,049Population Affected 6,331Houses Affected HailHazards FreeAccount signup
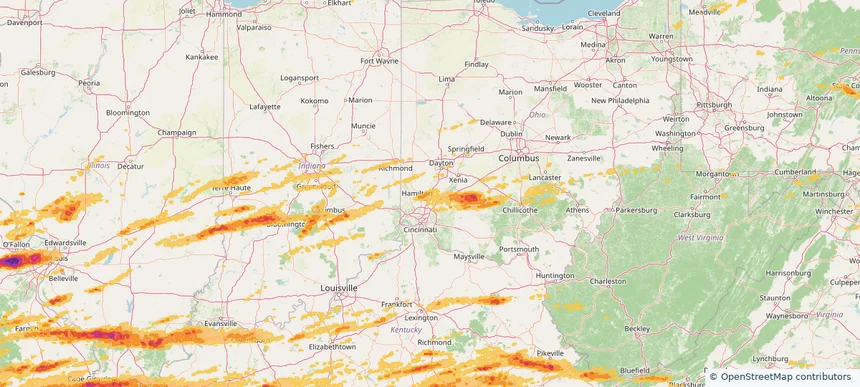
Monroe, OH — May 16, 2025 — regional hail footprint preview
Storm footprint preview

Local hail summary for the Monroe area: 12.56 square miles of estimated ground-hail footprint; highest mapped band 1+ inches. 0 official hail report(s) within the summary area. Exposure estimates are not confirmed property damage. Open the map to explore the full coverage included in your access. Statistics cover the mapped hail footprint inside the Census boundary of Monroe, OH, not the entire region. The place had 15,412 residents in the 2020 Census. A boundary intersection does not mean the whole community was hit. Estimated housing exposure: 2,538 units in 1-inch-or-larger bands, including 0 in 1.5-inch-or-larger bands and 0 in 2-inch-or-larger bands.

Affected states: Monroe area, OH
1+ inRadar size estimate 15,259Population Affected 5,578Houses Affected HailHazards FreeAccount signup
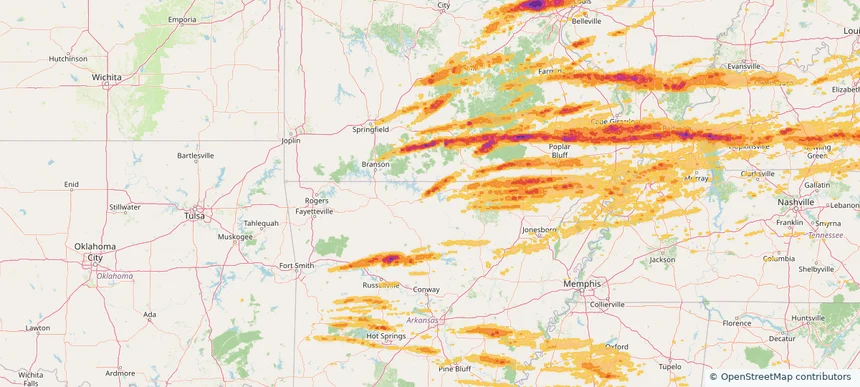
Mountain Home, AR — May 16, 2025 — regional hail footprint preview
Storm footprint preview

Local hail summary for the Mountain Home area: 3.01 square miles of estimated ground-hail footprint; highest mapped band 1+ inches. 0 official hail report(s) within the summary area. Exposure estimates are not confirmed property damage. Open the map to explore the full coverage included in your access. Statistics cover the mapped hail footprint inside the Census boundary of Mountain Home, AR, not the entire region. The place had 12,825 residents in the 2020 Census. A boundary intersection does not mean the whole community was hit. Estimated housing exposure: 673 units in 1-inch-or-larger bands, including 0 in 1.5-inch-or-larger bands and 0 in 2-inch-or-larger bands.

Affected states: Mountain Home area, AR
1+ inRadar size estimate 3,337Population Affected 1,707Houses Affected HailHazards FreeAccount signup
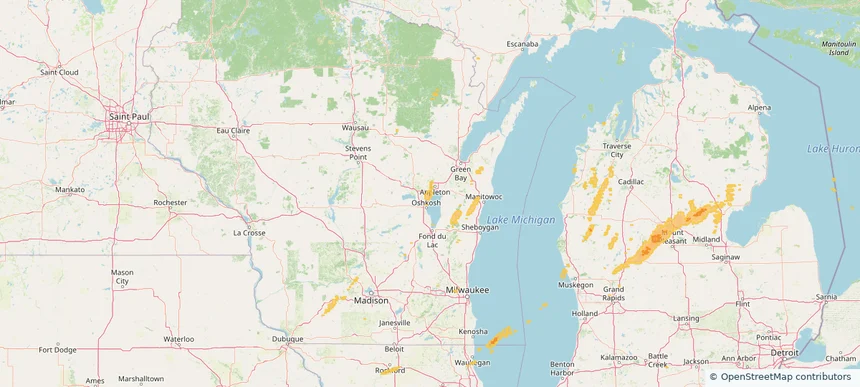
Neenah, WI — May 16, 2025 — regional hail footprint preview
Storm footprint preview

Local hail summary for the Neenah area: 9.31 square miles of estimated ground-hail footprint; highest mapped band 1+ inches. 0 official hail report(s) within the summary area. Exposure estimates are not confirmed property damage. Open the map to explore the full coverage included in your access. Statistics cover the mapped hail footprint inside the Census boundary of Neenah, WI, not the entire region. The place had 27,319 residents in the 2020 Census. A boundary intersection does not mean the whole community was hit. Estimated housing exposure: 910 units in 1-inch-or-larger bands, including 0 in 1.5-inch-or-larger bands and 0 in 2-inch-or-larger bands.

Affected states: Neenah area, WI
1+ inRadar size estimate 26,502Population Affected 11,881Houses Affected HailHazards FreeAccount signup
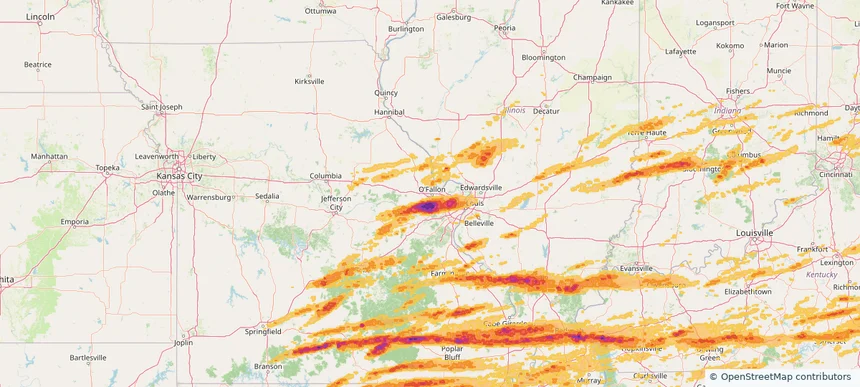
O'Fallon, MO — May 16, 2025 — regional hail footprint preview
Storm footprint preview

Local hail summary for the O'Fallon area: 3.12 square miles of estimated ground-hail footprint; highest mapped band 2+ inches. 0 official hail report(s) within the summary area. Exposure estimates are not confirmed property damage. Open the map to explore the full coverage included in your access. Statistics cover the mapped hail footprint inside the Census boundary of O'Fallon, MO, not the entire region. The place had 91,316 residents in the 2020 Census. A boundary intersection does not mean the whole community was hit. Estimated housing exposure: 2,396 units in 1-inch-or-larger bands, including 617 in 1.5-inch-or-larger bands and 0 in 2-inch-or-larger bands.

Affected states: O'Fallon area, MO
2+ inRadar size estimate 9,420Population Affected 3,703Houses Affected HailHazards FreeAccount signup
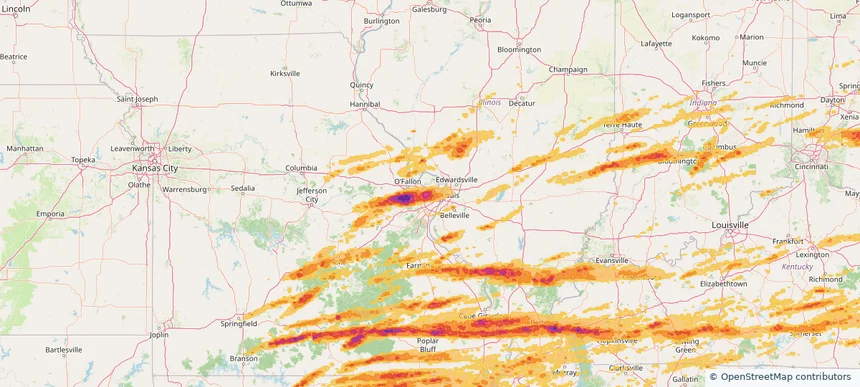
Overland, MO — May 16, 2025 — regional hail footprint preview
Storm footprint preview

Local hail summary for the Overland area: 4.41 square miles of estimated ground-hail footprint; highest mapped band 2+ inches. 1 official hail report(s) within the summary area. Exposure estimates are not confirmed property damage. Open the map to explore the full coverage included in your access. Statistics cover the mapped hail footprint inside the Census boundary of Overland, MO, not the entire region. The place had 15,955 residents in the 2020 Census. A boundary intersection does not mean the whole community was hit. Estimated housing exposure: 7,287 units in 1-inch-or-larger bands, including 7,287 in 1.5-inch-or-larger bands and 7,287 in 2-inch-or-larger bands.

Affected states: Overland area, MO
2+ inRadar size estimate 15,955Population Affected 7,287Houses Affected HailHazards FreeAccount signup
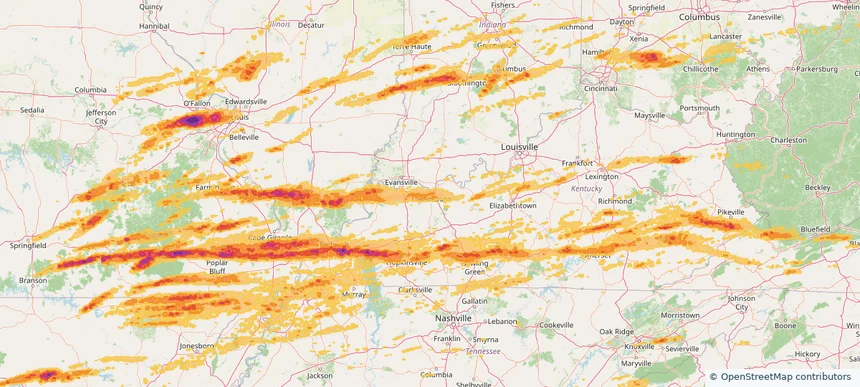
Owensboro, KY — May 16, 2025 — regional hail footprint preview
Storm footprint preview

Local hail summary for the Owensboro area: 20.46 square miles of estimated ground-hail footprint; highest mapped band 1+ inches. 1 official hail report(s) within the summary area. Exposure estimates are not confirmed property damage. Open the map to explore the full coverage included in your access. Statistics cover the mapped hail footprint inside the Census boundary of Owensboro, KY, not the entire region. The place had 60,183 residents in the 2020 Census. A boundary intersection does not mean the whole community was hit. Estimated housing exposure: 2,543 units in 1-inch-or-larger bands, including 0 in 1.5-inch-or-larger bands and 0 in 2-inch-or-larger bands.

Affected states: Owensboro area, KY
1+ inRadar size estimate 59,016Population Affected 26,408Houses Affected HailHazards FreeAccount signup
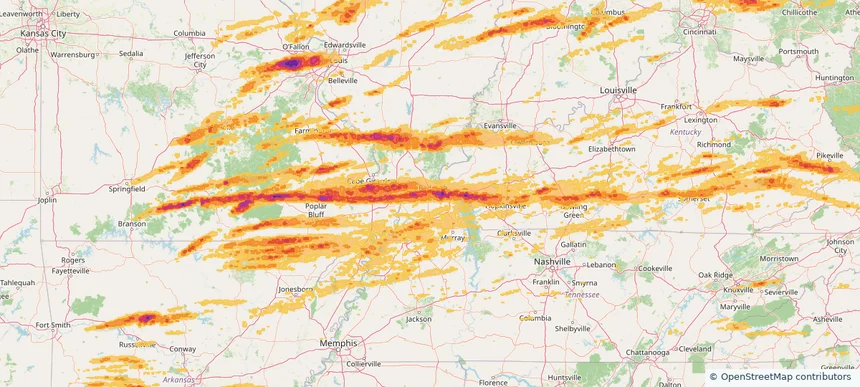
Paducah, KY — May 16, 2025 — regional hail footprint preview
Storm footprint preview

Local hail summary for the Paducah area: 20.73 square miles of estimated ground-hail footprint; highest mapped band 2+ inches. 0 official hail report(s) within the summary area. Exposure estimates are not confirmed property damage. Open the map to explore the full coverage included in your access. Statistics cover the mapped hail footprint inside the Census boundary of Paducah, KY, not the entire region. The place had 27,137 residents in the 2020 Census. A boundary intersection does not mean the whole community was hit. Estimated housing exposure: 13,228 units in 1-inch-or-larger bands, including 7,469 in 1.5-inch-or-larger bands and 10 in 2-inch-or-larger bands.

Affected states: Paducah area, KY
2+ inRadar size estimate 27,135Population Affected 13,228Houses Affected HailHazards FreeAccount signup
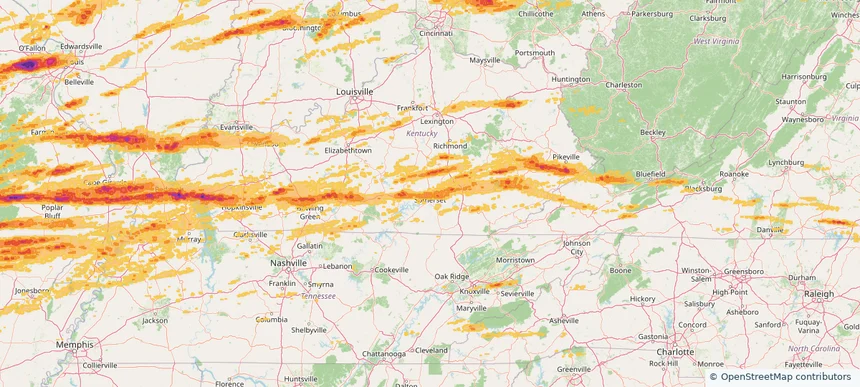
Somerset, KY — May 16, 2025 — regional hail footprint preview
Storm footprint preview

Local hail summary for the Somerset area: 12.35 square miles of estimated ground-hail footprint; highest mapped band 1+ inches. 0 official hail report(s) within the summary area. Exposure estimates are not confirmed property damage. Open the map to explore the full coverage included in your access. Statistics cover the mapped hail footprint inside the Census boundary of Somerset, KY, not the entire region. The place had 11,924 residents in the 2020 Census. A boundary intersection does not mean the whole community was hit. Estimated housing exposure: 5,336 units in 1-inch-or-larger bands, including 0 in 1.5-inch-or-larger bands and 0 in 2-inch-or-larger bands.

Affected states: Somerset area, KY
1+ inRadar size estimate 11,820Population Affected 5,559Houses Affected HailHazards FreeAccount signup
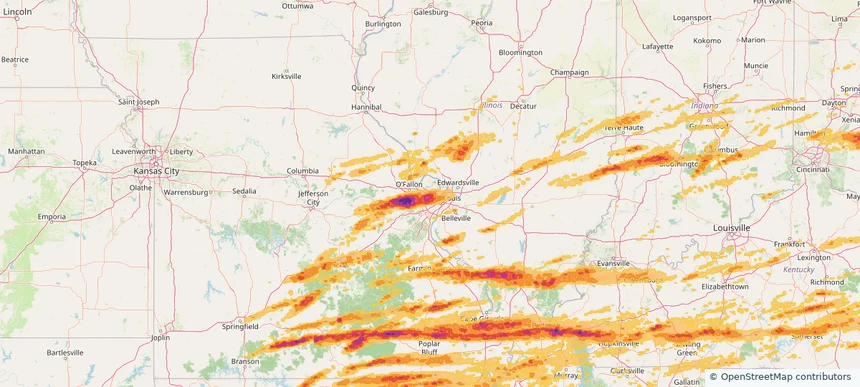
St. Ann, MO — May 16, 2025 — regional hail footprint preview
Storm footprint preview

Local hail summary for the St. Ann area: 3.16 square miles of estimated ground-hail footprint; highest mapped band 2+ inches. 0 official hail report(s) within the summary area. Exposure estimates are not confirmed property damage. Open the map to explore the full coverage included in your access. Statistics cover the mapped hail footprint inside the Census boundary of St. Ann, MO, not the entire region. The place had 13,019 residents in the 2020 Census. A boundary intersection does not mean the whole community was hit. Estimated housing exposure: 6,514 units in 1-inch-or-larger bands, including 6,205 in 1.5-inch-or-larger bands and 3,161 in 2-inch-or-larger bands.

Affected states: St. Ann area, MO
2+ inRadar size estimate 13,019Population Affected 6,514Houses Affected HailHazards FreeAccount signup
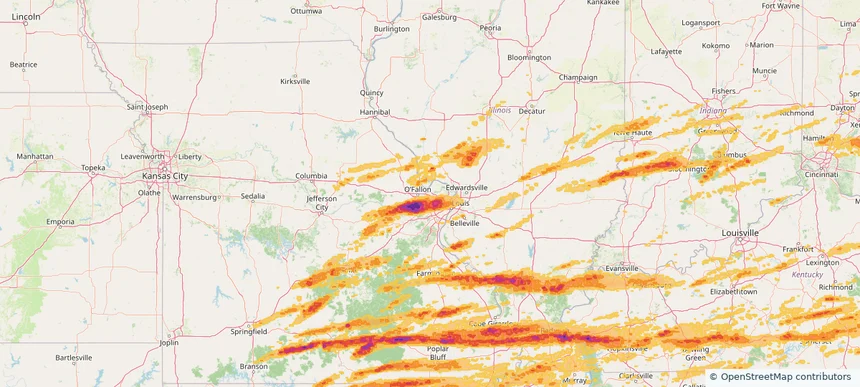
St. Charles, MO — May 16, 2025 — regional hail footprint preview
Storm footprint preview

Local hail summary for the St. Charles area: 5.04 square miles of estimated ground-hail footprint; highest mapped band 1+ inches. 0 official hail report(s) within the summary area. Exposure estimates are not confirmed property damage. Open the map to explore the full coverage included in your access. Statistics cover the mapped hail footprint inside the Census boundary of St. Charles, MO, not the entire region. The place had 70,493 residents in the 2020 Census. A boundary intersection does not mean the whole community was hit. Estimated housing exposure: 508 units in 1-inch-or-larger bands, including 0 in 1.5-inch-or-larger bands and 0 in 2-inch-or-larger bands.

Affected states: St. Charles area, MO
1+ inRadar size estimate 16,365Population Affected 7,756Houses Affected HailHazards FreeAccount signup
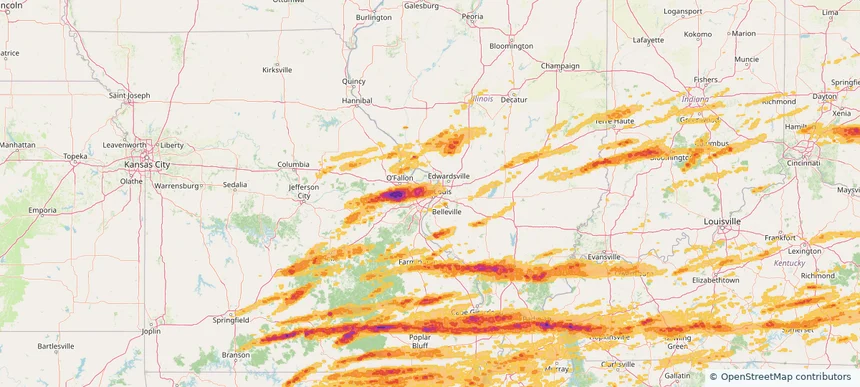
St. Louis, MO — May 16, 2025 — regional hail footprint preview
Storm footprint preview

Local hail summary for the St. Louis area: 29.97 square miles of estimated ground-hail footprint; highest mapped band 1.5+ inches. 0 official hail report(s) within the summary area. Exposure estimates are not confirmed property damage. Open the map to explore the full coverage included in your access. Statistics cover the mapped hail footprint inside the Census boundary of St. Louis, MO, not the entire region. The place had 301,578 residents in the 2020 Census. A boundary intersection does not mean the whole community was hit. Estimated housing exposure: 43,482 units in 1-inch-or-larger bands, including 1,120 in 1.5-inch-or-larger bands and 0 in 2-inch-or-larger bands.

Affected states: St. Louis area, MO
1.5+ inRadar size estimate 103,041Population Affected 63,173Houses Affected HailHazards FreeAccount signup
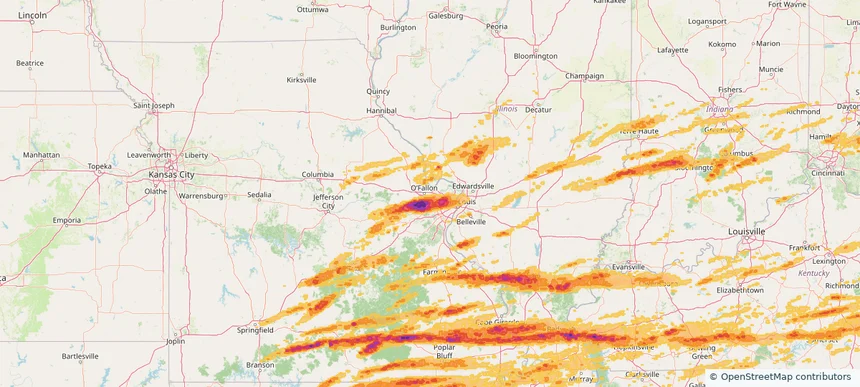
St. Peters, MO — May 16, 2025 — regional hail footprint preview
Storm footprint preview

Local hail summary for the St. Peters area: 4.01 square miles of estimated ground-hail footprint; highest mapped band 1.5+ inches. 0 official hail report(s) within the summary area. Exposure estimates are not confirmed property damage. Open the map to explore the full coverage included in your access. Statistics cover the mapped hail footprint inside the Census boundary of St. Peters, MO, not the entire region. The place had 57,732 residents in the 2020 Census. A boundary intersection does not mean the whole community was hit. Estimated housing exposure: 2,744 units in 1-inch-or-larger bands, including 34 in 1.5-inch-or-larger bands and 0 in 2-inch-or-larger bands.

Affected states: St. Peters area, MO
1.5+ inRadar size estimate 10,872Population Affected 5,163Houses Affected HailHazards FreeAccount signup
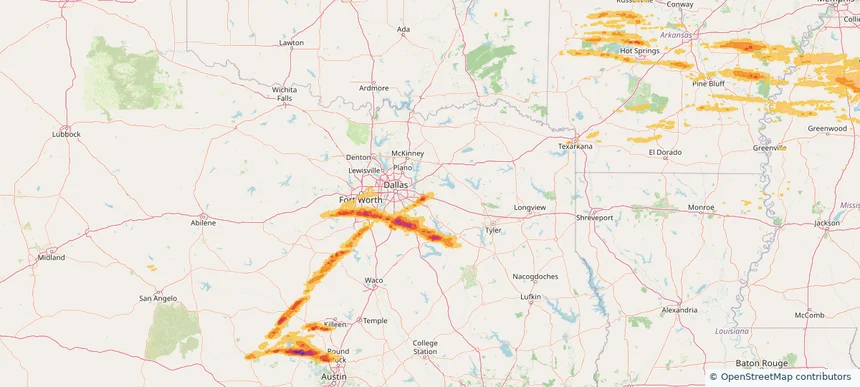
Terrell, TX — May 16, 2025 — regional hail footprint preview
Storm footprint preview

Local hail summary for the Terrell area: 5.77 square miles of estimated ground-hail footprint; highest mapped band 1+ inches. 1 official hail report(s) within the summary area. Exposure estimates are not confirmed property damage. Open the map to explore the full coverage included in your access. Statistics cover the mapped hail footprint inside the Census boundary of Terrell, TX, not the entire region. The place had 17,465 residents in the 2020 Census. A boundary intersection does not mean the whole community was hit. Estimated housing exposure: 317 units in 1-inch-or-larger bands, including 0 in 1.5-inch-or-larger bands and 0 in 2-inch-or-larger bands.

Affected states: Terrell area, TX
1+ inRadar size estimate 1,774Population Affected 679Houses Affected HailHazards FreeAccount signup
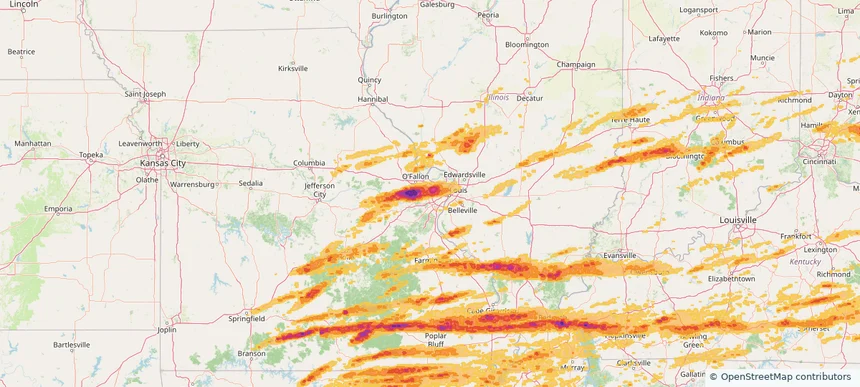
Town and Country, MO — May 16, 2025 — regional hail footprint preview
Storm footprint preview

Local hail summary for the Town and Country area: 11.52 square miles of estimated ground-hail footprint; highest mapped band 1.5+ inches. 0 official hail report(s) within the summary area. Exposure estimates are not confirmed property damage. Open the map to explore the full coverage included in your access. Statistics cover the mapped hail footprint inside the Census boundary of Town and Country, MO, not the entire region. The place had 11,640 residents in the 2020 Census. A boundary intersection does not mean the whole community was hit. Estimated housing exposure: 3,650 units in 1-inch-or-larger bands, including 2,670 in 1.5-inch-or-larger bands and 0 in 2-inch-or-larger bands.

Affected states: Town and Country area, MO
1.5+ inRadar size estimate 11,592Population Affected 3,826Houses Affected HailHazards FreeAccount signup
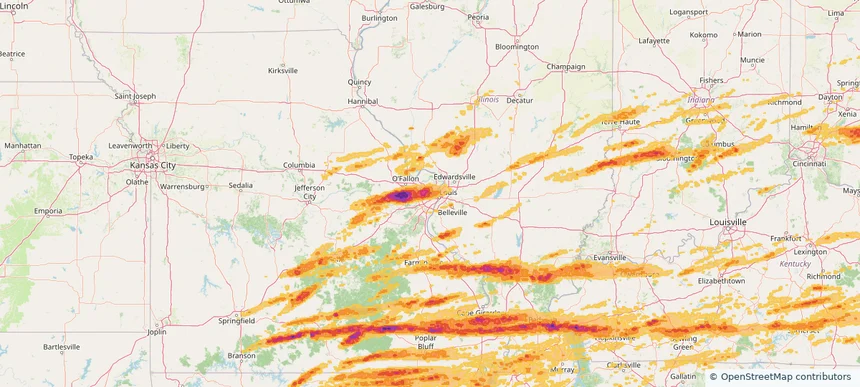
University City, MO — May 16, 2025 — regional hail footprint preview
Storm footprint preview

Local hail summary for the University City area: 5.88 square miles of estimated ground-hail footprint; highest mapped band 2+ inches. 0 official hail report(s) within the summary area. Exposure estimates are not confirmed property damage. Open the map to explore the full coverage included in your access. Statistics cover the mapped hail footprint inside the Census boundary of University City, MO, not the entire region. The place had 35,065 residents in the 2020 Census. A boundary intersection does not mean the whole community was hit. Estimated housing exposure: 18,019 units in 1-inch-or-larger bands, including 16,393 in 1.5-inch-or-larger bands and 289 in 2-inch-or-larger bands.

Affected states: University City area, MO
2+ inRadar size estimate 35,065Population Affected 18,019Houses Affected HailHazards FreeAccount signup
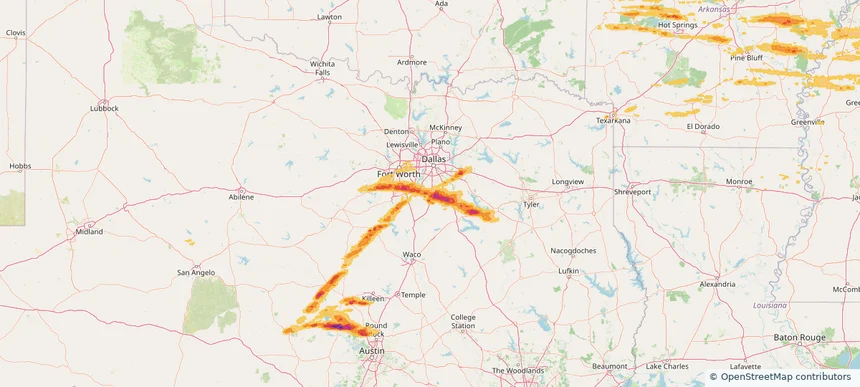
Waxahachie, TX — May 16, 2025 — regional hail footprint preview
Storm footprint preview

Local hail summary for the Waxahachie area: 38.86 square miles of estimated ground-hail footprint; highest mapped band 2.5+ inches. 0 official hail report(s) within the summary area. Exposure estimates are not confirmed property damage. Open the map to explore the full coverage included in your access. Statistics cover the mapped hail footprint inside the Census boundary of Waxahachie, TX, not the entire region. The place had 41,140 residents in the 2020 Census. A boundary intersection does not mean the whole community was hit. Estimated housing exposure: 10,919 units in 1-inch-or-larger bands, including 234 in 1.5-inch-or-larger bands and 0 in 2-inch-or-larger bands.

Affected states: Waxahachie area, TX
2.5+ inRadar size estimate 37,297Population Affected 14,316Houses Affected HailHazards FreeAccount signup
Page 95 of 99
‹ 1 94 95 96 99 ›

Frequently asked questions

Can I search hail maps by coverage area?

Yes. The storm library supports coverage-area filtering so you can find hail maps and hail swaths in a target service area.

What kinds of storms appear in the HailMapr library?

The library focuses on published hail events, including ready storm maps and live storms once hail has been detected and a public swath is available.

Are HailMapr storm pages useful for roofers and adjusters?

Yes. They are built to help roofers, adjusters, restoration teams, and property owners review storm footprints before purchase.