Storm library

Browse live and recent hail maps.

Review storm footprints, hail swaths, reports, and replay access. Create a free account to save your setup and move into map access when a storm matters.

Search filters
Clear
Newest storms first by default.
Don't see your storm? Request a qualifying storm map and we'll email you when it is ready.
Showing 2233-2256 of 2368 storms · Page 94 of 99
‹ 1 93 94 95 99 ›
Request a storm map

Tell us about the storm and we'll build the map. Once it's published you'll get an email and can purchase it from the library — just like any other event.

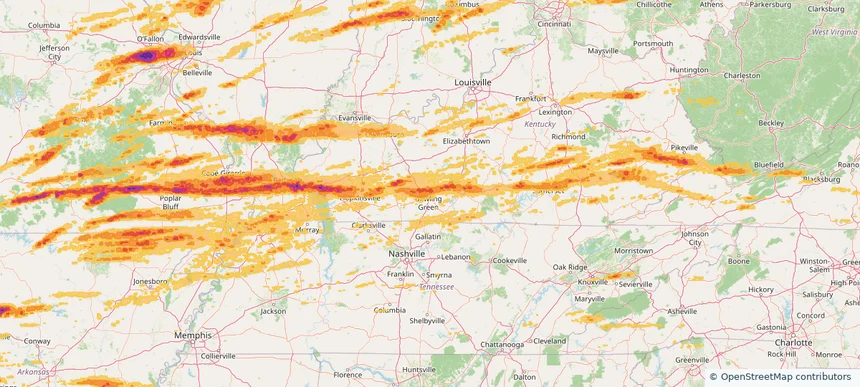
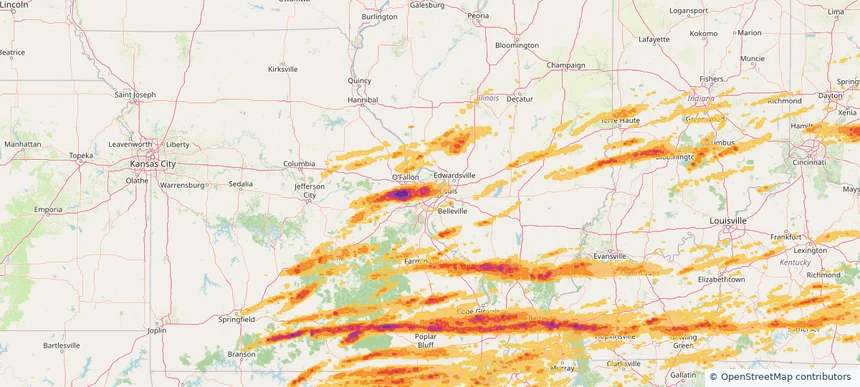
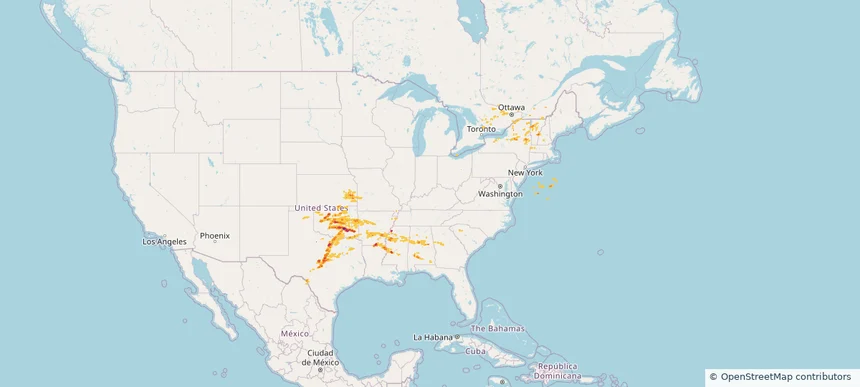
Historical Hail — 2025-05-17 — regional hail footprint preview
Storm footprint preview
May 17, 2025 7:00 AM to May 18, 2025 7:00 AM CST

Historical Hail — 2025-05-17

Hail as large as 2.75 inches was reported near Mustang, OKLAHOMA. Wind up to 104 mph was reported near Hitchcock, NEBRASKA. 94 tornadoes were reported, including one near Edwards, KANSAS. The storm had 40 official hail reports.

Affected states: National, AL, AR, GA, KS, LA, MA, MS, MO, NH, NY, OK, PA, TX, VT
3.5 inRadar size estimate 1,540,087Population Affected 673,708Houses Affected Hail · Wind · TornadoHazards FreeAccount signup
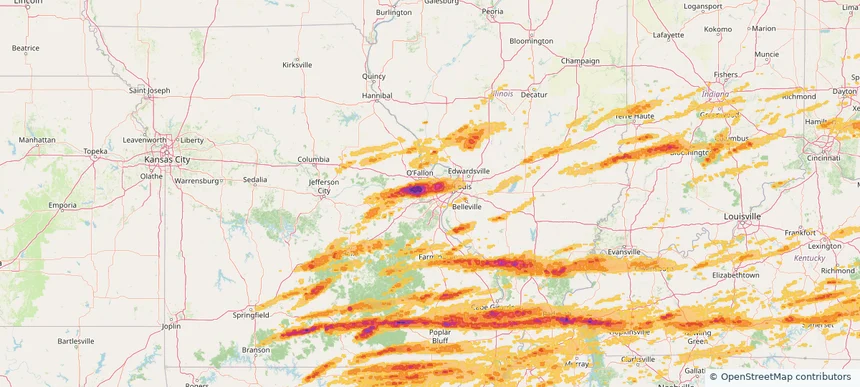
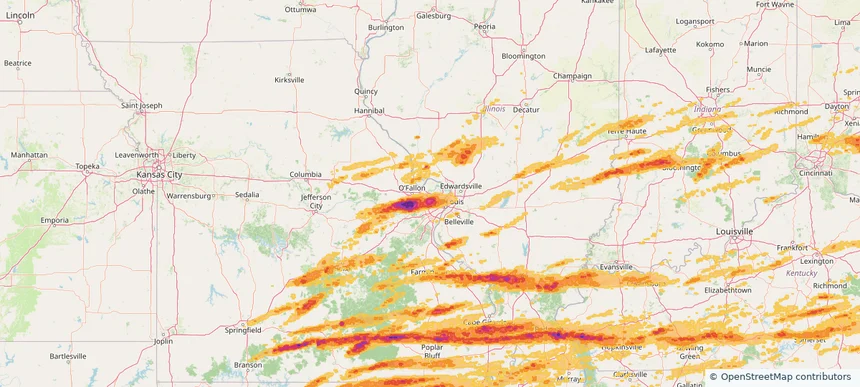
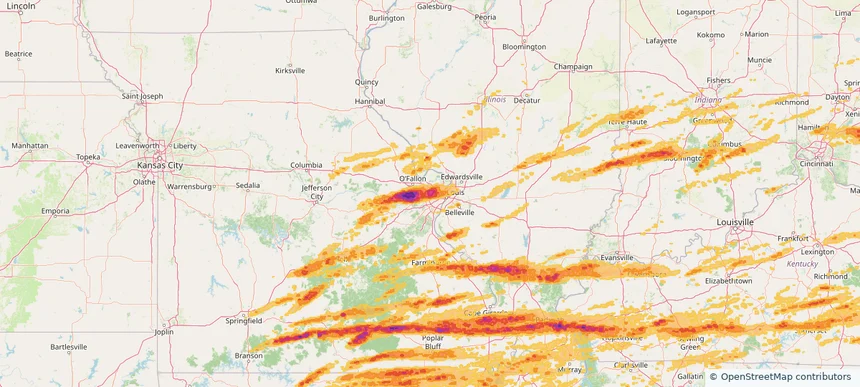
Ballwin, MO — May 16, 2025 — regional hail footprint preview
Storm footprint preview

Local hail summary for the Ballwin area: 6.08 square miles of estimated ground-hail footprint; highest mapped band 1.5+ inches. 0 official hail report(s) within the summary area. Exposure estimates are not confirmed property damage. Open the map to explore the full coverage included in your access. Statistics cover the mapped hail footprint inside the Census boundary of Ballwin, MO, not the entire region. The place had 31,103 residents in the 2020 Census. A boundary intersection does not mean the whole community was hit. Estimated housing exposure: 4,334 units in 1-inch-or-larger bands, including 607 in 1.5-inch-or-larger bands and 0 in 2-inch-or-larger bands.

Affected states: Ballwin area, MO
1.5+ inRadar size estimate 20,045Population Affected 8,318Houses Affected HailHazards FreeAccount signup
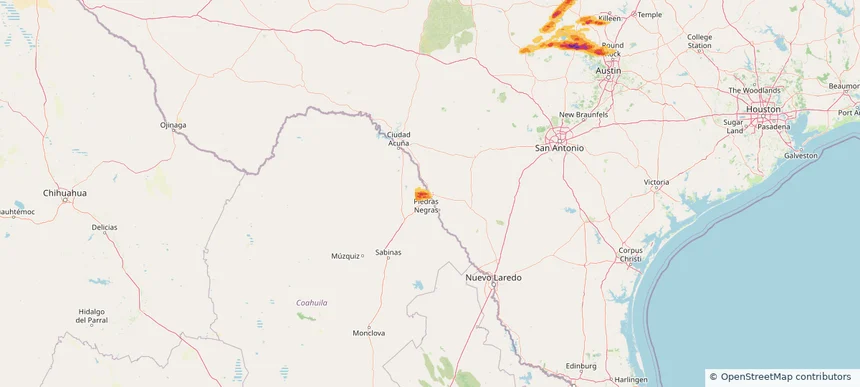
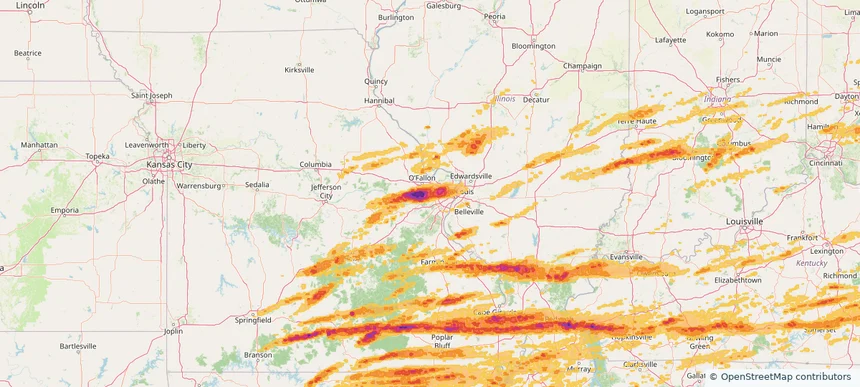
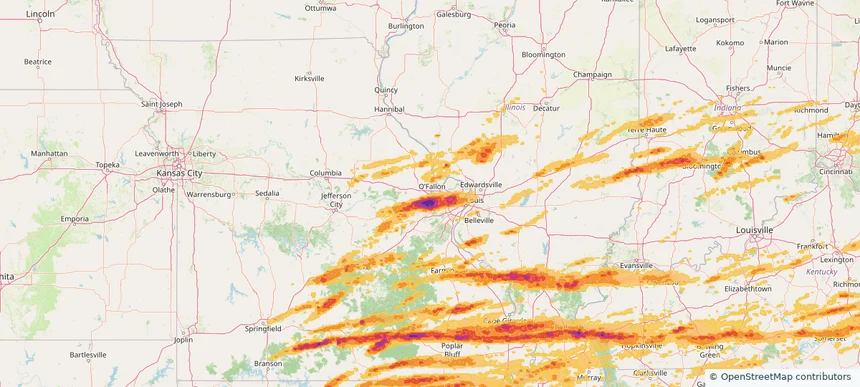
Belleville, IL — May 16, 2025 — regional hail footprint preview
Storm footprint preview

Local hail summary for the Belleville area: 3.32 square miles of estimated ground-hail footprint; highest mapped band 1+ inches. 0 official hail report(s) within the summary area. Exposure estimates are not confirmed property damage. Open the map to explore the full coverage included in your access. Statistics cover the mapped hail footprint inside the Census boundary of Belleville, IL, not the entire region. The place had 42,404 residents in the 2020 Census. A boundary intersection does not mean the whole community was hit. Estimated housing exposure: 3,369 units in 1-inch-or-larger bands, including 0 in 1.5-inch-or-larger bands and 0 in 2-inch-or-larger bands.

Affected states: Belleville area, IL
1+ inRadar size estimate 10,106Population Affected 5,378Houses Affected HailHazards FreeAccount signup
Bloomington, IN — May 16, 2025 — regional hail footprint preview
Storm footprint preview

Local hail summary for the Bloomington area: 18.62 square miles of estimated ground-hail footprint; highest mapped band 1+ inches. 0 official hail report(s) within the summary area. Exposure estimates are not confirmed property damage. Open the map to explore the full coverage included in your access. Statistics cover the mapped hail footprint inside the Census boundary of Bloomington, IN, not the entire region. The place had 79,168 residents in the 2020 Census. A boundary intersection does not mean the whole community was hit. Estimated housing exposure: 242 units in 1-inch-or-larger bands, including 0 in 1.5-inch-or-larger bands and 0 in 2-inch-or-larger bands.

Affected states: Bloomington area, IN
1+ inRadar size estimate 75,139Population Affected 34,498Houses Affected HailHazards FreeAccount signup
Bowling Green, KY — May 16, 2025 — regional hail footprint preview
Storm footprint preview

Local hail summary for the Bowling Green area: 30.48 square miles of estimated ground-hail footprint; highest mapped band 1.5+ inches. 2 official hail report(s) within the summary area. Exposure estimates are not confirmed property damage. Open the map to explore the full coverage included in your access. Statistics cover the mapped hail footprint inside the Census boundary of Bowling Green, KY, not the entire region. The place had 72,294 residents in the 2020 Census. A boundary intersection does not mean the whole community was hit. Estimated housing exposure: 11,559 units in 1-inch-or-larger bands, including 440 in 1.5-inch-or-larger bands and 0 in 2-inch-or-larger bands.

Affected states: Bowling Green area, KY
1.5+ inRadar size estimate 59,096Population Affected 25,656Houses Affected HailHazards FreeAccount signup
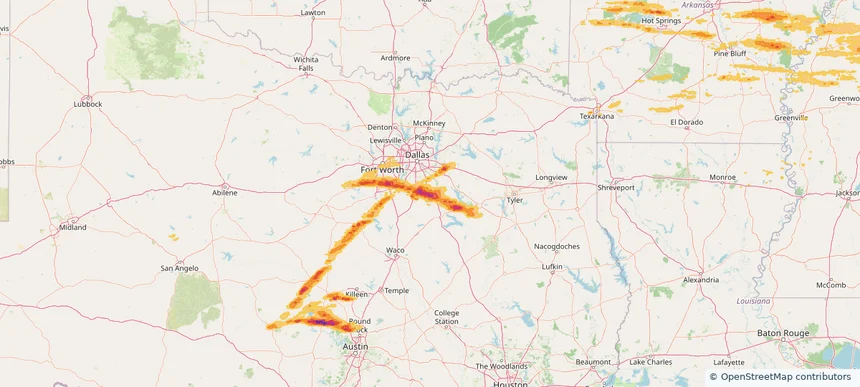
Bridgeton, MO — May 16, 2025 — regional hail footprint preview
Storm footprint preview

Local hail summary for the Bridgeton area: 5.23 square miles of estimated ground-hail footprint; highest mapped band 2+ inches. 0 official hail report(s) within the summary area. Exposure estimates are not confirmed property damage. Open the map to explore the full coverage included in your access. Statistics cover the mapped hail footprint inside the Census boundary of Bridgeton, MO, not the entire region. The place had 11,445 residents in the 2020 Census. A boundary intersection does not mean the whole community was hit. Estimated housing exposure: 2,548 units in 1-inch-or-larger bands, including 1,141 in 1.5-inch-or-larger bands and 49 in 2-inch-or-larger bands.

Affected states: Bridgeton area, MO
2+ inRadar size estimate 9,908Population Affected 4,192Houses Affected HailHazards FreeAccount signup
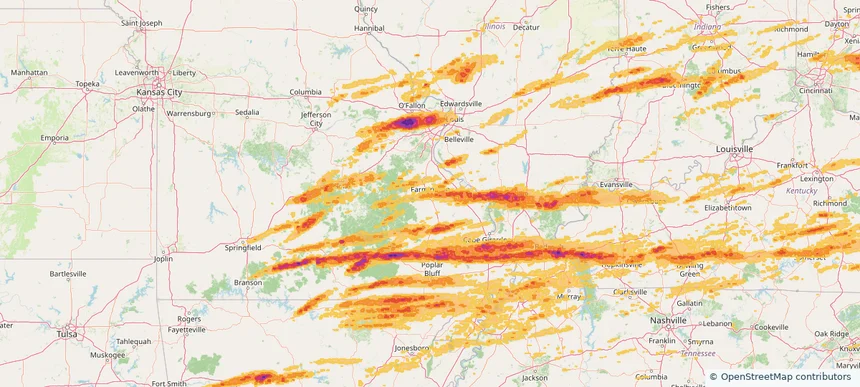
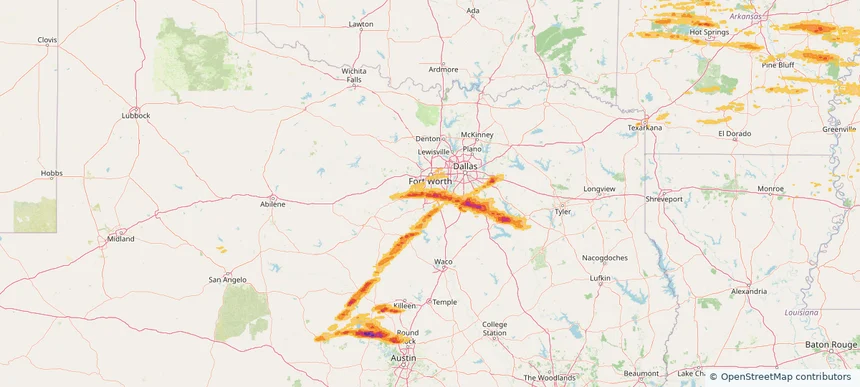
Burleson, TX — May 16, 2025 — regional hail footprint preview
Storm footprint preview

Local hail summary for the Burleson area: 16.90 square miles of estimated ground-hail footprint; highest mapped band 1.5+ inches. 0 official hail report(s) within the summary area. Exposure estimates are not confirmed property damage. Open the map to explore the full coverage included in your access. Statistics cover the mapped hail footprint inside the Census boundary of Burleson, TX, not the entire region. The place had 47,641 residents in the 2020 Census. A boundary intersection does not mean the whole community was hit. Estimated housing exposure: 5,113 units in 1-inch-or-larger bands, including 306 in 1.5-inch-or-larger bands and 0 in 2-inch-or-larger bands.

Affected states: Burleson area, TX
1.5+ inRadar size estimate 15,731Population Affected 5,441Houses Affected HailHazards FreeAccount signup
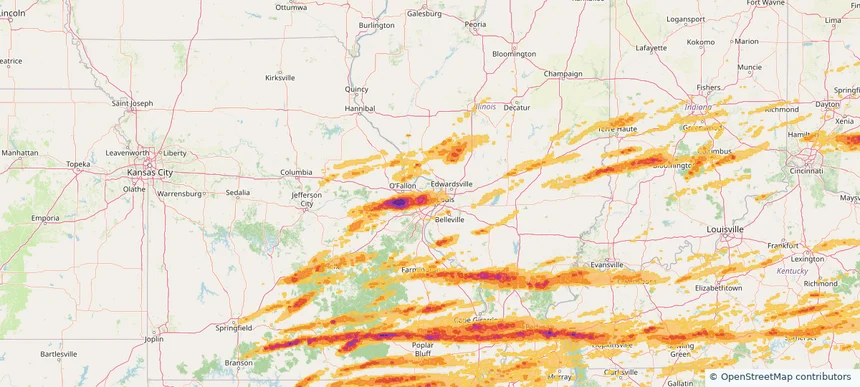
Carbondale, IL — May 16, 2025 — regional hail footprint preview
Storm footprint preview

Local hail summary for the Carbondale area: 17.83 square miles of estimated ground-hail footprint; highest mapped band 2.5+ inches. 0 official hail report(s) within the summary area. Exposure estimates are not confirmed property damage. Open the map to explore the full coverage included in your access. Statistics cover the mapped hail footprint inside the Census boundary of Carbondale, IL, not the entire region. The place had 21,857 residents in the 2020 Census. A boundary intersection does not mean the whole community was hit. Estimated housing exposure: 12,011 units in 1-inch-or-larger bands, including 9,143 in 1.5-inch-or-larger bands and 1,755 in 2-inch-or-larger bands.

Affected states: Carbondale area, IL
2.5+ inRadar size estimate 21,818Population Affected 12,306Houses Affected HailHazards FreeAccount signup
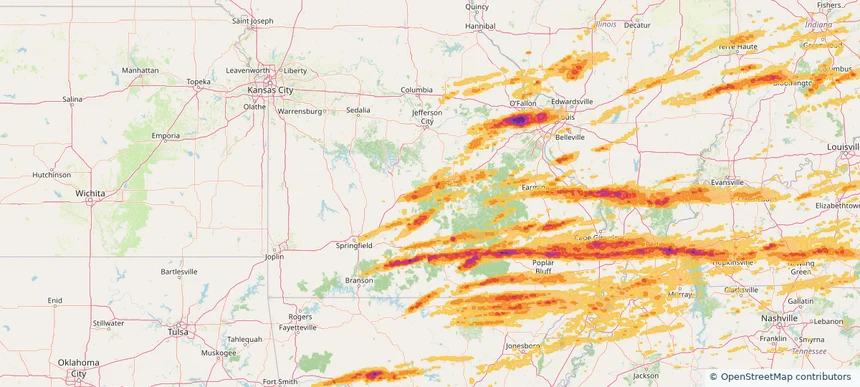
Chesterfield, MO — May 16, 2025 — regional hail footprint preview
Storm footprint preview

Local hail summary for the Chesterfield area: 33.66 square miles of estimated ground-hail footprint; highest mapped band 2.5+ inches. 3 official hail report(s) within the summary area. Exposure estimates are not confirmed property damage. Open the map to explore the full coverage included in your access. Statistics cover the mapped hail footprint inside the Census boundary of Chesterfield, MO, not the entire region. The place had 49,999 residents in the 2020 Census. A boundary intersection does not mean the whole community was hit. Estimated housing exposure: 21,322 units in 1-inch-or-larger bands, including 20,849 in 1.5-inch-or-larger bands and 1,254 in 2-inch-or-larger bands.

Affected states: Chesterfield area, MO
2.5+ inRadar size estimate 50,047Population Affected 21,322Houses Affected HailHazards FreeAccount signup
Clayton, MO — May 16, 2025 — regional hail footprint preview
Storm footprint preview

Local hail summary for the Clayton area: 2.51 square miles of estimated ground-hail footprint; highest mapped band 1.5+ inches. 0 official hail report(s) within the summary area. Exposure estimates are not confirmed property damage. Open the map to explore the full coverage included in your access. Statistics cover the mapped hail footprint inside the Census boundary of Clayton, MO, not the entire region. The place had 17,355 residents in the 2020 Census. A boundary intersection does not mean the whole community was hit. Estimated housing exposure: 6,926 units in 1-inch-or-larger bands, including 5,719 in 1.5-inch-or-larger bands and 0 in 2-inch-or-larger bands.

Affected states: Clayton area, MO
1.5+ inRadar size estimate 17,355Population Affected 6,926Houses Affected HailHazards FreeAccount signup
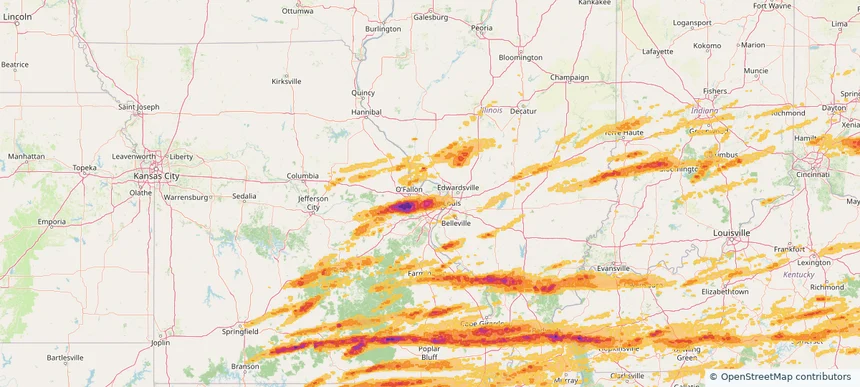
Columbus, IN — May 16, 2025 — regional hail footprint preview
Storm footprint preview

Local hail summary for the Columbus area: 10.78 square miles of estimated ground-hail footprint; highest mapped band 1+ inches. 1 official hail report(s) within the summary area. Exposure estimates are not confirmed property damage. Open the map to explore the full coverage included in your access. Statistics cover the mapped hail footprint inside the Census boundary of Columbus, IN, not the entire region. The place had 50,474 residents in the 2020 Census. A boundary intersection does not mean the whole community was hit. Estimated housing exposure: 1,469 units in 1-inch-or-larger bands, including 0 in 1.5-inch-or-larger bands and 0 in 2-inch-or-larger bands.

Affected states: Columbus area, IN
1+ inRadar size estimate 22,339Population Affected 10,543Houses Affected HailHazards FreeAccount signup
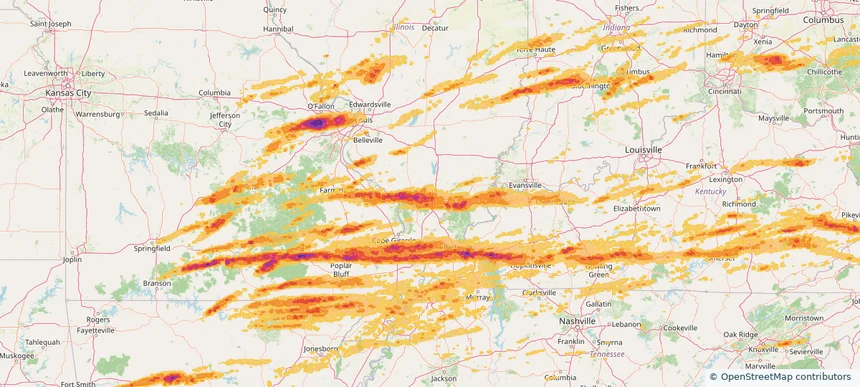
Creve Coeur, MO — May 16, 2025 — regional hail footprint preview
Storm footprint preview

Local hail summary for the Creve Coeur area: 10.28 square miles of estimated ground-hail footprint; highest mapped band 2+ inches. 0 official hail report(s) within the summary area. Exposure estimates are not confirmed property damage. Open the map to explore the full coverage included in your access. Statistics cover the mapped hail footprint inside the Census boundary of Creve Coeur, MO, not the entire region. The place had 18,834 residents in the 2020 Census. A boundary intersection does not mean the whole community was hit. Estimated housing exposure: 9,061 units in 1-inch-or-larger bands, including 9,061 in 1.5-inch-or-larger bands and 5,219 in 2-inch-or-larger bands.

Affected states: Creve Coeur area, MO
2+ inRadar size estimate 19,004Population Affected 9,061Houses Affected HailHazards FreeAccount signup
Dardenne Prairie, MO — May 16, 2025 — regional hail footprint preview
Storm footprint preview

Local hail summary for the Dardenne Prairie area: 1.45 square miles of estimated ground-hail footprint; highest mapped band 1.5+ inches. 0 official hail report(s) within the summary area. Exposure estimates are not confirmed property damage. Open the map to explore the full coverage included in your access. Statistics cover the mapped hail footprint inside the Census boundary of Dardenne Prairie, MO, not the entire region. The place had 12,743 residents in the 2020 Census. A boundary intersection does not mean the whole community was hit. Estimated housing exposure: 1,106 units in 1-inch-or-larger bands, including 0 in 1.5-inch-or-larger bands and 0 in 2-inch-or-larger bands.

Affected states: Dardenne Prairie area, MO
1.5+ inRadar size estimate 3,326Population Affected 1,106Houses Affected HailHazards FreeAccount signup
Eagle Pass, TX — May 16, 2025 — regional hail footprint preview
Storm footprint preview

Local hail summary for the Eagle Pass area: 1.47 square miles of estimated ground-hail footprint; highest mapped band 1+ inches. 0 official hail report(s) within the summary area. Exposure estimates are not confirmed property damage. Open the map to explore the full coverage included in your access. Statistics cover the mapped hail footprint inside the Census boundary of Eagle Pass, TX, not the entire region. The place had 28,130 residents in the 2020 Census. A boundary intersection does not mean the whole community was hit. Estimated housing exposure: 1,013 units in 1-inch-or-larger bands, including 0 in 1.5-inch-or-larger bands and 0 in 2-inch-or-larger bands.

Affected states: Eagle Pass area, TX
1+ inRadar size estimate 2,685Population Affected 1,105Houses Affected HailHazards FreeAccount signup
Easton, MD — May 16, 2025 — regional hail footprint preview
Storm footprint preview

Local hail summary for the Easton area: 9.24 square miles of estimated ground-hail footprint; highest mapped band 1.5+ inches. 0 official hail report(s) within the summary area. Exposure estimates are not confirmed property damage. Open the map to explore the full coverage included in your access. Statistics cover the mapped hail footprint inside the Census boundary of Easton, MD, not the entire region. The place had 17,101 residents in the 2020 Census. A boundary intersection does not mean the whole community was hit. Estimated housing exposure: 7,380 units in 1-inch-or-larger bands, including 6,175 in 1.5-inch-or-larger bands and 0 in 2-inch-or-larger bands.

Affected states: Easton area, MD
1.5+ inRadar size estimate 16,403Population Affected 7,552Houses Affected HailHazards FreeAccount signup
Effingham, IL — May 16, 2025 — regional hail footprint preview
Storm footprint preview

Local hail summary for the Effingham area: 9.70 square miles of estimated ground-hail footprint; highest mapped band 1+ inches. 0 official hail report(s) within the summary area. Exposure estimates are not confirmed property damage. Open the map to explore the full coverage included in your access. Statistics cover the mapped hail footprint inside the Census boundary of Effingham, IL, not the entire region. The place had 12,252 residents in the 2020 Census. A boundary intersection does not mean the whole community was hit. Estimated housing exposure: 512 units in 1-inch-or-larger bands, including 0 in 1.5-inch-or-larger bands and 0 in 2-inch-or-larger bands.

Affected states: Effingham area, IL
1+ inRadar size estimate 11,417Population Affected 5,475Houses Affected HailHazards FreeAccount signup
Ennis, TX — May 16, 2025 — regional hail footprint preview
Storm footprint preview

Local hail summary for the Ennis area: 29.02 square miles of estimated ground-hail footprint; highest mapped band 2.5+ inches. 0 official hail report(s) within the summary area. Exposure estimates are not confirmed property damage. Open the map to explore the full coverage included in your access. Statistics cover the mapped hail footprint inside the Census boundary of Ennis, TX, not the entire region. The place had 20,159 residents in the 2020 Census. A boundary intersection does not mean the whole community was hit. Estimated housing exposure: 7,269 units in 1-inch-or-larger bands, including 6,371 in 1.5-inch-or-larger bands and 4,502 in 2-inch-or-larger bands.

Affected states: Ennis area, TX
2.5+ inRadar size estimate 20,084Population Affected 7,274Houses Affected HailHazards FreeAccount signup
Farmington, MO — May 16, 2025 — regional hail footprint preview
Storm footprint preview

Local hail summary for the Farmington area: 8.99 square miles of estimated ground-hail footprint; highest mapped band 1+ inches. 1 official hail report(s) within the summary area. Exposure estimates are not confirmed property damage. Open the map to explore the full coverage included in your access. Statistics cover the mapped hail footprint inside the Census boundary of Farmington, MO, not the entire region. The place had 18,217 residents in the 2020 Census. A boundary intersection does not mean the whole community was hit. Estimated housing exposure: 6,069 units in 1-inch-or-larger bands, including 0 in 1.5-inch-or-larger bands and 0 in 2-inch-or-larger bands.

Affected states: Farmington area, MO
1+ inRadar size estimate 17,917Population Affected 6,843Houses Affected HailHazards FreeAccount signup
Ferguson, MO — May 16, 2025 — regional hail footprint preview
Storm footprint preview

Local hail summary for the Ferguson area: 6.18 square miles of estimated ground-hail footprint; highest mapped band 1.5+ inches. 0 official hail report(s) within the summary area. Exposure estimates are not confirmed property damage. Open the map to explore the full coverage included in your access. Statistics cover the mapped hail footprint inside the Census boundary of Ferguson, MO, not the entire region. The place had 18,527 residents in the 2020 Census. A boundary intersection does not mean the whole community was hit. Estimated housing exposure: 6,728 units in 1-inch-or-larger bands, including 1,517 in 1.5-inch-or-larger bands and 0 in 2-inch-or-larger bands.

Affected states: Ferguson area, MO
1.5+ inRadar size estimate 18,495Population Affected 8,844Houses Affected HailHazards FreeAccount signup
Fort Leonard Wood, MO — May 16, 2025 — regional hail footprint preview
Storm footprint preview

Local hail summary for the Fort Leonard Wood area: 7.14 square miles of estimated ground-hail footprint; highest mapped band 1+ inches. 0 official hail report(s) within the summary area. Exposure estimates are not confirmed property damage. Open the map to explore the full coverage included in your access. Statistics cover the mapped hail footprint inside the Census boundary of Fort Leonard Wood, MO, not the entire region. The place had 15,959 residents in the 2020 Census. A boundary intersection does not mean the whole community was hit. Estimated housing exposure: 381 units in 1-inch-or-larger bands, including 0 in 1.5-inch-or-larger bands and 0 in 2-inch-or-larger bands.

Affected states: Fort Leonard Wood area, MO
1+ inRadar size estimate 3,917Population Affected 1,412Houses Affected HailHazards FreeAccount signup
Granite City, IL — May 16, 2025 — regional hail footprint preview
Storm footprint preview

Local hail summary for the Granite City area: 16.98 square miles of estimated ground-hail footprint; highest mapped band 1+ inches. 1 official hail report(s) within the summary area. Exposure estimates are not confirmed property damage. Open the map to explore the full coverage included in your access. Statistics cover the mapped hail footprint inside the Census boundary of Granite City, IL, not the entire region. The place had 27,549 residents in the 2020 Census. A boundary intersection does not mean the whole community was hit. Estimated housing exposure: 142 units in 1-inch-or-larger bands, including 0 in 1.5-inch-or-larger bands and 0 in 2-inch-or-larger bands.

Affected states: Granite City area, IL
1+ inRadar size estimate 27,694Population Affected 13,194Houses Affected HailHazards FreeAccount signup
Hazelwood, MO — May 16, 2025 — regional hail footprint preview
Storm footprint preview

Local hail summary for the Hazelwood area: 1.56 square miles of estimated ground-hail footprint; highest mapped band 1+ inches. 0 official hail report(s) within the summary area. Exposure estimates are not confirmed property damage. Open the map to explore the full coverage included in your access. Statistics cover the mapped hail footprint inside the Census boundary of Hazelwood, MO, not the entire region. The place had 25,458 residents in the 2020 Census. A boundary intersection does not mean the whole community was hit. Estimated housing exposure: 357 units in 1-inch-or-larger bands, including 0 in 1.5-inch-or-larger bands and 0 in 2-inch-or-larger bands.

Affected states: Hazelwood area, MO
1+ inRadar size estimate 4,512Population Affected 2,059Houses Affected HailHazards FreeAccount signup
Herrin, IL — May 16, 2025 — regional hail footprint preview
Storm footprint preview

Local hail summary for the Herrin area: 9.84 square miles of estimated ground-hail footprint; highest mapped band 1.5+ inches. 0 official hail report(s) within the summary area. Exposure estimates are not confirmed property damage. Open the map to explore the full coverage included in your access. Statistics cover the mapped hail footprint inside the Census boundary of Herrin, IL, not the entire region. The place had 12,352 residents in the 2020 Census. A boundary intersection does not mean the whole community was hit. Estimated housing exposure: 5,258 units in 1-inch-or-larger bands, including 447 in 1.5-inch-or-larger bands and 0 in 2-inch-or-larger bands.

Affected states: Herrin area, IL
1.5+ inRadar size estimate 12,295Population Affected 6,037Houses Affected HailHazards FreeAccount signup
Hot Springs Village, AR — May 16, 2025 — regional hail footprint preview
Storm footprint preview

Local hail summary for the Hot Springs Village area: 6.22 square miles of estimated ground-hail footprint; highest mapped band 1.5+ inches. 0 official hail report(s) within the summary area. Exposure estimates are not confirmed property damage. Open the map to explore the full coverage included in your access. Statistics cover the mapped hail footprint inside the Census boundary of Hot Springs Village, AR, not the entire region. The place had 15,861 residents in the 2020 Census. A boundary intersection does not mean the whole community was hit. Estimated housing exposure: 1,145 units in 1-inch-or-larger bands, including 49 in 1.5-inch-or-larger bands and 0 in 2-inch-or-larger bands.

Affected states: Hot Springs Village area, AR
1.5+ inRadar size estimate 2,846Population Affected 1,827Houses Affected HailHazards FreeAccount signup
Page 94 of 99
‹ 1 93 94 95 99 ›

Frequently asked questions

Can I search hail maps by coverage area?

Yes. The storm library supports coverage-area filtering so you can find hail maps and hail swaths in a target service area.

What kinds of storms appear in the HailMapr library?

The library focuses on published hail events, including ready storm maps and live storms once hail has been detected and a public swath is available.

Are HailMapr storm pages useful for roofers and adjusters?

Yes. They are built to help roofers, adjusters, restoration teams, and property owners review storm footprints before purchase.