
Storm library

Browse live and recent hail maps.

Review storm footprints, hail swaths, reports, and replay access. Create a free account to save your setup and move into map access when a storm matters.

Search filters
Clear
Newest storms first by default.
Don't see your storm? Request a qualifying storm map and we'll email you when it is ready.
Showing 2209-2232 of 2368 storms · Page 93 of 99
‹ 1 92 93 94 99 ›
Request a storm map

Tell us about the storm and we'll build the map. Once it's published you'll get an email and can purchase it from the library — just like any other event.

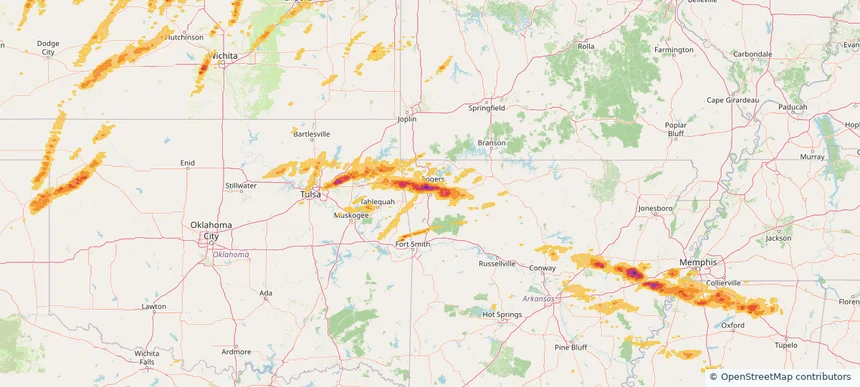
Fayetteville, AR — May 18, 2025 — regional hail footprint preview
Storm footprint preview

Local hail summary for the Fayetteville area: 12.55 square miles of estimated ground-hail footprint; highest mapped band 2+ inches. 0 official hail report(s) within the summary area. Exposure estimates are not confirmed property damage. Open the map to explore the full coverage included in your access. Statistics cover the mapped hail footprint inside the Census boundary of Fayetteville, AR, not the entire region. The place had 93,949 residents in the 2020 Census. A boundary intersection does not mean the whole community was hit. Estimated housing exposure: 8,500 units in 1-inch-or-larger bands, including 4,069 in 1.5-inch-or-larger bands and 988 in 2-inch-or-larger bands.

Affected states: Fayetteville area, AR
2+ inRadar size estimate 20,463Population Affected 10,004Houses Affected HailHazards FreeAccount signup
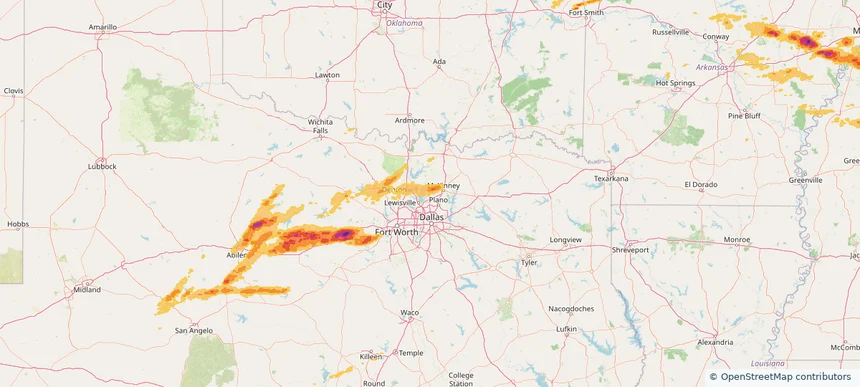
Frisco, TX — May 18, 2025 — regional hail footprint preview
Storm footprint preview

Local hail summary for the Frisco area: 11.89 square miles of estimated ground-hail footprint; highest mapped band 1.5+ inches. 0 official hail report(s) within the summary area. Exposure estimates are not confirmed property damage. Open the map to explore the full coverage included in your access. Statistics cover the mapped hail footprint inside the Census boundary of Frisco, TX, not the entire region. The place had 200,509 residents in the 2020 Census. A boundary intersection does not mean the whole community was hit. Estimated housing exposure: 2,436 units in 1-inch-or-larger bands, including 7 in 1.5-inch-or-larger bands and 0 in 2-inch-or-larger bands.

Affected states: Frisco area, TX
1.5+ inRadar size estimate 18,617Population Affected 6,085Houses Affected HailHazards FreeAccount signup
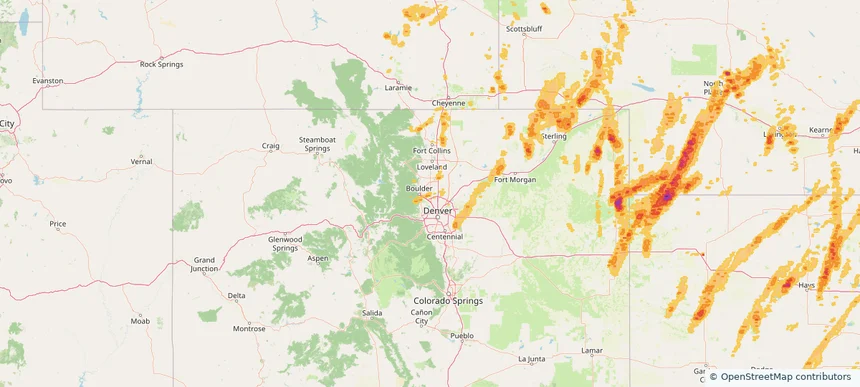
Lafayette, CO — May 18, 2025 — regional hail footprint preview
Storm footprint preview

Local hail summary for the Lafayette area: 4.71 square miles of estimated ground-hail footprint; highest mapped band 1+ inches. 0 official hail report(s) within the summary area. Exposure estimates are not confirmed property damage. Open the map to explore the full coverage included in your access. Statistics cover the mapped hail footprint inside the Census boundary of Lafayette, CO, not the entire region. The place had 30,411 residents in the 2020 Census. A boundary intersection does not mean the whole community was hit. Estimated housing exposure: 1,535 units in 1-inch-or-larger bands, including 0 in 1.5-inch-or-larger bands and 0 in 2-inch-or-larger bands.

Affected states: Lafayette area, CO
1+ inRadar size estimate 15,580Population Affected 6,213Houses Affected HailHazards FreeAccount signup
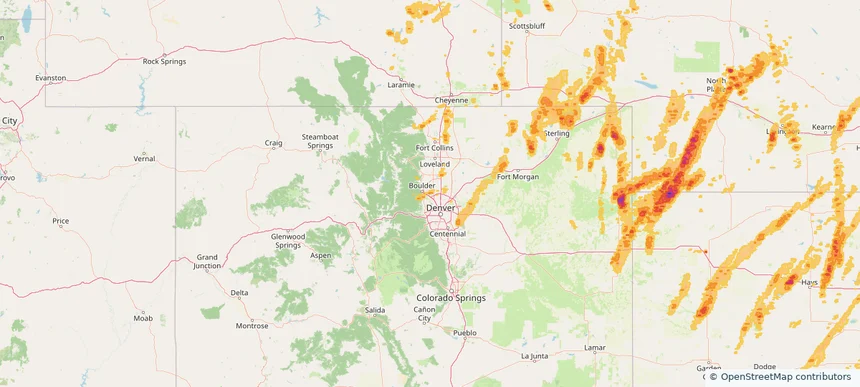
Louisville, CO — May 18, 2025 — regional hail footprint preview
Storm footprint preview

Local hail summary for the Louisville area: 2.63 square miles of estimated ground-hail footprint; highest mapped band 1+ inches. 0 official hail report(s) within the summary area. Exposure estimates are not confirmed property damage. Open the map to explore the full coverage included in your access. Statistics cover the mapped hail footprint inside the Census boundary of Louisville, CO, not the entire region. The place had 21,226 residents in the 2020 Census. A boundary intersection does not mean the whole community was hit. Estimated housing exposure: 4,351 units in 1-inch-or-larger bands, including 0 in 1.5-inch-or-larger bands and 0 in 2-inch-or-larger bands.

Affected states: Louisville area, CO
1+ inRadar size estimate 11,369Population Affected 4,872Houses Affected HailHazards FreeAccount signup
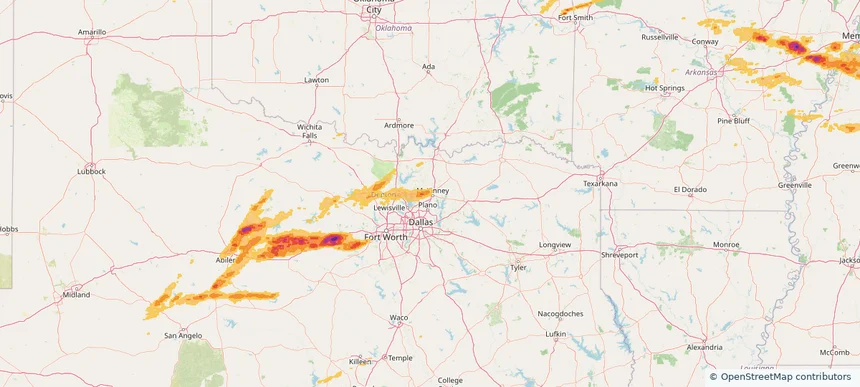
McKinney, TX — May 18, 2025 — regional hail footprint preview
Storm footprint preview

Local hail summary for the McKinney area: 15.57 square miles of estimated ground-hail footprint; highest mapped band 1.5+ inches. 0 official hail report(s) within the summary area. Exposure estimates are not confirmed property damage. Open the map to explore the full coverage included in your access. Statistics cover the mapped hail footprint inside the Census boundary of McKinney, TX, not the entire region. The place had 195,308 residents in the 2020 Census. A boundary intersection does not mean the whole community was hit. Estimated housing exposure: 6,607 units in 1-inch-or-larger bands, including 570 in 1.5-inch-or-larger bands and 0 in 2-inch-or-larger bands.

Affected states: McKinney area, TX
1.5+ inRadar size estimate 48,176Population Affected 16,351Houses Affected HailHazards FreeAccount signup
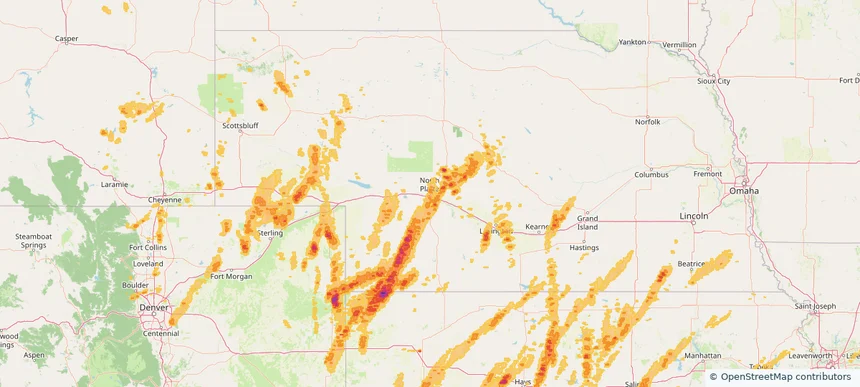
North Platte, NE — May 18, 2025 — regional hail footprint preview
Storm footprint preview

Local hail summary for the North Platte area: 12.02 square miles of estimated ground-hail footprint; highest mapped band 1+ inches. 1 official hail report(s) within the summary area. Exposure estimates are not confirmed property damage. Open the map to explore the full coverage included in your access. Statistics cover the mapped hail footprint inside the Census boundary of North Platte, NE, not the entire region. The place had 23,390 residents in the 2020 Census. A boundary intersection does not mean the whole community was hit. Estimated housing exposure: 890 units in 1-inch-or-larger bands, including 0 in 1.5-inch-or-larger bands and 0 in 2-inch-or-larger bands.

Affected states: North Platte area, NE
1+ inRadar size estimate 20,335Population Affected 9,826Houses Affected HailHazards FreeAccount signup
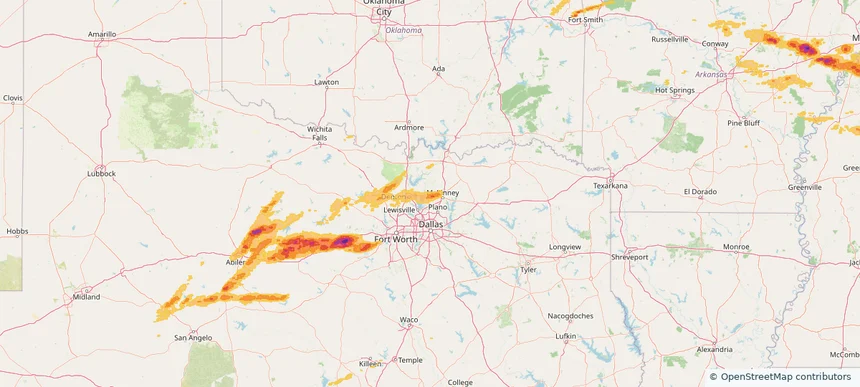
Prosper, TX — May 18, 2025 — regional hail footprint preview
Storm footprint preview

Local hail summary for the Prosper area: 16.76 square miles of estimated ground-hail footprint; highest mapped band 1.5+ inches. 0 official hail report(s) within the summary area. Exposure estimates are not confirmed property damage. Open the map to explore the full coverage included in your access. Statistics cover the mapped hail footprint inside the Census boundary of Prosper, TX, not the entire region. The place had 30,174 residents in the 2020 Census. A boundary intersection does not mean the whole community was hit. Estimated housing exposure: 4,146 units in 1-inch-or-larger bands, including 625 in 1.5-inch-or-larger bands and 0 in 2-inch-or-larger bands.

Affected states: Prosper area, TX
1.5+ inRadar size estimate 21,870Population Affected 7,009Houses Affected HailHazards FreeAccount signup
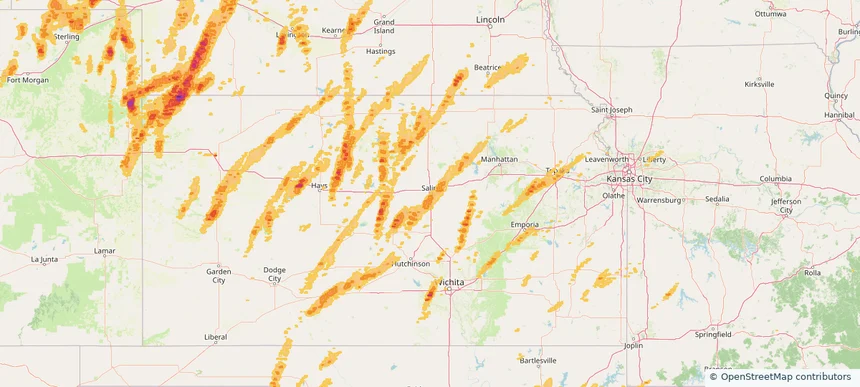
Salina, KS — May 18, 2025 — regional hail footprint preview
Storm footprint preview

Local hail summary for the Salina area: 23.11 square miles of estimated ground-hail footprint; highest mapped band 1+ inches. 1 official hail report(s) within the summary area. Exposure estimates are not confirmed property damage. Open the map to explore the full coverage included in your access. Statistics cover the mapped hail footprint inside the Census boundary of Salina, KS, not the entire region. The place had 46,889 residents in the 2020 Census. A boundary intersection does not mean the whole community was hit. Estimated housing exposure: 10,296 units in 1-inch-or-larger bands, including 0 in 1.5-inch-or-larger bands and 0 in 2-inch-or-larger bands.

Affected states: Salina area, KS
1+ inRadar size estimate 45,681Population Affected 20,222Houses Affected HailHazards FreeAccount signup
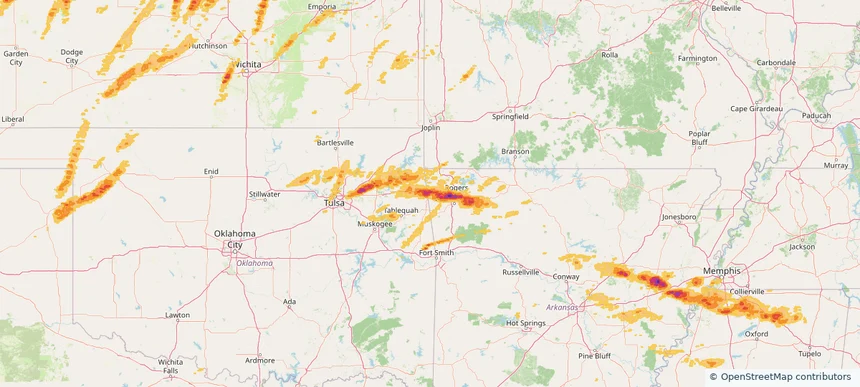
Siloam Springs, AR — May 18, 2025 — regional hail footprint preview
Storm footprint preview

Local hail summary for the Siloam Springs area: 11.55 square miles of estimated ground-hail footprint; highest mapped band 2+ inches. 0 official hail report(s) within the summary area. Exposure estimates are not confirmed property damage. Open the map to explore the full coverage included in your access. Statistics cover the mapped hail footprint inside the Census boundary of Siloam Springs, AR, not the entire region. The place had 17,287 residents in the 2020 Census. A boundary intersection does not mean the whole community was hit. Estimated housing exposure: 6,321 units in 1-inch-or-larger bands, including 5,571 in 1.5-inch-or-larger bands and 904 in 2-inch-or-larger bands.

Affected states: Siloam Springs area, AR
2+ inRadar size estimate 17,153Population Affected 6,345Houses Affected HailHazards FreeAccount signup
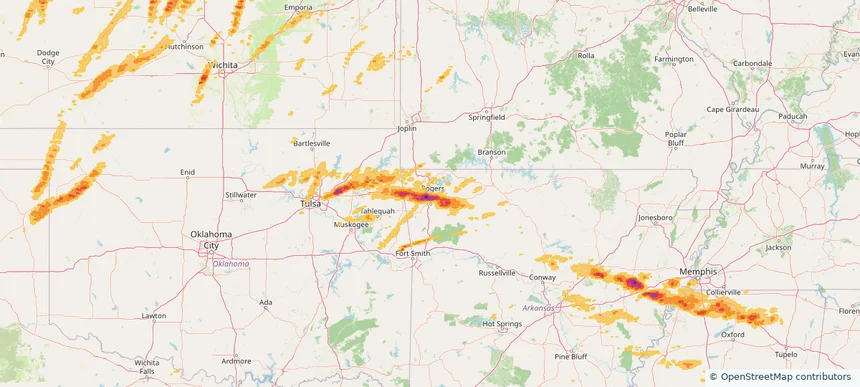
Springdale, AR — May 18, 2025 — regional hail footprint preview
Storm footprint preview

Local hail summary for the Springdale area: 33.42 square miles of estimated ground-hail footprint; highest mapped band 2.5+ inches. 0 official hail report(s) within the summary area. Exposure estimates are not confirmed property damage. Open the map to explore the full coverage included in your access. Statistics cover the mapped hail footprint inside the Census boundary of Springdale, AR, not the entire region. The place had 84,161 residents in the 2020 Census. A boundary intersection does not mean the whole community was hit. Estimated housing exposure: 18,965 units in 1-inch-or-larger bands, including 13,085 in 1.5-inch-or-larger bands and 7,368 in 2-inch-or-larger bands.

Affected states: Springdale area, AR
2.5+ inRadar size estimate 69,518Population Affected 23,885Houses Affected HailHazards FreeAccount signup
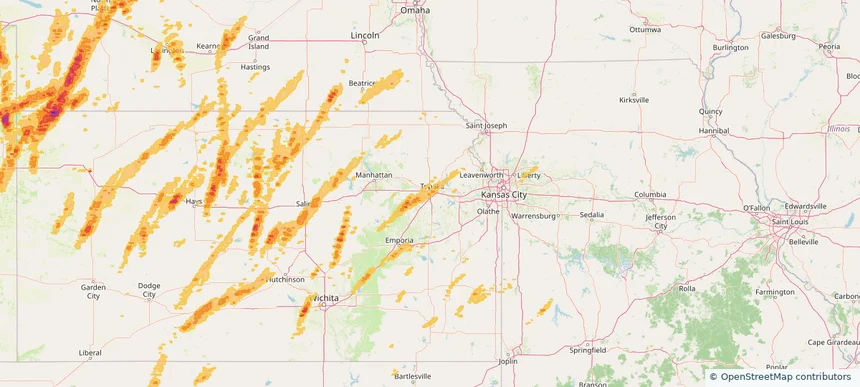
Topeka, KS — May 18, 2025 — regional hail footprint preview
Storm footprint preview

Local hail summary for the Topeka area: 11.27 square miles of estimated ground-hail footprint; highest mapped band 1+ inches. 0 official hail report(s) within the summary area. Exposure estimates are not confirmed property damage. Open the map to explore the full coverage included in your access. Statistics cover the mapped hail footprint inside the Census boundary of Topeka, KS, not the entire region. The place had 126,587 residents in the 2020 Census. A boundary intersection does not mean the whole community was hit. Estimated housing exposure: 2,437 units in 1-inch-or-larger bands, including 0 in 1.5-inch-or-larger bands and 0 in 2-inch-or-larger bands.

Affected states: Topeka area, KS
1+ inRadar size estimate 27,750Population Affected 13,335Houses Affected HailHazards FreeAccount signup
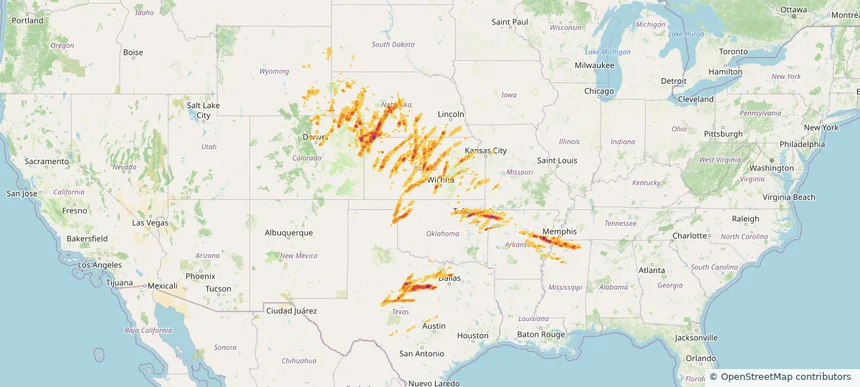
Historical Hail — 2025-05-18 — regional hail footprint preview
Storm footprint preview
May 18, 2025 7:00 AM to May 19, 2025 7:00 AM CST

Historical Hail — 2025-05-18

Hail as large as 4.50 inches was reported near Arnett, OKLAHOMA. Wind up to 120 mph was reported near Ne, NE. 178 tornadoes were reported, including one near Edwards, KANSAS. The storm had 53 official hail reports.

Affected states: National, AR, CO, KS, MS, MO, NE, OK, TN, TX, WY
3.49 inRadar size estimate 1,506,022Population Affected 607,793Houses Affected Hail · Wind · TornadoHazards FreeAccount signup
Ada, OK — May 17, 2025 — regional hail footprint preview
Storm footprint preview

Local hail summary for the Ada area: 15.65 square miles of estimated ground-hail footprint; highest mapped band 2+ inches. 0 official hail report(s) within the summary area. Exposure estimates are not confirmed property damage. Open the map to explore the full coverage included in your access. Statistics cover the mapped hail footprint inside the Census boundary of Ada, OK, not the entire region. The place had 16,481 residents in the 2020 Census. A boundary intersection does not mean the whole community was hit. Estimated housing exposure: 6,770 units in 1-inch-or-larger bands, including 1,699 in 1.5-inch-or-larger bands and 0 in 2-inch-or-larger bands.

Affected states: Ada area, OK
2+ inRadar size estimate 15,841Population Affected 7,895Houses Affected HailHazards FreeAccount signup
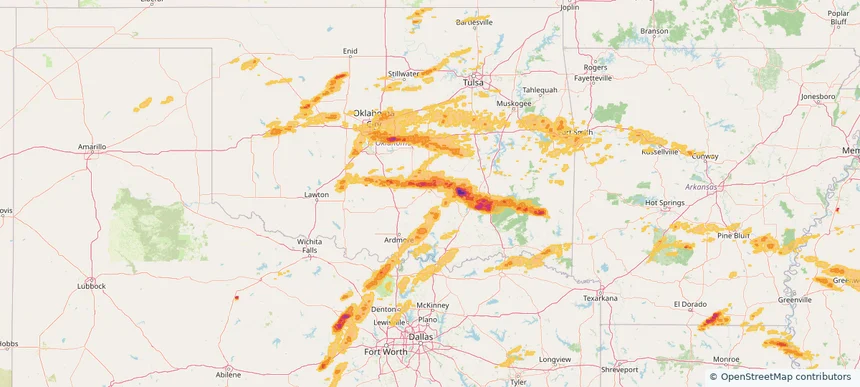
Byram, MS — May 17, 2025 — regional hail footprint preview
Storm footprint preview

Local hail summary for the Byram area: 0.82 square miles of estimated ground-hail footprint; highest mapped band 1.5+ inches. 0 official hail report(s) within the summary area. Exposure estimates are not confirmed property damage. Open the map to explore the full coverage included in your access. Statistics cover the mapped hail footprint inside the Census boundary of Byram, MS, not the entire region. The place had 12,666 residents in the 2020 Census. A boundary intersection does not mean the whole community was hit. Estimated housing exposure: 123 units in 1-inch-or-larger bands, including 69 in 1.5-inch-or-larger bands and 0 in 2-inch-or-larger bands.

Affected states: Byram area, MS
1.5+ inRadar size estimate 328Population Affected 123Houses Affected HailHazards FreeAccount signup
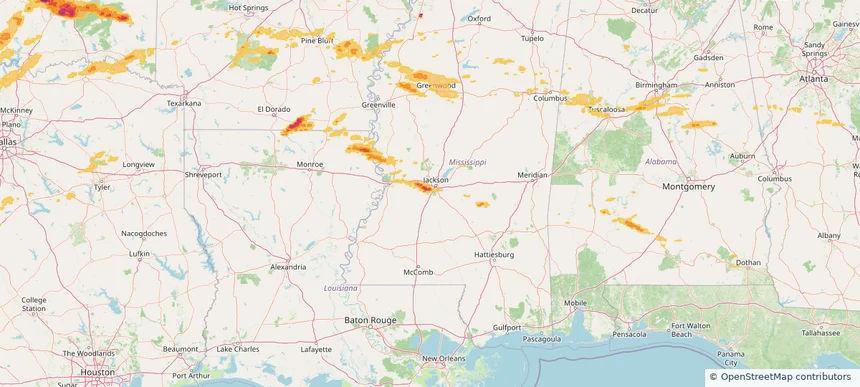
Del City, OK — May 17, 2025 — regional hail footprint preview
Storm footprint preview

Local hail summary for the Del City area: 6.78 square miles of estimated ground-hail footprint; highest mapped band 1.5+ inches. 0 official hail report(s) within the summary area. Exposure estimates are not confirmed property damage. Open the map to explore the full coverage included in your access. Statistics cover the mapped hail footprint inside the Census boundary of Del City, OK, not the entire region. The place had 21,822 residents in the 2020 Census. A boundary intersection does not mean the whole community was hit. Estimated housing exposure: 9,137 units in 1-inch-or-larger bands, including 723 in 1.5-inch-or-larger bands and 0 in 2-inch-or-larger bands.

Affected states: Del City area, OK
1.5+ inRadar size estimate 21,517Population Affected 9,615Houses Affected HailHazards FreeAccount signup
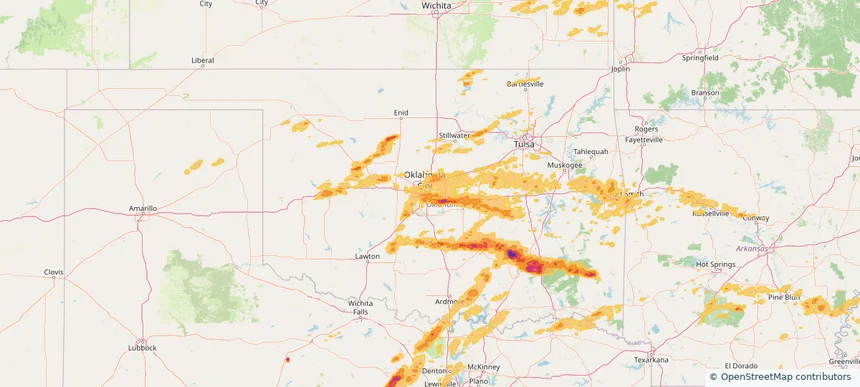
Edmond, OK — May 17, 2025 — regional hail footprint preview
Storm footprint preview

Local hail summary for the Edmond area: 31.79 square miles of estimated ground-hail footprint; highest mapped band 1+ inches. 0 official hail report(s) within the summary area. Exposure estimates are not confirmed property damage. Open the map to explore the full coverage included in your access. Statistics cover the mapped hail footprint inside the Census boundary of Edmond, OK, not the entire region. The place had 94,428 residents in the 2020 Census. A boundary intersection does not mean the whole community was hit. Estimated housing exposure: 719 units in 1-inch-or-larger bands, including 0 in 1.5-inch-or-larger bands and 0 in 2-inch-or-larger bands.

Affected states: Edmond area, OK
1+ inRadar size estimate 6,463Population Affected 2,229Houses Affected HailHazards FreeAccount signup
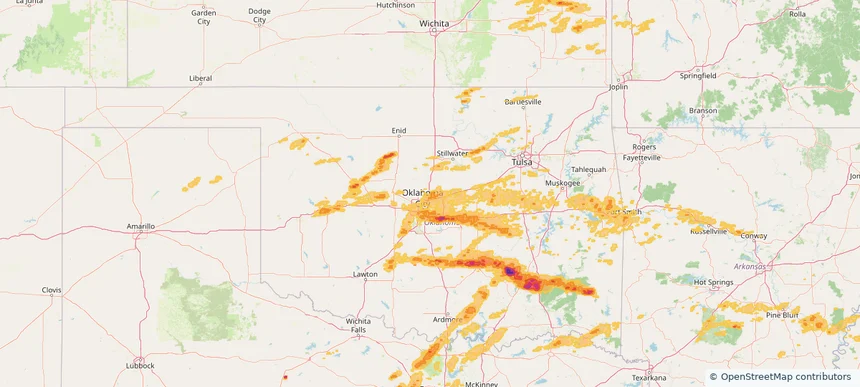
Fort Smith, AR — May 17, 2025 — regional hail footprint preview
Storm footprint preview

Local hail summary for the Fort Smith area: 7.77 square miles of estimated ground-hail footprint; highest mapped band 1+ inches. 1 official hail report(s) within the summary area. Exposure estimates are not confirmed property damage. Open the map to explore the full coverage included in your access. Statistics cover the mapped hail footprint inside the Census boundary of Fort Smith, AR, not the entire region. The place had 89,142 residents in the 2020 Census. A boundary intersection does not mean the whole community was hit. Estimated housing exposure: 537 units in 1-inch-or-larger bands, including 0 in 1.5-inch-or-larger bands and 0 in 2-inch-or-larger bands.

Affected states: Fort Smith area, AR
1+ inRadar size estimate 10,289Population Affected 4,933Houses Affected HailHazards FreeAccount signup
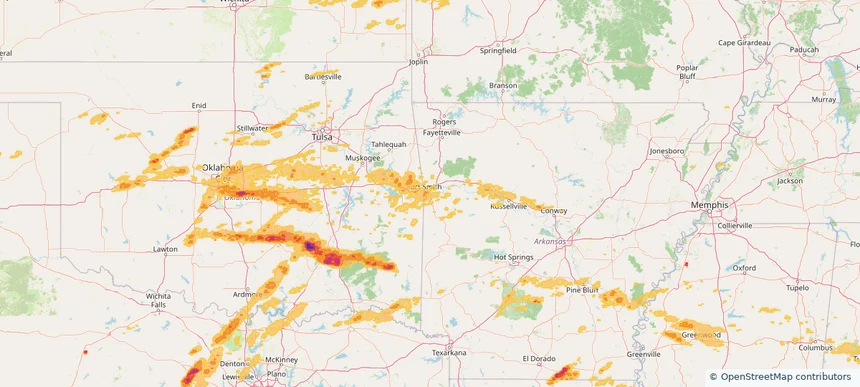
Jackson, MS — May 17, 2025 — regional hail footprint preview
Storm footprint preview

Local hail summary for the Jackson area: 10.78 square miles of estimated ground-hail footprint; highest mapped band 2+ inches. 0 official hail report(s) within the summary area. Exposure estimates are not confirmed property damage. Open the map to explore the full coverage included in your access. Statistics cover the mapped hail footprint inside the Census boundary of Jackson, MS, not the entire region. The place had 153,701 residents in the 2020 Census. A boundary intersection does not mean the whole community was hit. Estimated housing exposure: 4,432 units in 1-inch-or-larger bands, including 2,233 in 1.5-inch-or-larger bands and 340 in 2-inch-or-larger bands.

Affected states: Jackson area, MS
2+ inRadar size estimate 13,063Population Affected 5,228Houses Affected HailHazards FreeAccount signup
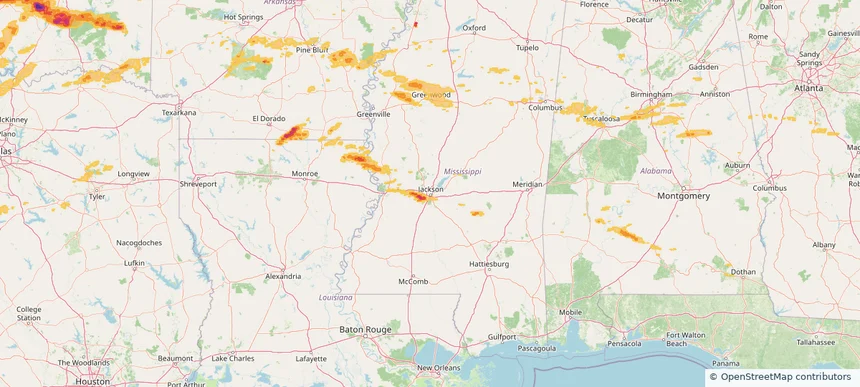
Lebanon, NH — May 17, 2025 — regional hail footprint preview
Storm footprint preview

Local hail summary for the Lebanon area: 28.65 square miles of estimated ground-hail footprint; highest mapped band 1+ inches. 1 official hail report(s) within the summary area. Exposure estimates are not confirmed property damage. Open the map to explore the full coverage included in your access. Statistics cover the mapped hail footprint inside the Census boundary of Lebanon, NH, not the entire region. The place had 14,282 residents in the 2020 Census. A boundary intersection does not mean the whole community was hit. Estimated housing exposure: 5,021 units in 1-inch-or-larger bands, including 0 in 1.5-inch-or-larger bands and 0 in 2-inch-or-larger bands.

Affected states: Lebanon area, NH
1+ inRadar size estimate 12,805Population Affected 6,467Houses Affected HailHazards FreeAccount signup
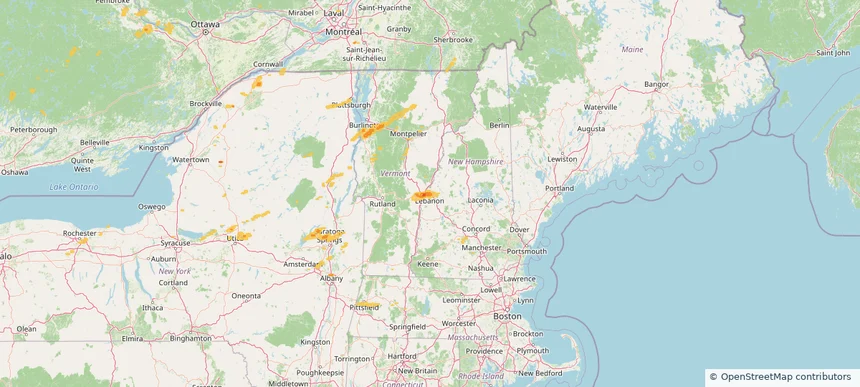
McCalla, AL — May 17, 2025 — regional hail footprint preview
Storm footprint preview

Local hail summary for the McCalla area: 7.95 square miles of estimated ground-hail footprint; highest mapped band 1+ inches. 0 official hail report(s) within the summary area. Exposure estimates are not confirmed property damage. Open the map to explore the full coverage included in your access. Statistics cover the mapped hail footprint inside the Census boundary of McCalla, AL, not the entire region. The place had 12,965 residents in the 2020 Census. A boundary intersection does not mean the whole community was hit. Estimated housing exposure: 297 units in 1-inch-or-larger bands, including 0 in 1.5-inch-or-larger bands and 0 in 2-inch-or-larger bands.

Affected states: McCalla area, AL
1+ inRadar size estimate 1,946Population Affected 772Houses Affected HailHazards FreeAccount signup
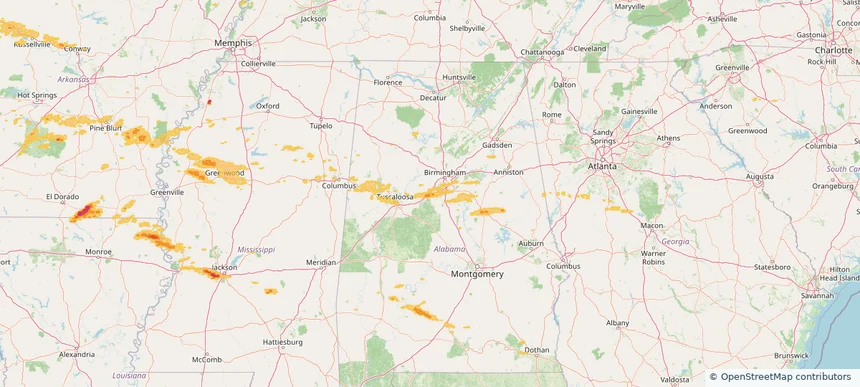
Midwest City, OK — May 17, 2025 — regional hail footprint preview
Storm footprint preview

Local hail summary for the Midwest City area: 8.03 square miles of estimated ground-hail footprint; highest mapped band 1+ inches. 1 official hail report(s) within the summary area. Exposure estimates are not confirmed property damage. Open the map to explore the full coverage included in your access. Statistics cover the mapped hail footprint inside the Census boundary of Midwest City, OK, not the entire region. The place had 58,409 residents in the 2020 Census. A boundary intersection does not mean the whole community was hit. Estimated housing exposure: 2,411 units in 1-inch-or-larger bands, including 0 in 1.5-inch-or-larger bands and 0 in 2-inch-or-larger bands.

Affected states: Midwest City area, OK
1+ inRadar size estimate 18,731Population Affected 8,265Houses Affected HailHazards FreeAccount signup
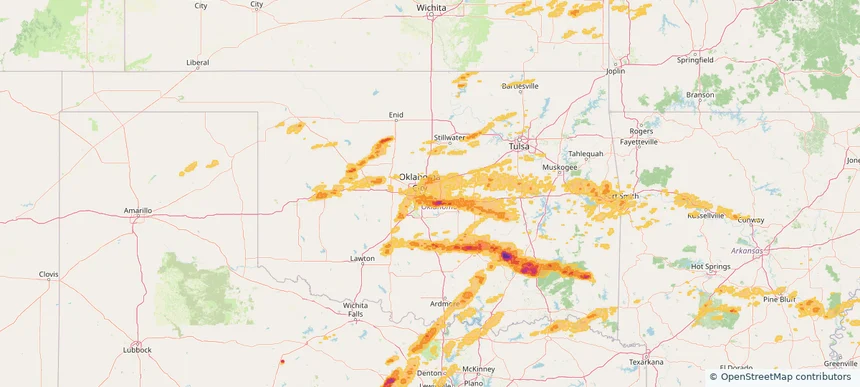
Norman, OK — May 17, 2025 — regional hail footprint preview
Storm footprint preview

Local hail summary for the Norman area: 1.90 square miles of estimated ground-hail footprint; highest mapped band 1.5+ inches. 0 official hail report(s) within the summary area. Exposure estimates are not confirmed property damage. Open the map to explore the full coverage included in your access. Statistics cover the mapped hail footprint inside the Census boundary of Norman, OK, not the entire region. The place had 128,026 residents in the 2020 Census. A boundary intersection does not mean the whole community was hit. Estimated housing exposure: 103 units in 1-inch-or-larger bands, including 46 in 1.5-inch-or-larger bands and 0 in 2-inch-or-larger bands.

Affected states: Norman area, OK
1.5+ inRadar size estimate 250Population Affected 103Houses Affected HailHazards FreeAccount signup
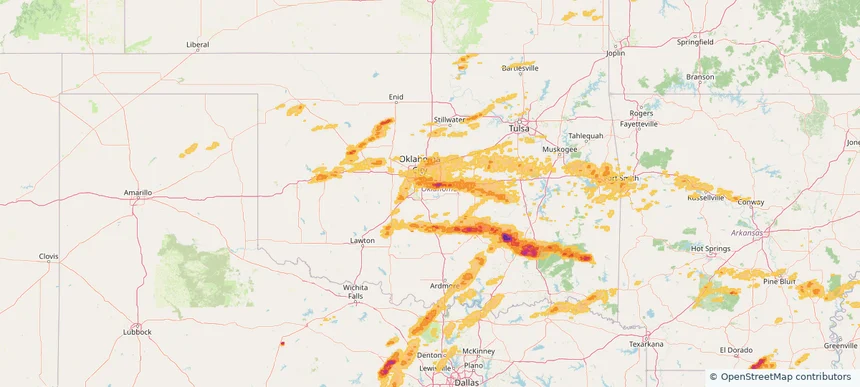
Oklahoma City, OK — May 17, 2025 — regional hail footprint preview
Storm footprint preview

Local hail summary for the Oklahoma City area: 164.61 square miles of estimated ground-hail footprint; highest mapped band 2.5+ inches. 6 official hail report(s) within the summary area. Exposure estimates are not confirmed property damage. Open the map to explore the full coverage included in your access. Statistics cover the mapped hail footprint inside the Census boundary of Oklahoma City, OK, not the entire region. The place had 681,054 residents in the 2020 Census. A boundary intersection does not mean the whole community was hit. Estimated housing exposure: 29,352 units in 1-inch-or-larger bands, including 2,071 in 1.5-inch-or-larger bands and 621 in 2-inch-or-larger bands.

Affected states: Oklahoma City area, OK
2.5+ inRadar size estimate 158,662Population Affected 64,350Houses Affected HailHazards FreeAccount signup
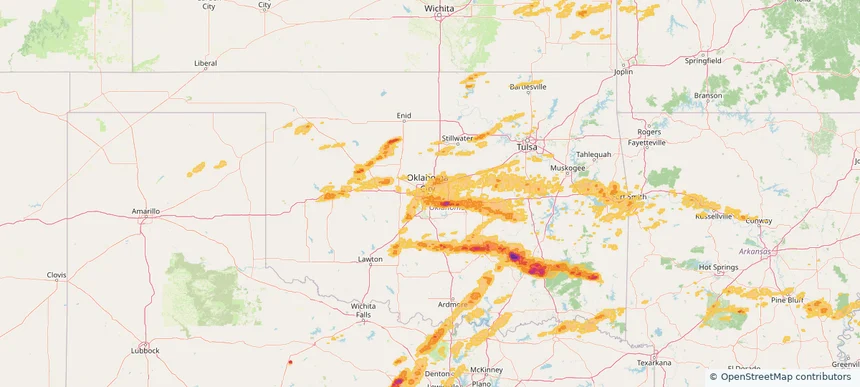
Shawnee, OK — May 17, 2025 — regional hail footprint preview
Storm footprint preview

Local hail summary for the Shawnee area: 31.68 square miles of estimated ground-hail footprint; highest mapped band 1.5+ inches. 0 official hail report(s) within the summary area. Exposure estimates are not confirmed property damage. Open the map to explore the full coverage included in your access. Statistics cover the mapped hail footprint inside the Census boundary of Shawnee, OK, not the entire region. The place had 31,377 residents in the 2020 Census. A boundary intersection does not mean the whole community was hit. Estimated housing exposure: 7,336 units in 1-inch-or-larger bands, including 5 in 1.5-inch-or-larger bands and 0 in 2-inch-or-larger bands.

Affected states: Shawnee area, OK
1.5+ inRadar size estimate 28,052Population Affected 12,210Houses Affected HailHazards FreeAccount signup
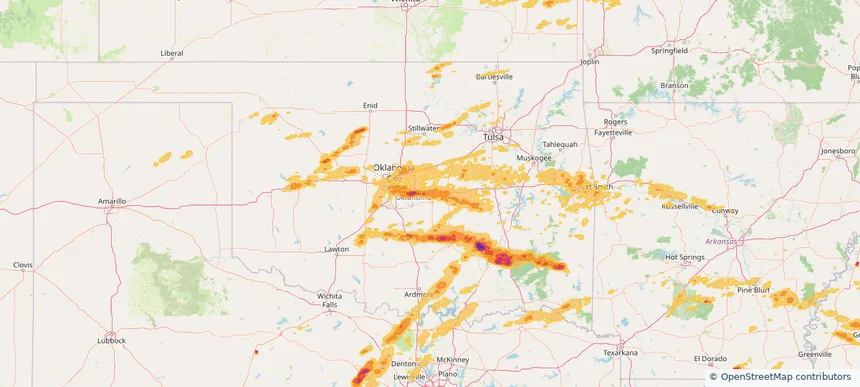
Page 93 of 99
‹ 1 92 93 94 99 ›

Frequently asked questions

Can I search hail maps by coverage area?

Yes. The storm library supports coverage-area filtering so you can find hail maps and hail swaths in a target service area.

What kinds of storms appear in the HailMapr library?

The library focuses on published hail events, including ready storm maps and live storms once hail has been detected and a public swath is available.

Are HailMapr storm pages useful for roofers and adjusters?

Yes. They are built to help roofers, adjusters, restoration teams, and property owners review storm footprints before purchase.