
Storm library

Browse live and recent hail maps.

Review storm footprints, hail swaths, reports, and replay access. Create a free account to save your setup and move into map access when a storm matters.

Search filters
Clear
Newest storms first by default.
Don't see your storm? Request a qualifying storm map and we'll email you when it is ready.
Showing 2185-2208 of 2370 storms · Page 92 of 99
‹ 1 91 92 93 99 ›
Request a storm map

Tell us about the storm and we'll build the map. Once it's published you'll get an email and can purchase it from the library — just like any other event.

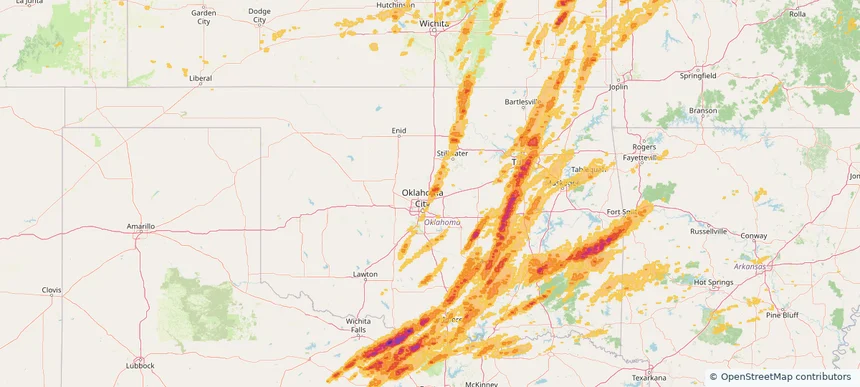
Edmond, OK — May 19, 2025 — regional hail footprint preview
Storm footprint preview

Local hail summary for the Edmond area: 17.83 square miles of estimated ground-hail footprint; highest mapped band 1+ inches. 0 official hail report(s) within the summary area. Exposure estimates are not confirmed property damage. Open the map to explore the full coverage included in your access. Statistics cover the mapped hail footprint inside the Census boundary of Edmond, OK, not the entire region. The place had 94,428 residents in the 2020 Census. A boundary intersection does not mean the whole community was hit. Estimated housing exposure: 653 units in 1-inch-or-larger bands, including 0 in 1.5-inch-or-larger bands and 0 in 2-inch-or-larger bands.

Affected states: Edmond area, OK
1+ inRadar size estimate 3,586Population Affected 1,346Houses Affected HailHazards FreeAccount signup
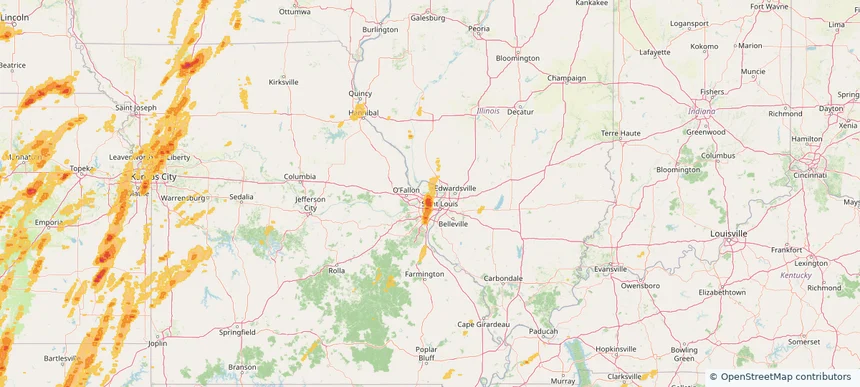
Florissant, MO — May 19, 2025 — regional hail footprint preview
Storm footprint preview

Local hail summary for the Florissant area: 4.19 square miles of estimated ground-hail footprint; highest mapped band 1+ inches. 1 official hail report(s) within the summary area. Exposure estimates are not confirmed property damage. Open the map to explore the full coverage included in your access. Statistics cover the mapped hail footprint inside the Census boundary of Florissant, MO, not the entire region. The place had 52,533 residents in the 2020 Census. A boundary intersection does not mean the whole community was hit. Estimated housing exposure: 4,877 units in 1-inch-or-larger bands, including 0 in 1.5-inch-or-larger bands and 0 in 2-inch-or-larger bands.

Affected states: Florissant area, MO
1+ inRadar size estimate 18,998Population Affected 8,205Houses Affected HailHazards FreeAccount signup
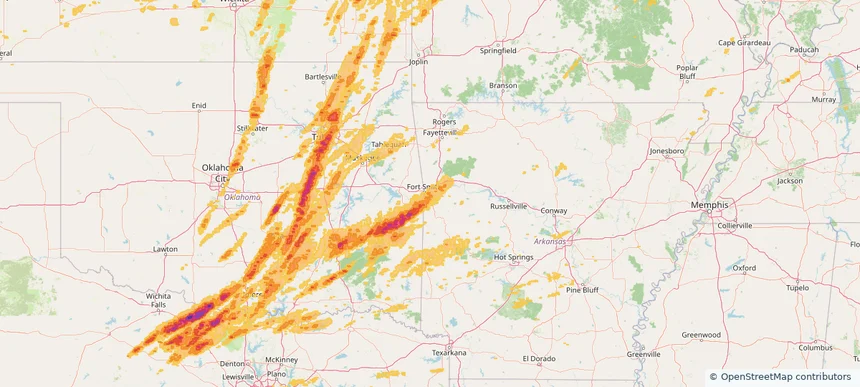
Fort Smith, AR — May 19, 2025 — regional hail footprint preview
Storm footprint preview

Local hail summary for the Fort Smith area: 33.26 square miles of estimated ground-hail footprint; highest mapped band 1+ inches. 0 official hail report(s) within the summary area. Exposure estimates are not confirmed property damage. Open the map to explore the full coverage included in your access. Statistics cover the mapped hail footprint inside the Census boundary of Fort Smith, AR, not the entire region. The place had 89,142 residents in the 2020 Census. A boundary intersection does not mean the whole community was hit. Estimated housing exposure: 7,733 units in 1-inch-or-larger bands, including 0 in 1.5-inch-or-larger bands and 0 in 2-inch-or-larger bands.

Affected states: Fort Smith area, AR
1+ inRadar size estimate 39,851Population Affected 18,509Houses Affected HailHazards FreeAccount signup
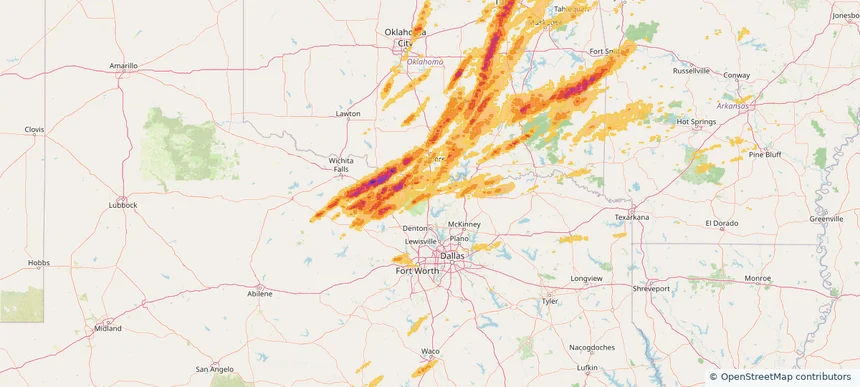
Gainesville, TX — May 19, 2025 — regional hail footprint preview
Storm footprint preview

Local hail summary for the Gainesville area: 8.08 square miles of estimated ground-hail footprint; highest mapped band 1+ inches. 0 official hail report(s) within the summary area. Exposure estimates are not confirmed property damage. Open the map to explore the full coverage included in your access. Statistics cover the mapped hail footprint inside the Census boundary of Gainesville, TX, not the entire region. The place had 17,394 residents in the 2020 Census. A boundary intersection does not mean the whole community was hit. Estimated housing exposure: 307 units in 1-inch-or-larger bands, including 0 in 1.5-inch-or-larger bands and 0 in 2-inch-or-larger bands.

Affected states: Gainesville area, TX
1+ inRadar size estimate 4,005Population Affected 1,613Houses Affected HailHazards FreeAccount signup
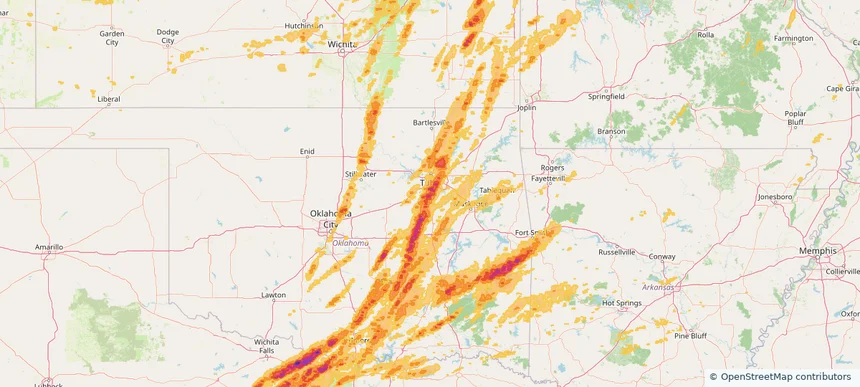
Glenpool, OK — May 19, 2025 — regional hail footprint preview
Storm footprint preview

Local hail summary for the Glenpool area: 10.99 square miles of estimated ground-hail footprint; highest mapped band 1.5+ inches. 0 official hail report(s) within the summary area. Exposure estimates are not confirmed property damage. Open the map to explore the full coverage included in your access. Statistics cover the mapped hail footprint inside the Census boundary of Glenpool, OK, not the entire region. The place had 13,691 residents in the 2020 Census. A boundary intersection does not mean the whole community was hit. Estimated housing exposure: 4,856 units in 1-inch-or-larger bands, including 4,856 in 1.5-inch-or-larger bands and 0 in 2-inch-or-larger bands.

Affected states: Glenpool area, OK
1.5+ inRadar size estimate 13,129Population Affected 4,856Houses Affected HailHazards FreeAccount signup
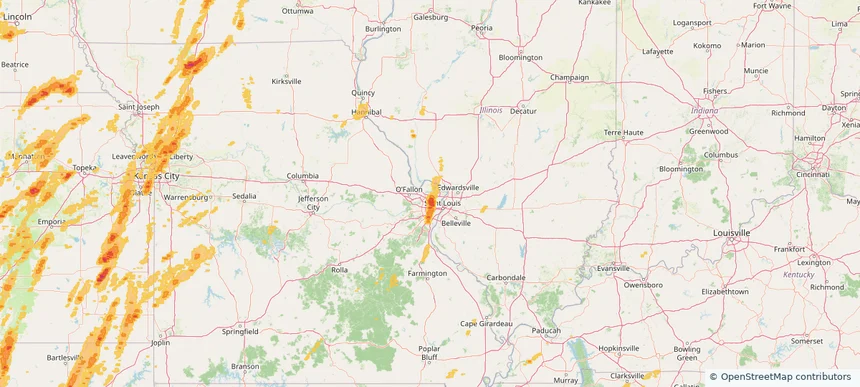
Hazelwood, MO — May 19, 2025 — regional hail footprint preview
Storm footprint preview

Local hail summary for the Hazelwood area: 5.09 square miles of estimated ground-hail footprint; highest mapped band 1.5+ inches. 1 official hail report(s) within the summary area. Exposure estimates are not confirmed property damage. Open the map to explore the full coverage included in your access. Statistics cover the mapped hail footprint inside the Census boundary of Hazelwood, MO, not the entire region. The place had 25,458 residents in the 2020 Census. A boundary intersection does not mean the whole community was hit. Estimated housing exposure: 7,205 units in 1-inch-or-larger bands, including 0 in 1.5-inch-or-larger bands and 0 in 2-inch-or-larger bands.

Affected states: Hazelwood area, MO
1.5+ inRadar size estimate 16,720Population Affected 7,735Houses Affected HailHazards FreeAccount signup
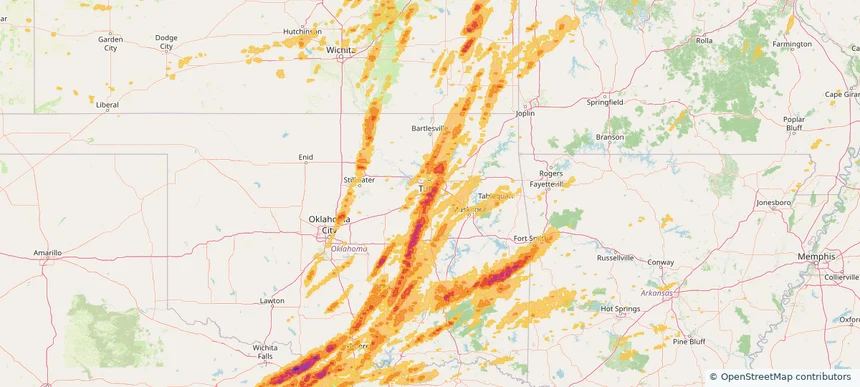
Jenks, OK — May 19, 2025 — regional hail footprint preview
Storm footprint preview

Local hail summary for the Jenks area: 17.83 square miles of estimated ground-hail footprint; highest mapped band 2+ inches. 1 official hail report(s) within the summary area. Exposure estimates are not confirmed property damage. Open the map to explore the full coverage included in your access. Statistics cover the mapped hail footprint inside the Census boundary of Jenks, OK, not the entire region. The place had 25,949 residents in the 2020 Census. A boundary intersection does not mean the whole community was hit. Estimated housing exposure: 9,268 units in 1-inch-or-larger bands, including 8,012 in 1.5-inch-or-larger bands and 1,737 in 2-inch-or-larger bands.

Affected states: Jenks area, OK
2+ inRadar size estimate 25,907Population Affected 9,269Houses Affected HailHazards FreeAccount signup
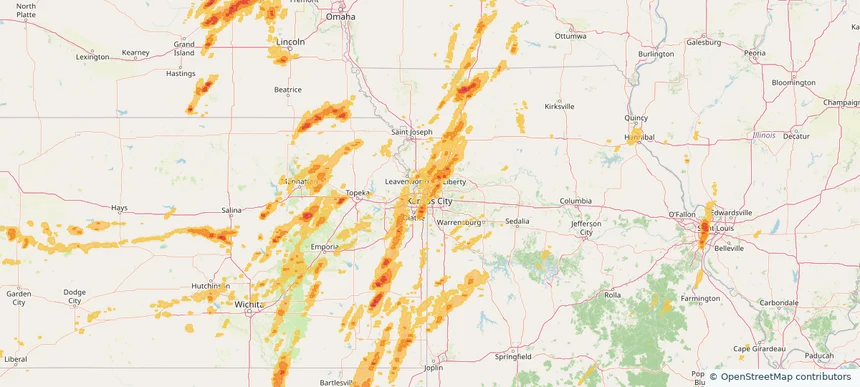
Kansas City, MO — May 19, 2025 — regional hail footprint preview
Storm footprint preview

Local hail summary for the Kansas City area: 26.71 square miles of estimated ground-hail footprint; highest mapped band 1.5+ inches. 0 official hail report(s) within the summary area. Exposure estimates are not confirmed property damage. Open the map to explore the full coverage included in your access. Statistics cover the mapped hail footprint inside the Census boundary of Kansas City, MO, not the entire region. The place had 508,090 residents in the 2020 Census. A boundary intersection does not mean the whole community was hit. Estimated housing exposure: 5,942 units in 1-inch-or-larger bands, including 7 in 1.5-inch-or-larger bands and 0 in 2-inch-or-larger bands.

Affected states: Kansas City area, MO
1.5+ inRadar size estimate 31,958Population Affected 11,313Houses Affected HailHazards FreeAccount signup
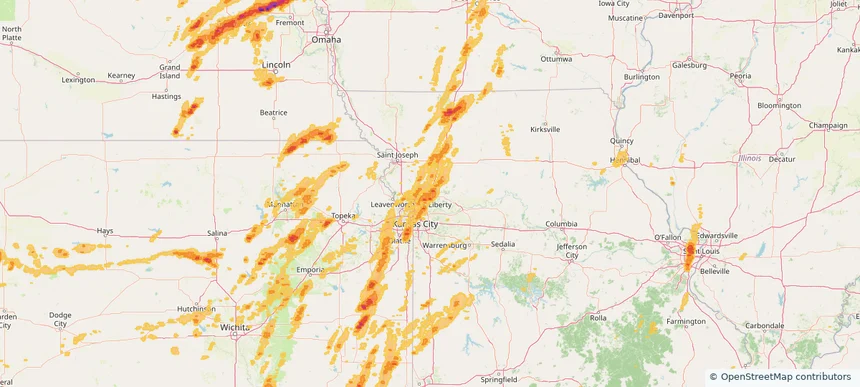
Kearney, MO — May 19, 2025 — regional hail footprint preview
Storm footprint preview

Local hail summary for the Kearney area: 12.49 square miles of estimated ground-hail footprint; highest mapped band 1.5+ inches. 0 official hail report(s) within the summary area. Exposure estimates are not confirmed property damage. Open the map to explore the full coverage included in your access. Statistics cover the mapped hail footprint inside the Census boundary of Kearney, MO, not the entire region. The place had 10,404 residents in the 2020 Census. A boundary intersection does not mean the whole community was hit. Estimated housing exposure: 2,600 units in 1-inch-or-larger bands, including 0 in 1.5-inch-or-larger bands and 0 in 2-inch-or-larger bands.

Affected states: Kearney area, MO
1.5+ inRadar size estimate 10,028Population Affected 3,826Houses Affected HailHazards FreeAccount signup
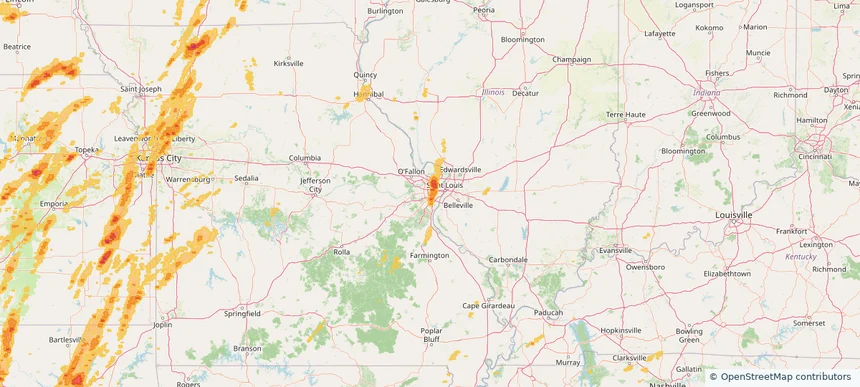
Kirkwood, MO — May 19, 2025 — regional hail footprint preview
Storm footprint preview

Local hail summary for the Kirkwood area: 3.01 square miles of estimated ground-hail footprint; highest mapped band 1+ inches. 1 official hail report(s) within the summary area. Exposure estimates are not confirmed property damage. Open the map to explore the full coverage included in your access. Statistics cover the mapped hail footprint inside the Census boundary of Kirkwood, MO, not the entire region. The place had 29,461 residents in the 2020 Census. A boundary intersection does not mean the whole community was hit. Estimated housing exposure: 3,992 units in 1-inch-or-larger bands, including 0 in 1.5-inch-or-larger bands and 0 in 2-inch-or-larger bands.

Affected states: Kirkwood area, MO
1+ inRadar size estimate 11,717Population Affected 5,402Houses Affected HailHazards FreeAccount signup
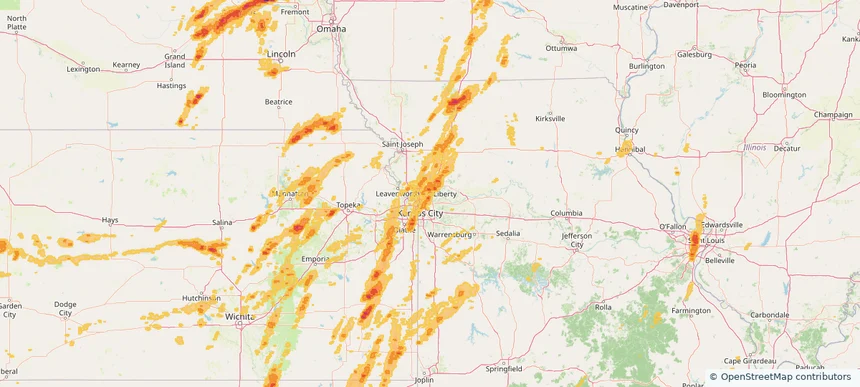
Liberty, MO — May 19, 2025 — regional hail footprint preview
Storm footprint preview

Local hail summary for the Liberty area: 10.95 square miles of estimated ground-hail footprint; highest mapped band 1.5+ inches. 0 official hail report(s) within the summary area. Exposure estimates are not confirmed property damage. Open the map to explore the full coverage included in your access. Statistics cover the mapped hail footprint inside the Census boundary of Liberty, MO, not the entire region. The place had 30,167 residents in the 2020 Census. A boundary intersection does not mean the whole community was hit. Estimated housing exposure: 3,613 units in 1-inch-or-larger bands, including 0 in 1.5-inch-or-larger bands and 0 in 2-inch-or-larger bands.

Affected states: Liberty area, MO
1.5+ inRadar size estimate 12,967Population Affected 4,698Houses Affected HailHazards FreeAccount signup
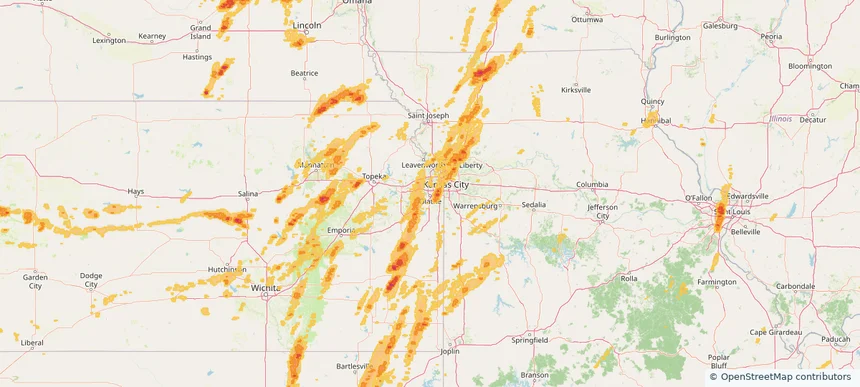
Olathe, KS — May 19, 2025 — regional hail footprint preview
Storm footprint preview

Local hail summary for the Olathe area: 3.26 square miles of estimated ground-hail footprint; highest mapped band 1+ inches. 0 official hail report(s) within the summary area. Exposure estimates are not confirmed property damage. Open the map to explore the full coverage included in your access. Statistics cover the mapped hail footprint inside the Census boundary of Olathe, KS, not the entire region. The place had 141,290 residents in the 2020 Census. A boundary intersection does not mean the whole community was hit. Estimated housing exposure: 621 units in 1-inch-or-larger bands, including 0 in 1.5-inch-or-larger bands and 0 in 2-inch-or-larger bands.

Affected states: Olathe area, KS
1+ inRadar size estimate 7,345Population Affected 2,651Houses Affected HailHazards FreeAccount signup
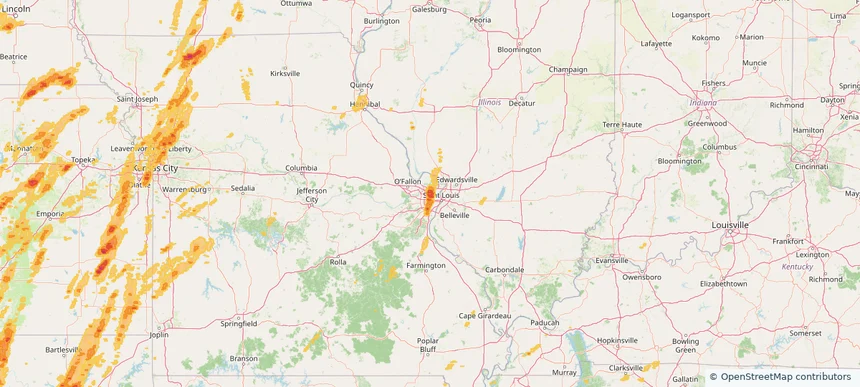
Overland, MO — May 19, 2025 — regional hail footprint preview
Storm footprint preview

Local hail summary for the Overland area: 4.40 square miles of estimated ground-hail footprint; highest mapped band 1.5+ inches. 0 official hail report(s) within the summary area. Exposure estimates are not confirmed property damage. Open the map to explore the full coverage included in your access. Statistics cover the mapped hail footprint inside the Census boundary of Overland, MO, not the entire region. The place had 15,955 residents in the 2020 Census. A boundary intersection does not mean the whole community was hit. Estimated housing exposure: 7,287 units in 1-inch-or-larger bands, including 6,643 in 1.5-inch-or-larger bands and 0 in 2-inch-or-larger bands.

Affected states: Overland area, MO
1.5+ inRadar size estimate 15,955Population Affected 7,287Houses Affected HailHazards FreeAccount signup
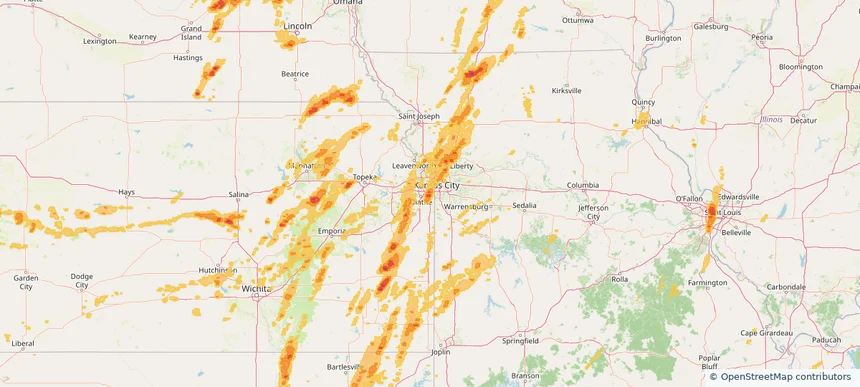
Overland Park, KS — May 19, 2025 — regional hail footprint preview
Storm footprint preview

Local hail summary for the Overland Park area: 38.17 square miles of estimated ground-hail footprint; highest mapped band 1.5+ inches. 0 official hail report(s) within the summary area. Exposure estimates are not confirmed property damage. Open the map to explore the full coverage included in your access. Statistics cover the mapped hail footprint inside the Census boundary of Overland Park, KS, not the entire region. The place had 197,238 residents in the 2020 Census. A boundary intersection does not mean the whole community was hit. Estimated housing exposure: 42,804 units in 1-inch-or-larger bands, including 6,279 in 1.5-inch-or-larger bands and 0 in 2-inch-or-larger bands.

Affected states: Overland Park area, KS
1.5+ inRadar size estimate 127,842Population Affected 56,419Houses Affected HailHazards FreeAccount signup
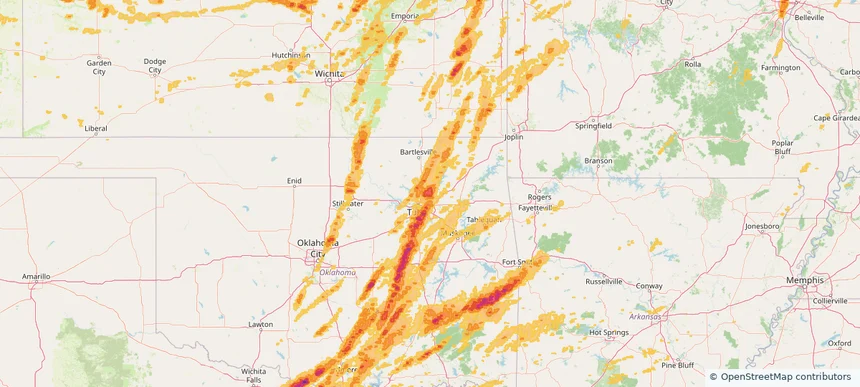
Owasso, OK — May 19, 2025 — regional hail footprint preview
Storm footprint preview

Local hail summary for the Owasso area: 16.47 square miles of estimated ground-hail footprint; highest mapped band 1.5+ inches. 0 official hail report(s) within the summary area. Exposure estimates are not confirmed property damage. Open the map to explore the full coverage included in your access. Statistics cover the mapped hail footprint inside the Census boundary of Owasso, OK, not the entire region. The place had 38,240 residents in the 2020 Census. A boundary intersection does not mean the whole community was hit. Estimated housing exposure: 12,168 units in 1-inch-or-larger bands, including 4,425 in 1.5-inch-or-larger bands and 0 in 2-inch-or-larger bands.

Affected states: Owasso area, OK
1.5+ inRadar size estimate 37,081Population Affected 14,548Houses Affected HailHazards FreeAccount signup
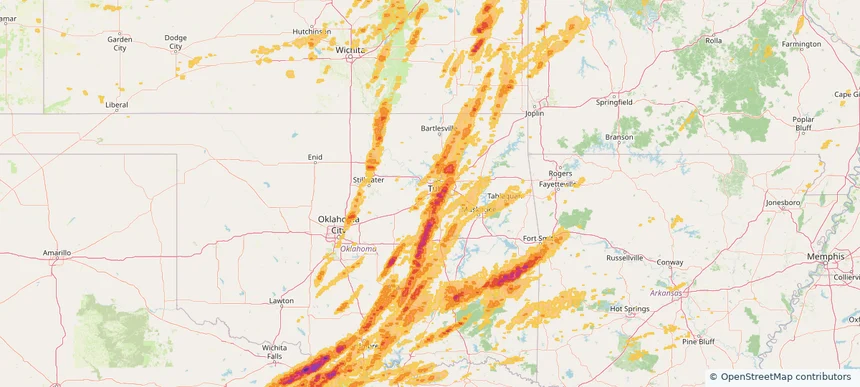
Sapulpa, OK — May 19, 2025 — regional hail footprint preview
Storm footprint preview

Local hail summary for the Sapulpa area: 1.59 square miles of estimated ground-hail footprint; highest mapped band 1.5+ inches. 0 official hail report(s) within the summary area. Exposure estimates are not confirmed property damage. Open the map to explore the full coverage included in your access. Statistics cover the mapped hail footprint inside the Census boundary of Sapulpa, OK, not the entire region. The place had 21,929 residents in the 2020 Census. A boundary intersection does not mean the whole community was hit. Estimated housing exposure: 373 units in 1-inch-or-larger bands, including 15 in 1.5-inch-or-larger bands and 0 in 2-inch-or-larger bands.

Affected states: Sapulpa area, OK
1.5+ inRadar size estimate 968Population Affected 380Houses Affected HailHazards FreeAccount signup
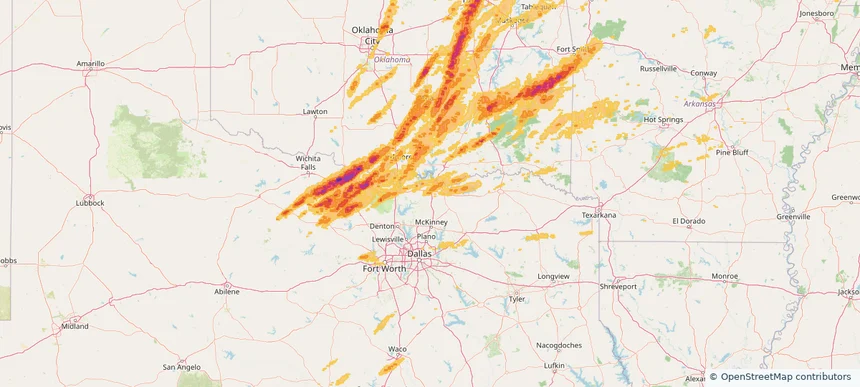
Sherman, TX — May 19, 2025 — regional hail footprint preview
Storm footprint preview

Local hail summary for the Sherman area: 11.27 square miles of estimated ground-hail footprint; highest mapped band 1+ inches. 0 official hail report(s) within the summary area. Exposure estimates are not confirmed property damage. Open the map to explore the full coverage included in your access. Statistics cover the mapped hail footprint inside the Census boundary of Sherman, TX, not the entire region. The place had 43,645 residents in the 2020 Census. A boundary intersection does not mean the whole community was hit. Estimated housing exposure: 160 units in 1-inch-or-larger bands, including 0 in 1.5-inch-or-larger bands and 0 in 2-inch-or-larger bands.

Affected states: Sherman area, TX
1+ inRadar size estimate 16,325Population Affected 7,184Houses Affected HailHazards FreeAccount signup
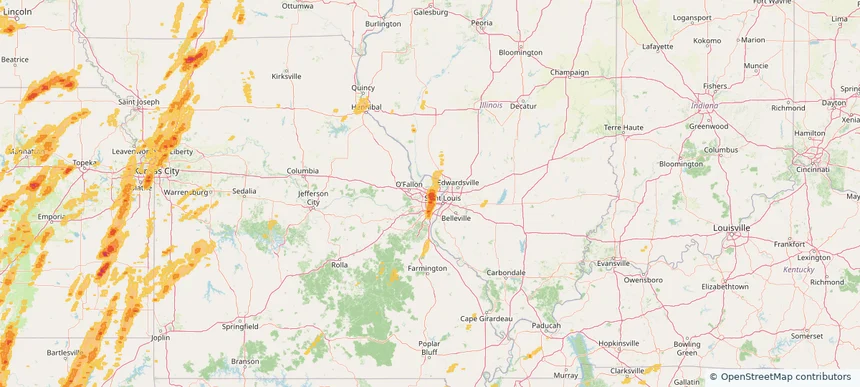
St. Ann, MO — May 19, 2025 — regional hail footprint preview
Storm footprint preview

Local hail summary for the St. Ann area: 1.97 square miles of estimated ground-hail footprint; highest mapped band 1.5+ inches. 0 official hail report(s) within the summary area. Exposure estimates are not confirmed property damage. Open the map to explore the full coverage included in your access. Statistics cover the mapped hail footprint inside the Census boundary of St. Ann, MO, not the entire region. The place had 13,019 residents in the 2020 Census. A boundary intersection does not mean the whole community was hit. Estimated housing exposure: 4,325 units in 1-inch-or-larger bands, including 3,080 in 1.5-inch-or-larger bands and 0 in 2-inch-or-larger bands.

Affected states: St. Ann area, MO
1.5+ inRadar size estimate 8,261Population Affected 4,347Houses Affected HailHazards FreeAccount signup
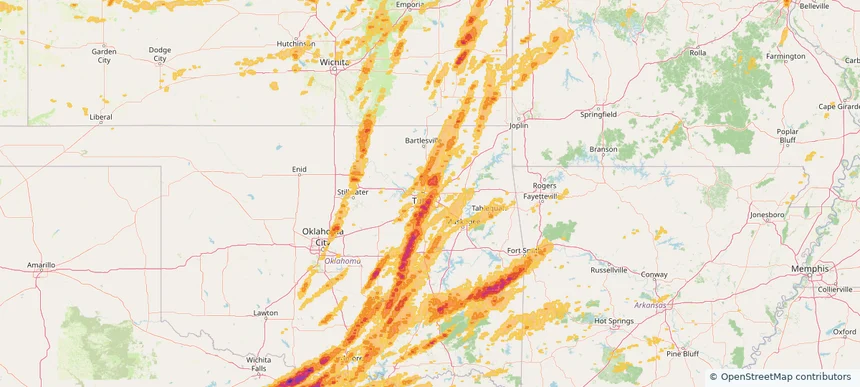
Tulsa, OK — May 19, 2025 — regional hail footprint preview
Storm footprint preview

Local hail summary for the Tulsa area: 103.53 square miles of estimated ground-hail footprint; highest mapped band 2+ inches. 3 official hail report(s) within the summary area. Exposure estimates are not confirmed property damage. Open the map to explore the full coverage included in your access. Statistics cover the mapped hail footprint inside the Census boundary of Tulsa, OK, not the entire region. The place had 413,066 residents in the 2020 Census. A boundary intersection does not mean the whole community was hit. Estimated housing exposure: 104,753 units in 1-inch-or-larger bands, including 59,733 in 1.5-inch-or-larger bands and 4,238 in 2-inch-or-larger bands.

Affected states: Tulsa area, OK
2+ inRadar size estimate 258,097Population Affected 117,970Houses Affected HailHazards FreeAccount signup
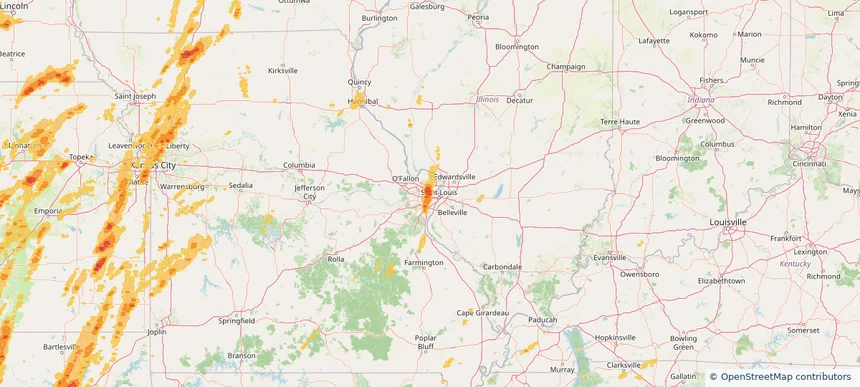
University City, MO — May 19, 2025 — regional hail footprint preview
Storm footprint preview

Local hail summary for the University City area: 3.39 square miles of estimated ground-hail footprint; highest mapped band 1.5+ inches. 0 official hail report(s) within the summary area. Exposure estimates are not confirmed property damage. Open the map to explore the full coverage included in your access. Statistics cover the mapped hail footprint inside the Census boundary of University City, MO, not the entire region. The place had 35,065 residents in the 2020 Census. A boundary intersection does not mean the whole community was hit. Estimated housing exposure: 8,538 units in 1-inch-or-larger bands, including 3,397 in 1.5-inch-or-larger bands and 0 in 2-inch-or-larger bands.

Affected states: University City area, MO
1.5+ inRadar size estimate 17,301Population Affected 9,123Houses Affected HailHazards FreeAccount signup
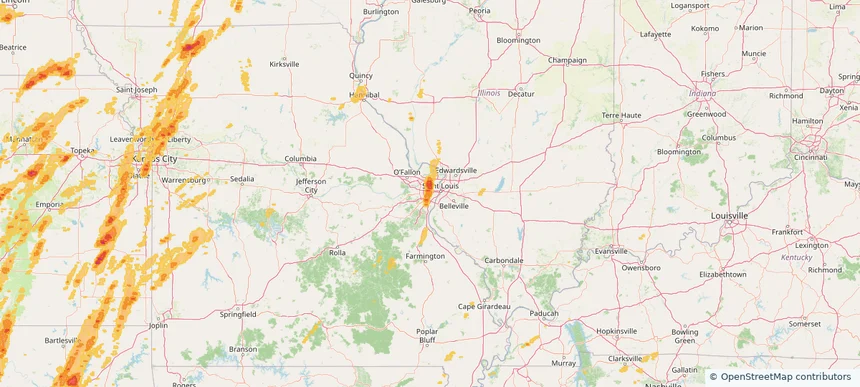
Webster Groves, MO — May 19, 2025 — regional hail footprint preview
Storm footprint preview

Local hail summary for the Webster Groves area: 4.63 square miles of estimated ground-hail footprint; highest mapped band 1+ inches. 0 official hail report(s) within the summary area. Exposure estimates are not confirmed property damage. Open the map to explore the full coverage included in your access. Statistics cover the mapped hail footprint inside the Census boundary of Webster Groves, MO, not the entire region. The place had 24,010 residents in the 2020 Census. A boundary intersection does not mean the whole community was hit. Estimated housing exposure: 5,093 units in 1-inch-or-larger bands, including 0 in 1.5-inch-or-larger bands and 0 in 2-inch-or-larger bands.

Affected states: Webster Groves area, MO
1+ inRadar size estimate 18,151Population Affected 7,201Houses Affected HailHazards FreeAccount signup
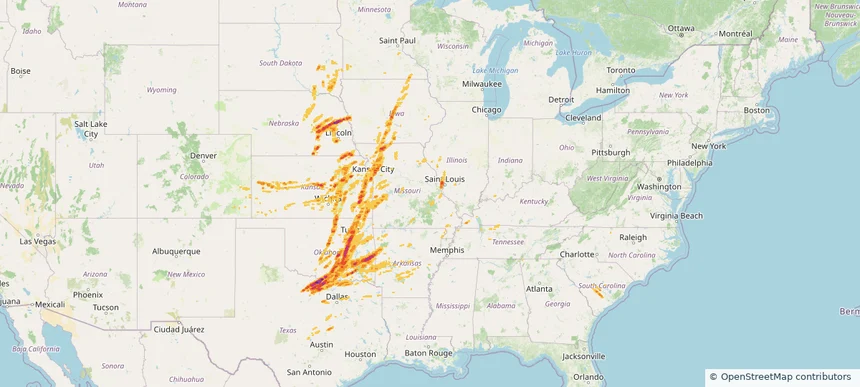
Historical Hail — 2025-05-19 — regional hail footprint preview
Storm footprint preview
May 19, 2025 7:00 AM to May 20, 2025 7:00 AM CST

Historical Hail — 2025-05-19

Hail as large as 2.75 inches was reported near Rubottom, OKLAHOMA. Wind up to 105 mph was reported near 4 miles southeast of Partridge, KS. 191 tornadoes were reported, including one near Edwards, KANSAS. The storm had 83 official hail reports.

Affected states: National, AL, AR, CO, IL, IA, KS, KY, MN, MO, NE, OK, SC, SD, TN, TX
3.0 inRadar size estimate 2,736,055Population Affected 1,205,126Houses Affected Hail · Wind · TornadoHazards FreeAccount signup
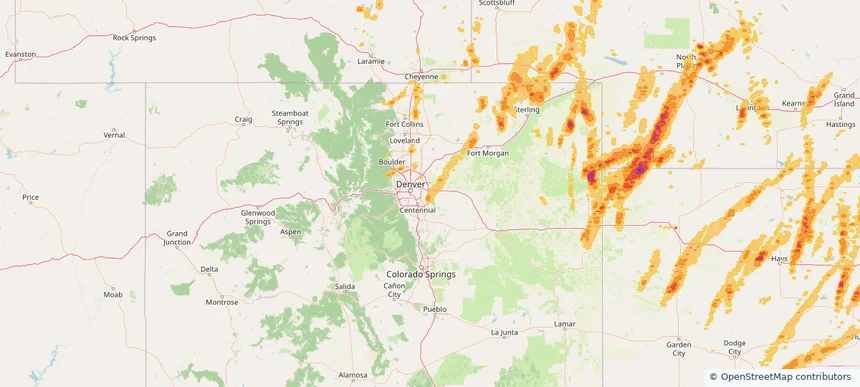
Aurora, CO — May 18, 2025 — regional hail footprint preview
Storm footprint preview

Local hail summary for the Aurora area: 49.83 square miles of estimated ground-hail footprint; highest mapped band 1+ inches. 0 official hail report(s) within the summary area. Exposure estimates are not confirmed property damage. Open the map to explore the full coverage included in your access. Statistics cover the mapped hail footprint inside the Census boundary of Aurora, CO, not the entire region. The place had 386,261 residents in the 2020 Census. A boundary intersection does not mean the whole community was hit. Estimated housing exposure: 3,373 units in 1-inch-or-larger bands, including 0 in 1.5-inch-or-larger bands and 0 in 2-inch-or-larger bands.

Affected states: Aurora area, CO
1+ inRadar size estimate 26,843Population Affected 8,551Houses Affected HailHazards FreeAccount signup
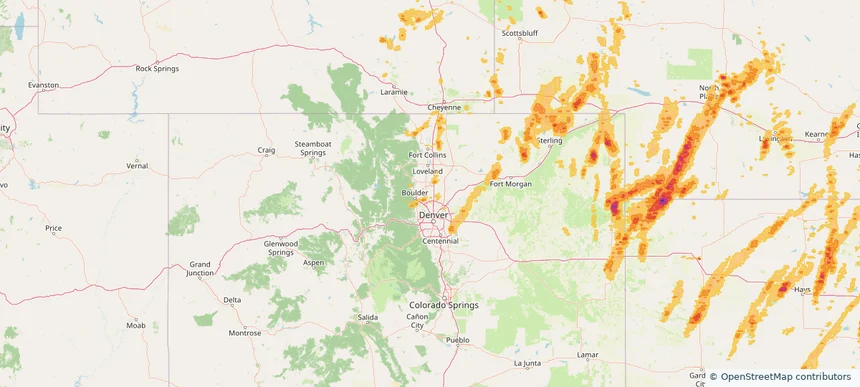
Erie, CO — May 18, 2025 — regional hail footprint preview
Storm footprint preview

Local hail summary for the Erie area: 0.67 square miles of estimated ground-hail footprint; highest mapped band 1+ inches. 0 official hail report(s) within the summary area. Exposure estimates are not confirmed property damage. Open the map to explore the full coverage included in your access. Statistics cover the mapped hail footprint inside the Census boundary of Erie, CO, not the entire region. The place had 30,038 residents in the 2020 Census. A boundary intersection does not mean the whole community was hit. Estimated housing exposure: 223 units in 1-inch-or-larger bands, including 0 in 1.5-inch-or-larger bands and 0 in 2-inch-or-larger bands.

Affected states: Erie area, CO
1+ inRadar size estimate 1,883Population Affected 654Houses Affected HailHazards FreeAccount signup
Page 92 of 99
‹ 1 91 92 93 99 ›

Frequently asked questions

Can I search hail maps by coverage area?

Yes. The storm library supports coverage-area filtering so you can find hail maps and hail swaths in a target service area.

What kinds of storms appear in the HailMapr library?

The library focuses on published hail events, including ready storm maps and live storms once hail has been detected and a public swath is available.

Are HailMapr storm pages useful for roofers and adjusters?

Yes. They are built to help roofers, adjusters, restoration teams, and property owners review storm footprints before purchase.