Storm library

Browse live and recent hail maps.

Review storm footprints, hail swaths, reports, and replay access. Create a free account to save your setup and move into map access when a storm matters.

Search filters
Clear
Newest storms first by default.
Don't see your storm? Request a qualifying storm map and we'll email you when it is ready.
Showing 1633-1656 of 2404 storms · Page 69 of 101
‹ 1 68 69 70 101 ›
Request a storm map

Tell us about the storm and we'll build the map. Once it's published you'll get an email and can purchase it from the library — just like any other event.

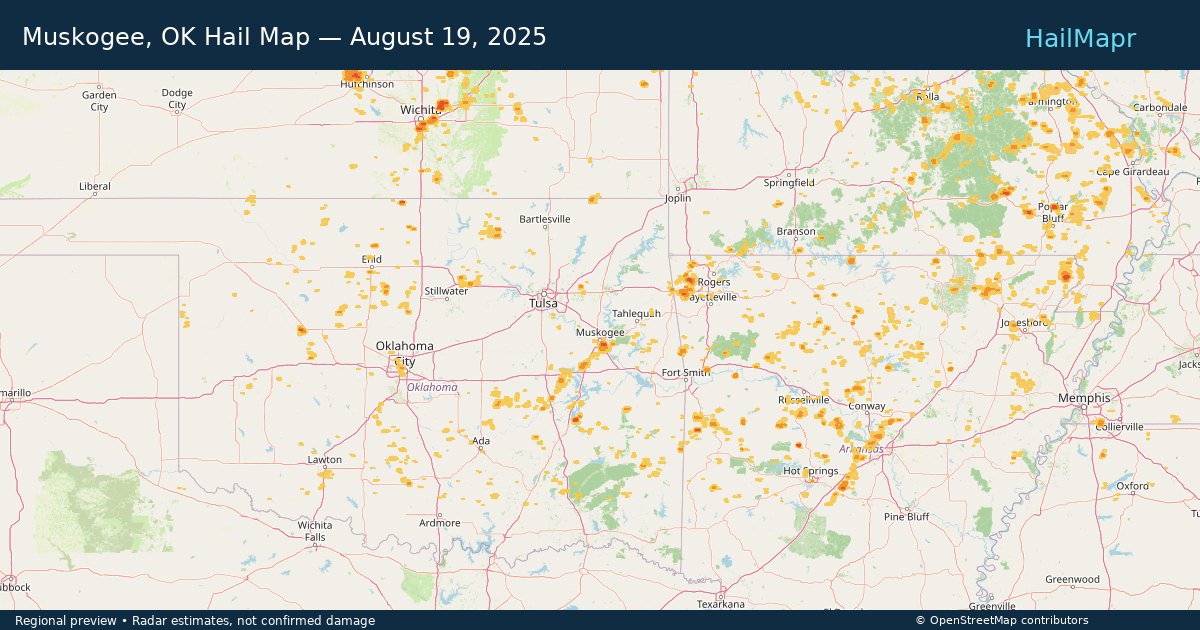
Muskogee, OK — August 19, 2025 — regional hail footprint preview
Storm footprint preview

Local hail summary for the Muskogee area: 3.34 square miles of estimated ground-hail footprint; highest mapped band 1.5+ inches. 0 official hail report(s) within the summary area. Exposure estimates are not confirmed property damage. Open the map to explore the full coverage included in your access. Statistics cover the mapped hail footprint inside the Census boundary of Muskogee, OK, not the entire region. The place had 36,878 residents in the 2020 Census. A boundary intersection does not mean the whole community was hit. Estimated housing exposure: 390 units in 1-inch-or-larger bands, including 0 in 1.5-inch-or-larger bands and 0 in 2-inch-or-larger bands.

Affected states: Muskogee area, OK
1.5+ inRadar size estimate 1,032Population Affected 440Houses Affected HailHazards FreeAccount signup
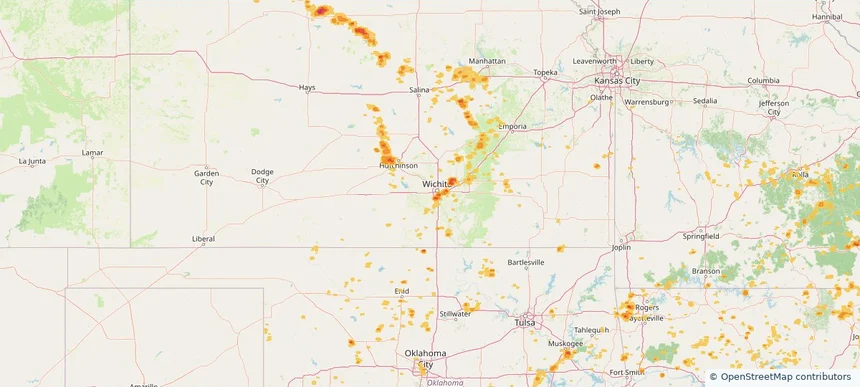
Wichita, KS — August 19, 2025 — regional hail footprint preview
Storm footprint preview

Local hail summary for the Wichita area: 29.14 square miles of estimated ground-hail footprint; highest mapped band 1.5+ inches. 0 official hail report(s) within the summary area. Exposure estimates are not confirmed property damage. Open the map to explore the full coverage included in your access. Statistics cover the mapped hail footprint inside the Census boundary of Wichita, KS, not the entire region. The place had 397,532 residents in the 2020 Census. A boundary intersection does not mean the whole community was hit. Estimated housing exposure: 27,684 units in 1-inch-or-larger bands, including 3,592 in 1.5-inch-or-larger bands and 0 in 2-inch-or-larger bands.

Affected states: Wichita area, KS
1.5+ inRadar size estimate 85,291Population Affected 38,010Houses Affected HailHazards FreeAccount signup
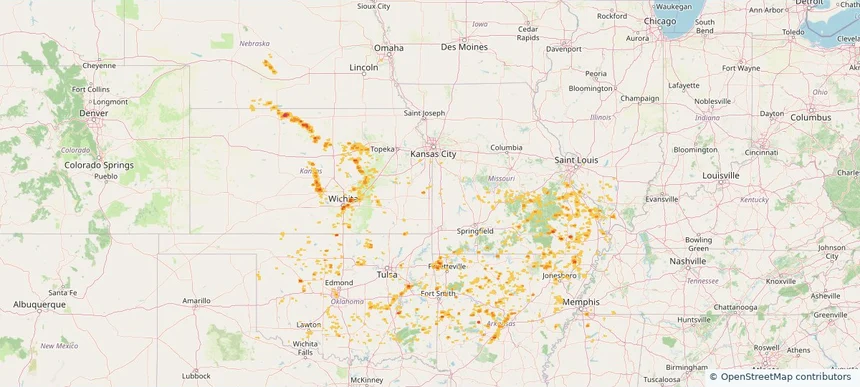
Houston, TX — August 18, 2025 — regional hail footprint preview
Storm footprint preview

Local hail summary for the Houston area: 10.98 square miles of estimated ground-hail footprint; highest mapped band 1.5+ inches. 1 official hail report(s) within the summary area. Exposure estimates are not confirmed property damage. Open the map to explore the full coverage included in your access. Statistics cover the mapped hail footprint inside the Census boundary of Houston, TX, not the entire region. The place had 2,304,580 residents in the 2020 Census. A boundary intersection does not mean the whole community was hit. Estimated housing exposure: 5,007 units in 1-inch-or-larger bands, including 1,866 in 1.5-inch-or-larger bands and 0 in 2-inch-or-larger bands.

Affected states: Houston area, TX
1.5+ inRadar size estimate 19,730Population Affected 9,036Houses Affected HailHazards FreeAccount signup
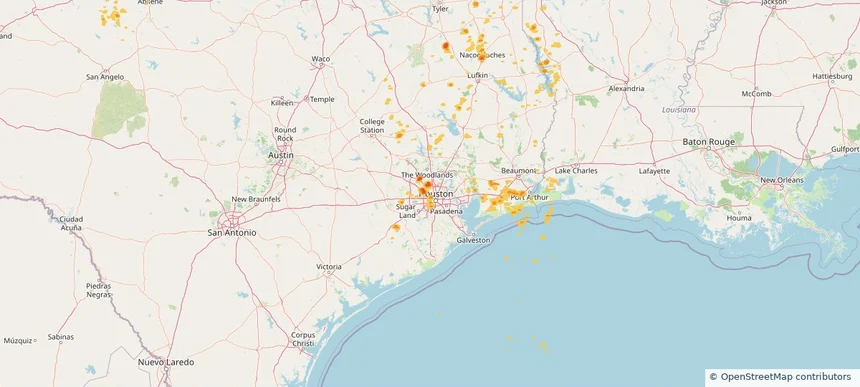
Nacogdoches, TX — August 18, 2025 — regional hail footprint preview
Storm footprint preview

Local hail summary for the Nacogdoches area: 12.69 square miles of estimated ground-hail footprint; highest mapped band 1+ inches. 0 official hail report(s) within the summary area. Exposure estimates are not confirmed property damage. Open the map to explore the full coverage included in your access. Statistics cover the mapped hail footprint inside the Census boundary of Nacogdoches, TX, not the entire region. The place had 32,147 residents in the 2020 Census. A boundary intersection does not mean the whole community was hit. Estimated housing exposure: 7,215 units in 1-inch-or-larger bands, including 0 in 1.5-inch-or-larger bands and 0 in 2-inch-or-larger bands.

Affected states: Nacogdoches area, TX
1+ inRadar size estimate 18,847Population Affected 8,423Houses Affected HailHazards FreeAccount signup
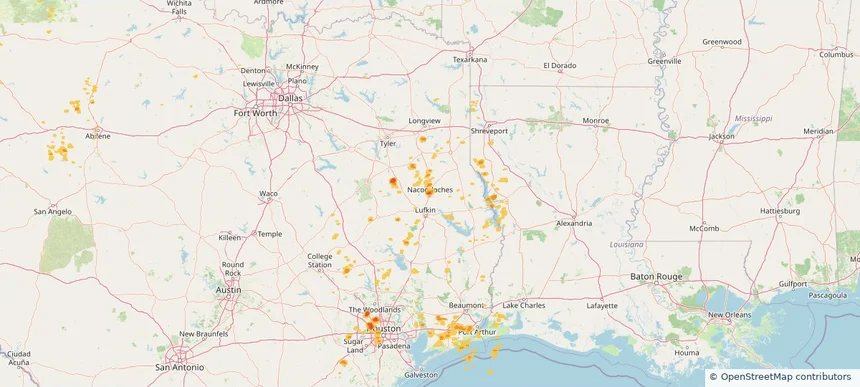
Rapid City, SD — August 18, 2025 — regional hail footprint preview
Storm footprint preview

Local hail summary for the Rapid City area: 1.07 square miles of estimated ground-hail footprint; highest mapped band 1+ inches. 0 official hail report(s) within the summary area. Exposure estimates are not confirmed property damage. Open the map to explore the full coverage included in your access. Statistics cover the mapped hail footprint inside the Census boundary of Rapid City, SD, not the entire region. The place had 74,703 residents in the 2020 Census. A boundary intersection does not mean the whole community was hit. Estimated housing exposure: 460 units in 1-inch-or-larger bands, including 0 in 1.5-inch-or-larger bands and 0 in 2-inch-or-larger bands.

Affected states: Rapid City area, SD
1+ inRadar size estimate 2,158Population Affected 775Houses Affected HailHazards FreeAccount signup
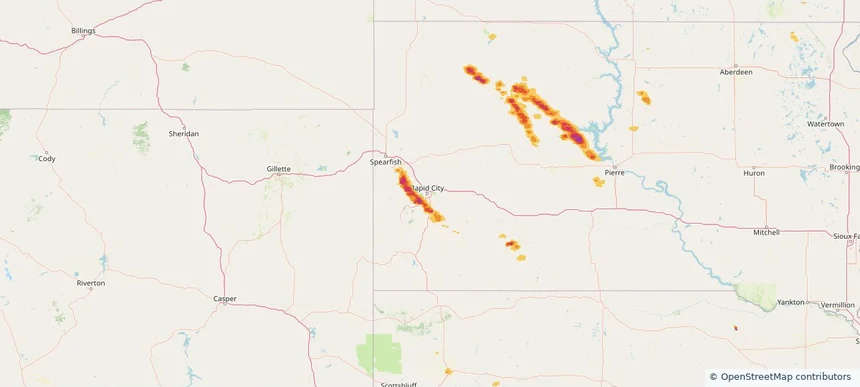
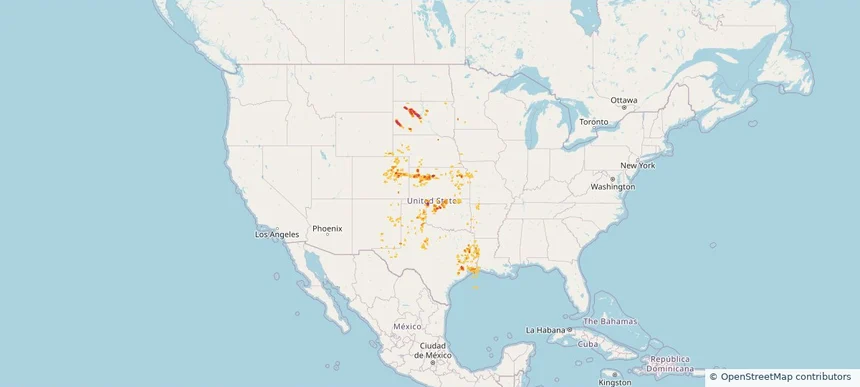
Historical Hail — 2025-08-18 — regional hail footprint preview
Storm footprint preview
Aug 18, 2025 7:00 AM to Aug 19, 2025 7:00 AM CST

Historical Hail — 2025-08-18

Hail as large as 1.75 inches was reported near Orr, TEXAS. Wind up to 100 mph was reported near Ks, KS. 5 tornadoes were reported, including one near San Miguel, NEW MEXICO. The storm had 4 official hail reports.

Affected states: National, AR, CO, KS, LA, MN, MO, NE, NM, OK, SD, TX, WY
3.0 inRadar size estimate 677,633Population Affected 292,389Houses Affected Hail · Wind · TornadoHazards FreeAccount signup
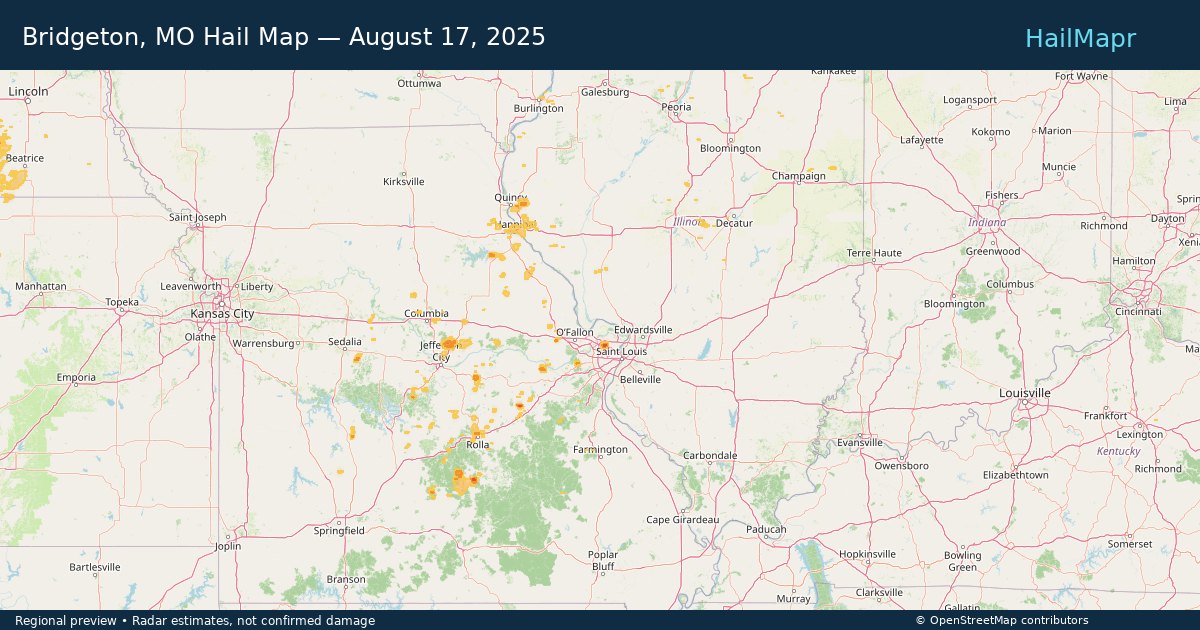
Bridgeton, MO — August 17, 2025 — regional hail footprint preview
Storm footprint preview

Local hail summary for the Bridgeton area: 1.66 square miles of estimated ground-hail footprint; highest mapped band 1.5+ inches. 0 official hail report(s) within the summary area. Exposure estimates are not confirmed property damage. Open the map to explore the full coverage included in your access. Statistics cover the mapped hail footprint inside the Census boundary of Bridgeton, MO, not the entire region. The place had 11,445 residents in the 2020 Census. A boundary intersection does not mean the whole community was hit. Estimated housing exposure: 390 units in 1-inch-or-larger bands, including 0 in 1.5-inch-or-larger bands and 0 in 2-inch-or-larger bands.

Affected states: Bridgeton area, MO
1.5+ inRadar size estimate 916Population Affected 426Houses Affected HailHazards FreeAccount signup
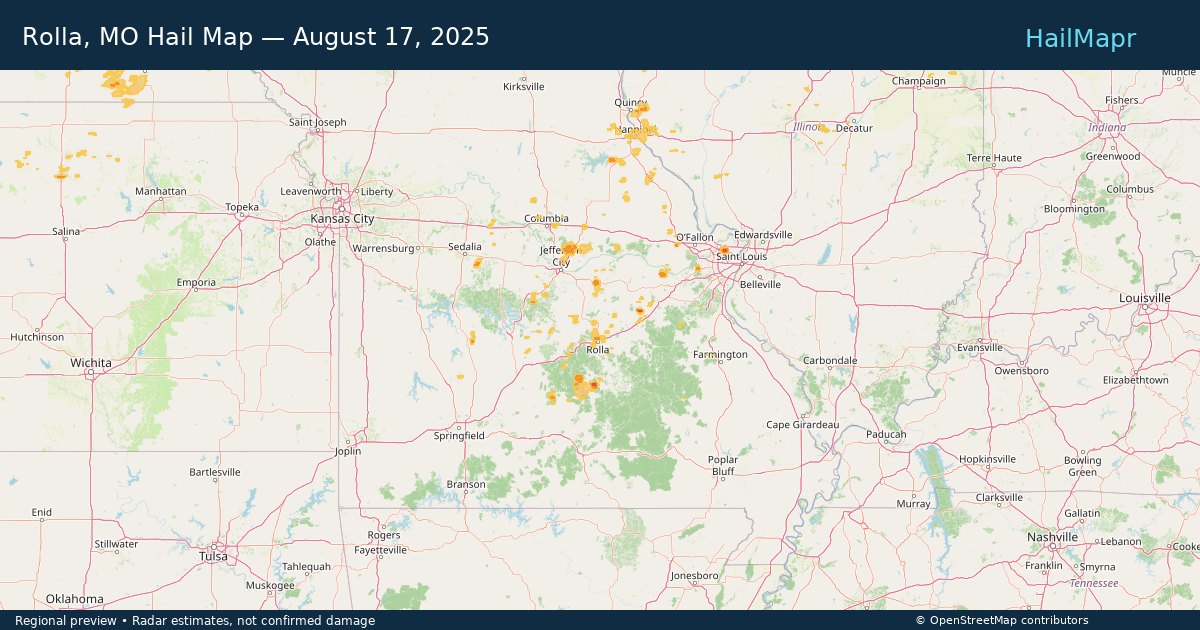
Rolla, MO — August 17, 2025 — regional hail footprint preview
Storm footprint preview

Local hail summary for the Rolla area: 0.20 square miles of estimated ground-hail footprint; highest mapped band 1+ inches. 0 official hail report(s) within the summary area. Exposure estimates are not confirmed property damage. Open the map to explore the full coverage included in your access. Statistics cover the mapped hail footprint inside the Census boundary of Rolla, MO, not the entire region. The place had 19,943 residents in the 2020 Census. A boundary intersection does not mean the whole community was hit. Estimated housing exposure: 217 units in 1-inch-or-larger bands, including 0 in 1.5-inch-or-larger bands and 0 in 2-inch-or-larger bands.

Affected states: Rolla area, MO
1+ inRadar size estimate 481Population Affected 222Houses Affected HailHazards FreeAccount signup
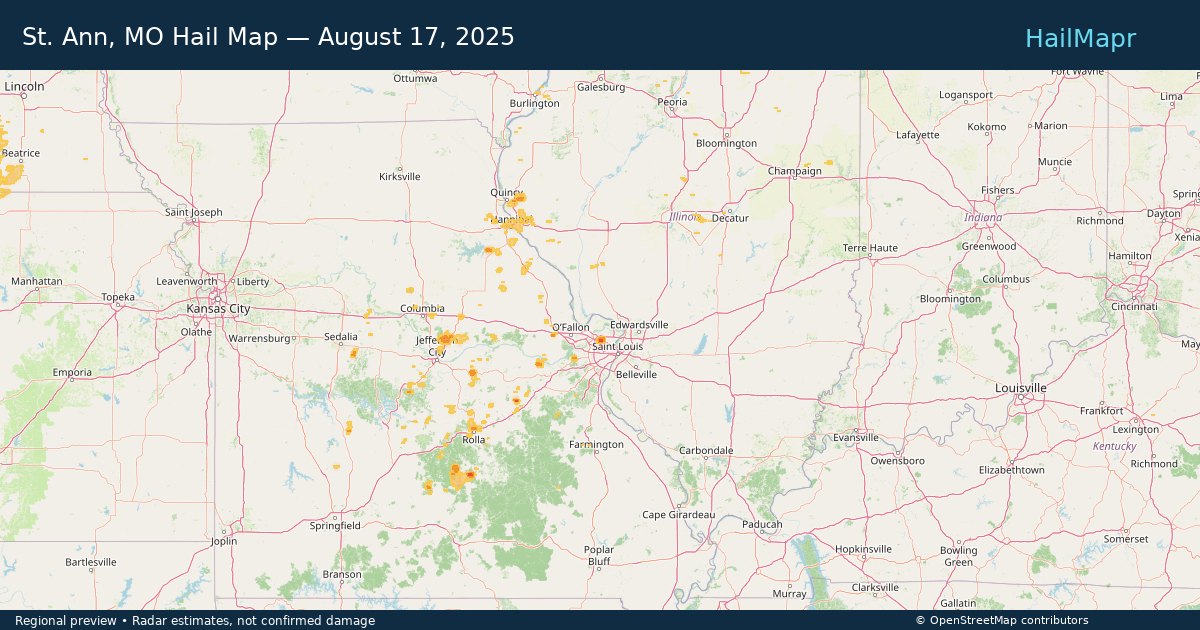
St. Ann, MO — August 17, 2025 — regional hail footprint preview
Storm footprint preview

Local hail summary for the St. Ann area: 2.03 square miles of estimated ground-hail footprint; highest mapped band 1.5+ inches. 0 official hail report(s) within the summary area. Exposure estimates are not confirmed property damage. Open the map to explore the full coverage included in your access. Statistics cover the mapped hail footprint inside the Census boundary of St. Ann, MO, not the entire region. The place had 13,019 residents in the 2020 Census. A boundary intersection does not mean the whole community was hit. Estimated housing exposure: 2,491 units in 1-inch-or-larger bands, including 1,453 in 1.5-inch-or-larger bands and 0 in 2-inch-or-larger bands.

Affected states: St. Ann area, MO
1.5+ inRadar size estimate 8,537Population Affected 4,516Houses Affected HailHazards FreeAccount signup
Historical Hail — 2025-08-17 — regional hail footprint preview
Storm footprint preview
Aug 17, 2025 7:00 AM to Aug 18, 2025 7:00 AM CST

Historical Hail — 2025-08-17

Hail as large as 1.75 inches was reported near Shelby, NEBRASKA. Wind up to 87 mph was reported near Macon, ILLINOIS. 8 tornadoes were reported, including one near Vermilion, ILLINOIS. The storm had 3 official hail reports.

Affected states: National, CO, IL, IA, KS, MD, MN, MO, MT, NE, ND, OH, PA, SD, VA, WV, WY
2.5 inRadar size estimate 170,075Population Affected 78,805Houses Affected Hail · Wind · TornadoHazards FreeAccount signup
Ann Arbor, MI — August 16, 2025 — regional hail footprint preview
Storm footprint preview

Local hail summary for the Ann Arbor area: 4.32 square miles of estimated ground-hail footprint; highest mapped band 1+ inches. 0 official hail report(s) within the summary area. Exposure estimates are not confirmed property damage. Open the map to explore the full coverage included in your access. Statistics cover the mapped hail footprint inside the Census boundary of Ann Arbor, MI, not the entire region. The place had 123,851 residents in the 2020 Census. A boundary intersection does not mean the whole community was hit. Estimated housing exposure: 102 units in 1-inch-or-larger bands, including 0 in 1.5-inch-or-larger bands and 0 in 2-inch-or-larger bands.

Affected states: Ann Arbor area, MI
1+ inRadar size estimate 14,664Population Affected 7,794Houses Affected HailHazards FreeAccount signup
Arlington Heights, IL — August 16, 2025 — regional hail footprint preview
Storm footprint preview

Local hail summary for the Arlington Heights area: 2.33 square miles of estimated ground-hail footprint; highest mapped band 1+ inches. 0 official hail report(s) within the summary area. Exposure estimates are not confirmed property damage. Open the map to explore the full coverage included in your access. Statistics cover the mapped hail footprint inside the Census boundary of Arlington Heights, IL, not the entire region. The place had 77,676 residents in the 2020 Census. A boundary intersection does not mean the whole community was hit. Estimated housing exposure: 5,736 units in 1-inch-or-larger bands, including 0 in 1.5-inch-or-larger bands and 0 in 2-inch-or-larger bands.

Affected states: Arlington Heights area, IL
1+ inRadar size estimate 12,041Population Affected 5,833Houses Affected HailHazards FreeAccount signup
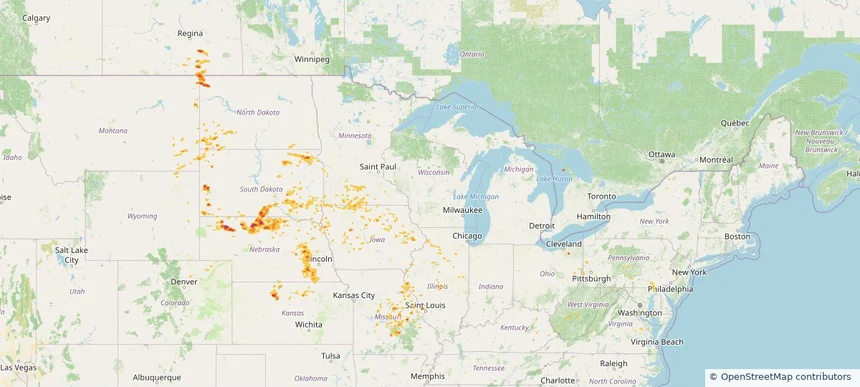
Aurora, IL — August 16, 2025 — regional hail footprint preview
Storm footprint preview

Local hail summary for the Aurora area: 0.66 square miles of estimated ground-hail footprint; highest mapped band 1+ inches. 0 official hail report(s) within the summary area. Exposure estimates are not confirmed property damage. Open the map to explore the full coverage included in your access. Statistics cover the mapped hail footprint inside the Census boundary of Aurora, IL, not the entire region. The place had 180,542 residents in the 2020 Census. A boundary intersection does not mean the whole community was hit. Estimated housing exposure: 357 units in 1-inch-or-larger bands, including 0 in 1.5-inch-or-larger bands and 0 in 2-inch-or-larger bands.

Affected states: Aurora area, IL
1+ inRadar size estimate 1,618Population Affected 773Houses Affected HailHazards FreeAccount signup
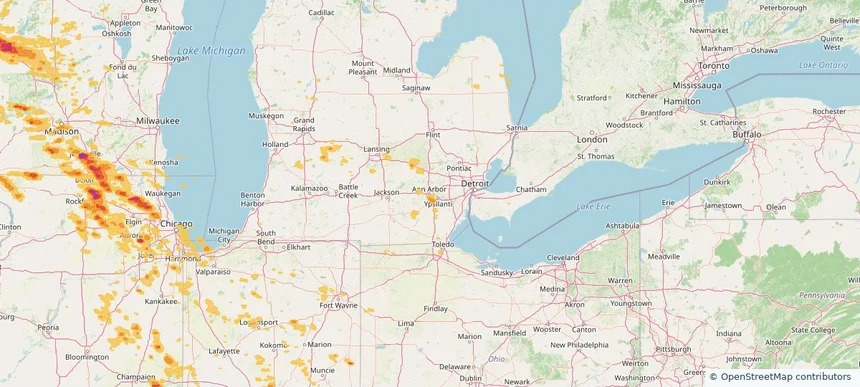
Barrington, IL — August 16, 2025 — regional hail footprint preview
Storm footprint preview

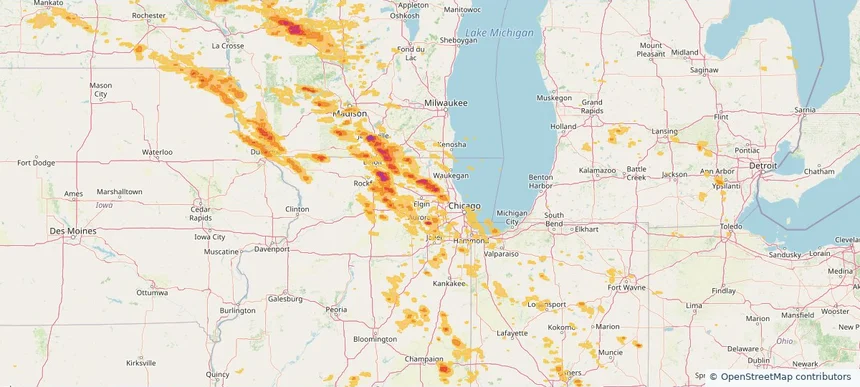
Local hail summary for the Barrington area: 4.80 square miles of estimated ground-hail footprint; highest mapped band 1.5+ inches. 0 official hail report(s) within the summary area. Exposure estimates are not confirmed property damage. Open the map to explore the full coverage included in your access. Statistics cover the mapped hail footprint inside the Census boundary of Barrington, IL, not the entire region. The place had 10,722 residents in the 2020 Census. A boundary intersection does not mean the whole community was hit. Estimated housing exposure: 4,394 units in 1-inch-or-larger bands, including 4,085 in 1.5-inch-or-larger bands and 0 in 2-inch-or-larger bands.

Affected states: Barrington area, IL
1.5+ inRadar size estimate 10,722Population Affected 4,394Houses Affected HailHazards FreeAccount signup
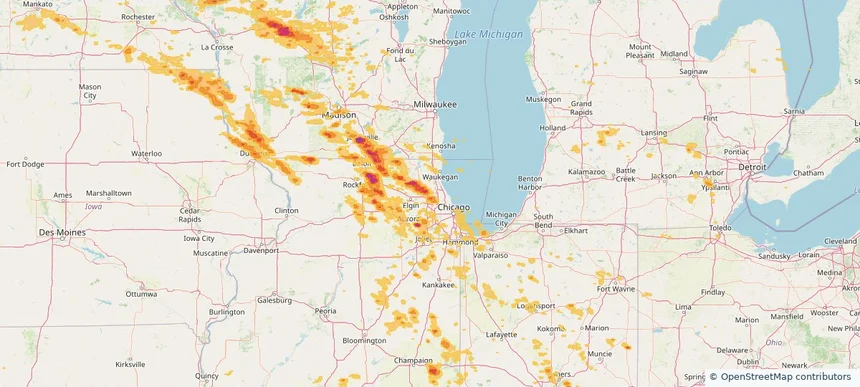
Belvidere, IL — August 16, 2025 — regional hail footprint preview
Storm footprint preview

Local hail summary for the Belvidere area: 10.91 square miles of estimated ground-hail footprint; highest mapped band 2.5+ inches. 0 official hail report(s) within the summary area. Exposure estimates are not confirmed property damage. Open the map to explore the full coverage included in your access. Statistics cover the mapped hail footprint inside the Census boundary of Belvidere, IL, not the entire region. The place had 25,339 residents in the 2020 Census. A boundary intersection does not mean the whole community was hit. Estimated housing exposure: 9,191 units in 1-inch-or-larger bands, including 9,034 in 1.5-inch-or-larger bands and 8,155 in 2-inch-or-larger bands.

Affected states: Belvidere area, IL
2.5+ inRadar size estimate 24,573Population Affected 9,270Houses Affected HailHazards FreeAccount signup
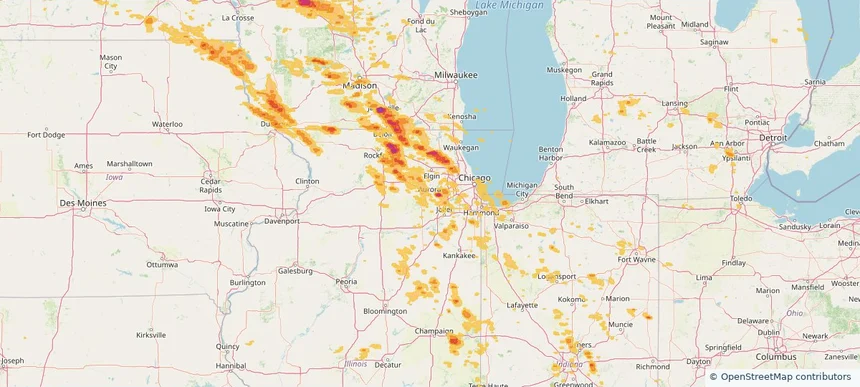
Cary, IL — August 16, 2025 — regional hail footprint preview
Storm footprint preview

Local hail summary for the Cary area: 6.31 square miles of estimated ground-hail footprint; highest mapped band 2+ inches. 0 official hail report(s) within the summary area. Exposure estimates are not confirmed property damage. Open the map to explore the full coverage included in your access. Statistics cover the mapped hail footprint inside the Census boundary of Cary, IL, not the entire region. The place had 17,826 residents in the 2020 Census. A boundary intersection does not mean the whole community was hit. Estimated housing exposure: 6,419 units in 1-inch-or-larger bands, including 5,642 in 1.5-inch-or-larger bands and 2,610 in 2-inch-or-larger bands.

Affected states: Cary area, IL
2+ inRadar size estimate 17,901Population Affected 6,545Houses Affected HailHazards FreeAccount signup
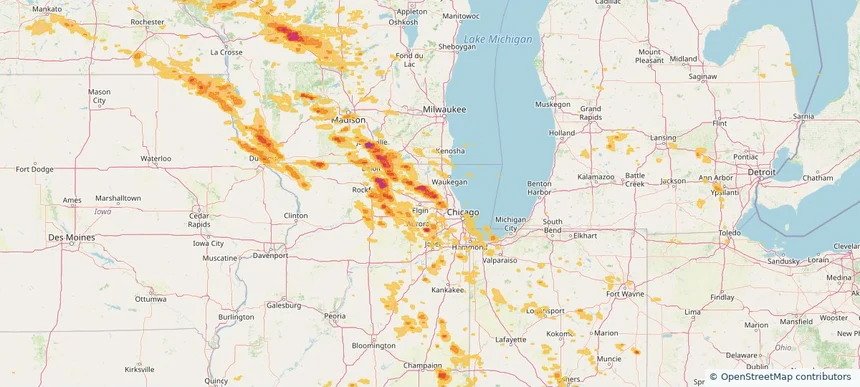
Crystal Lake, IL — August 16, 2025 — regional hail footprint preview
Storm footprint preview

Local hail summary for the Crystal Lake area: 11.09 square miles of estimated ground-hail footprint; highest mapped band 2+ inches. 0 official hail report(s) within the summary area. Exposure estimates are not confirmed property damage. Open the map to explore the full coverage included in your access. Statistics cover the mapped hail footprint inside the Census boundary of Crystal Lake, IL, not the entire region. The place had 40,269 residents in the 2020 Census. A boundary intersection does not mean the whole community was hit. Estimated housing exposure: 6,672 units in 1-inch-or-larger bands, including 4,324 in 1.5-inch-or-larger bands and 467 in 2-inch-or-larger bands.

Affected states: Crystal Lake area, IL
2+ inRadar size estimate 18,736Population Affected 7,650Houses Affected HailHazards FreeAccount signup
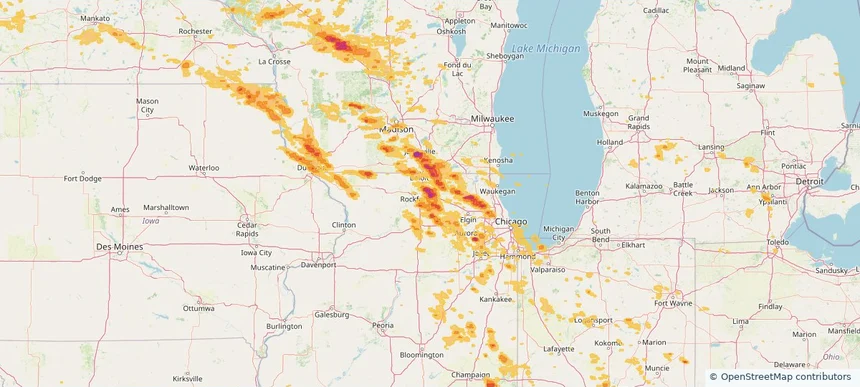
DeKalb, IL — August 16, 2025 — regional hail footprint preview
Storm footprint preview

Local hail summary for the DeKalb area: 10.36 square miles of estimated ground-hail footprint; highest mapped band 1+ inches. 0 official hail report(s) within the summary area. Exposure estimates are not confirmed property damage. Open the map to explore the full coverage included in your access. Statistics cover the mapped hail footprint inside the Census boundary of DeKalb, IL, not the entire region. The place had 40,290 residents in the 2020 Census. A boundary intersection does not mean the whole community was hit. Estimated housing exposure: 11,021 units in 1-inch-or-larger bands, including 0 in 1.5-inch-or-larger bands and 0 in 2-inch-or-larger bands.

Affected states: DeKalb area, IL
1+ inRadar size estimate 32,344Population Affected 13,400Houses Affected HailHazards FreeAccount signup
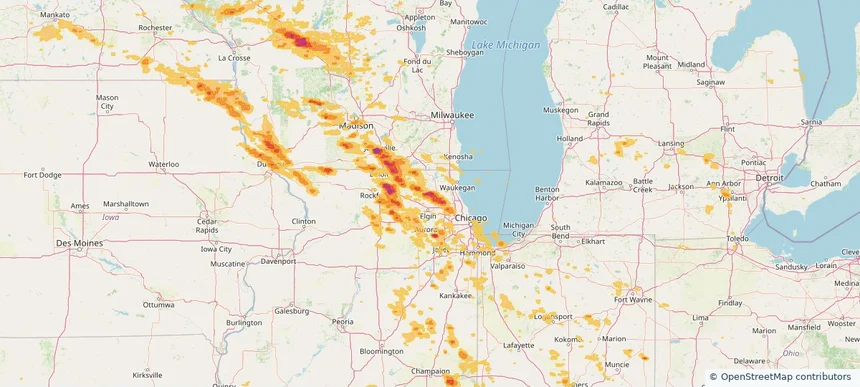
Des Plaines, IL — August 16, 2025 — regional hail footprint preview
Storm footprint preview

Local hail summary for the Des Plaines area: 6.72 square miles of estimated ground-hail footprint; highest mapped band 1+ inches. 0 official hail report(s) within the summary area. Exposure estimates are not confirmed property damage. Open the map to explore the full coverage included in your access. Statistics cover the mapped hail footprint inside the Census boundary of Des Plaines, IL, not the entire region. The place had 60,675 residents in the 2020 Census. A boundary intersection does not mean the whole community was hit. Estimated housing exposure: 8,078 units in 1-inch-or-larger bands, including 0 in 1.5-inch-or-larger bands and 0 in 2-inch-or-larger bands.

Affected states: Des Plaines area, IL
1+ inRadar size estimate 27,559Population Affected 10,718Houses Affected HailHazards FreeAccount signup
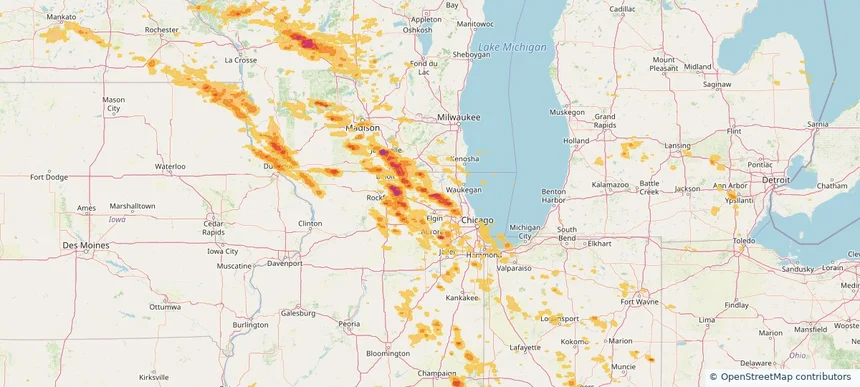
Downers Grove, IL — August 16, 2025 — regional hail footprint preview
Storm footprint preview

Local hail summary for the Downers Grove area: 1.53 square miles of estimated ground-hail footprint; highest mapped band 1+ inches. 0 official hail report(s) within the summary area. Exposure estimates are not confirmed property damage. Open the map to explore the full coverage included in your access. Statistics cover the mapped hail footprint inside the Census boundary of Downers Grove, IL, not the entire region. The place had 50,247 residents in the 2020 Census. A boundary intersection does not mean the whole community was hit. Estimated housing exposure: 1,470 units in 1-inch-or-larger bands, including 0 in 1.5-inch-or-larger bands and 0 in 2-inch-or-larger bands.

Affected states: Downers Grove area, IL
1+ inRadar size estimate 4,582Population Affected 2,606Houses Affected HailHazards FreeAccount signup
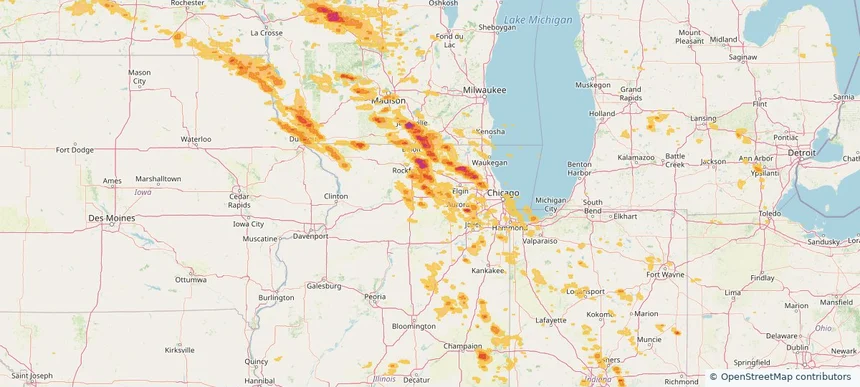
Dubuque, IA — August 16, 2025 — regional hail footprint preview
Storm footprint preview

Local hail summary for the Dubuque area: 5.55 square miles of estimated ground-hail footprint; highest mapped band 1.5+ inches. 0 official hail report(s) within the summary area. Exposure estimates are not confirmed property damage. Open the map to explore the full coverage included in your access. Statistics cover the mapped hail footprint inside the Census boundary of Dubuque, IA, not the entire region. The place had 59,667 residents in the 2020 Census. A boundary intersection does not mean the whole community was hit. Estimated housing exposure: 2,121 units in 1-inch-or-larger bands, including 68 in 1.5-inch-or-larger bands and 0 in 2-inch-or-larger bands.

Affected states: Dubuque area, IA
1.5+ inRadar size estimate 9,199Population Affected 4,064Houses Affected HailHazards FreeAccount signup
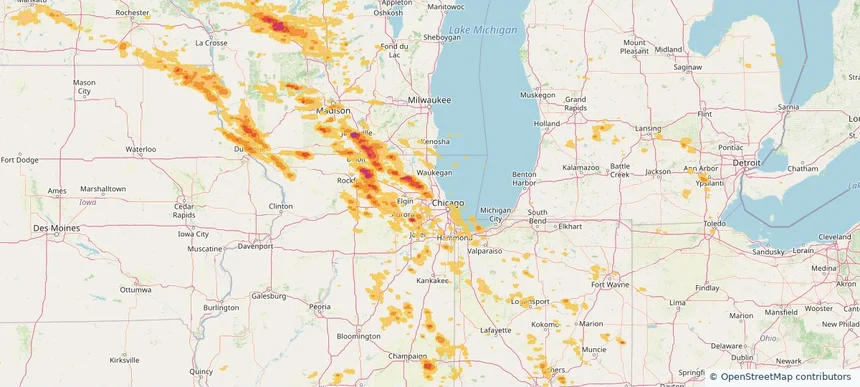
Greenfield, IN — August 16, 2025 — regional hail footprint preview
Storm footprint preview

Local hail summary for the Greenfield area: 1.28 square miles of estimated ground-hail footprint; highest mapped band 1.5+ inches. 0 official hail report(s) within the summary area. Exposure estimates are not confirmed property damage. Open the map to explore the full coverage included in your access. Statistics cover the mapped hail footprint inside the Census boundary of Greenfield, IN, not the entire region. The place had 23,488 residents in the 2020 Census. A boundary intersection does not mean the whole community was hit. Estimated housing exposure: 174 units in 1-inch-or-larger bands, including 0 in 1.5-inch-or-larger bands and 0 in 2-inch-or-larger bands.

Affected states: Greenfield area, IN
1.5+ inRadar size estimate 704Population Affected 328Houses Affected HailHazards FreeAccount signup
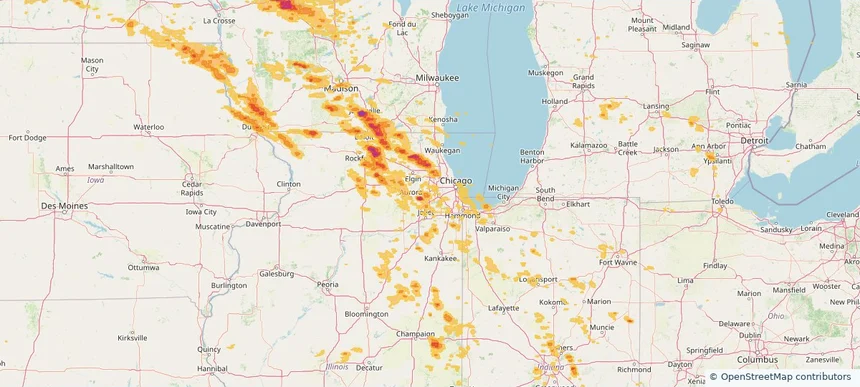
Hoffman Estates, IL — August 16, 2025 — regional hail footprint preview
Storm footprint preview

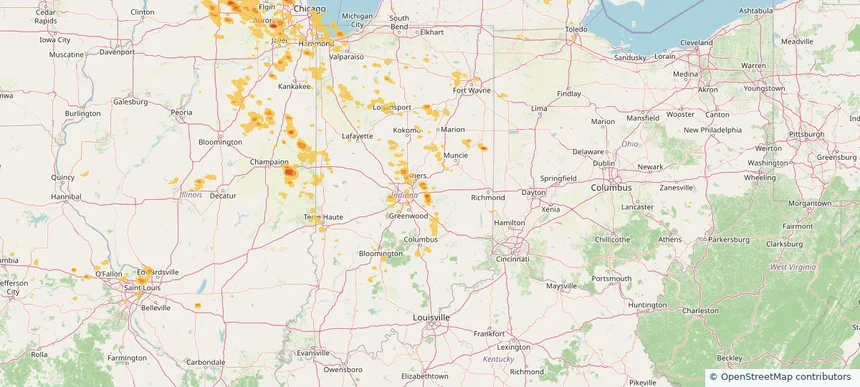
Local hail summary for the Hoffman Estates area: 1.04 square miles of estimated ground-hail footprint; highest mapped band 1+ inches. 0 official hail report(s) within the summary area. Exposure estimates are not confirmed property damage. Open the map to explore the full coverage included in your access. Statistics cover the mapped hail footprint inside the Census boundary of Hoffman Estates, IL, not the entire region. The place had 52,530 residents in the 2020 Census. A boundary intersection does not mean the whole community was hit. Estimated housing exposure: 1,490 units in 1-inch-or-larger bands, including 0 in 1.5-inch-or-larger bands and 0 in 2-inch-or-larger bands.

Affected states: Hoffman Estates area, IL
1+ inRadar size estimate 6,133Population Affected 2,166Houses Affected HailHazards FreeAccount signup
Page 69 of 101
‹ 1 68 69 70 101 ›

Frequently asked questions

Can I search hail maps by coverage area?

Yes. The storm library supports coverage-area filtering so you can find hail maps and hail swaths in a target service area.

What kinds of storms appear in the HailMapr library?

The library focuses on published hail events, including ready storm maps and live storms once hail has been detected and a public swath is available.

Are HailMapr storm pages useful for roofers and adjusters?

Yes. They are built to help roofers, adjusters, restoration teams, and property owners review storm footprints before purchase.