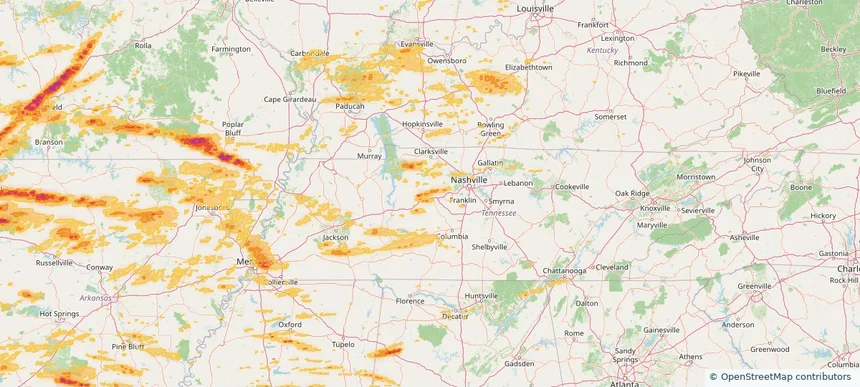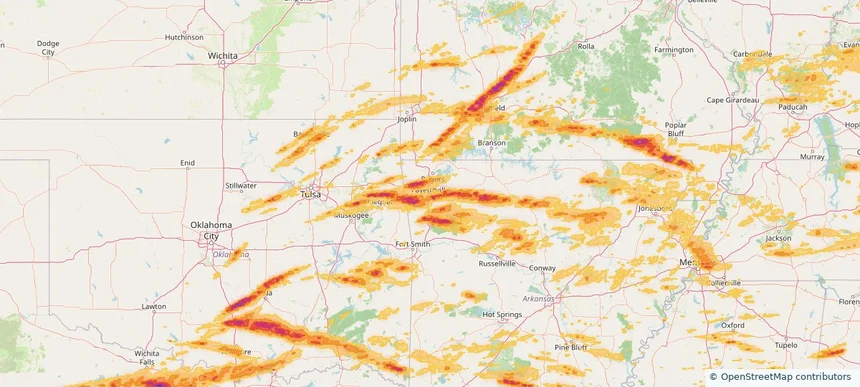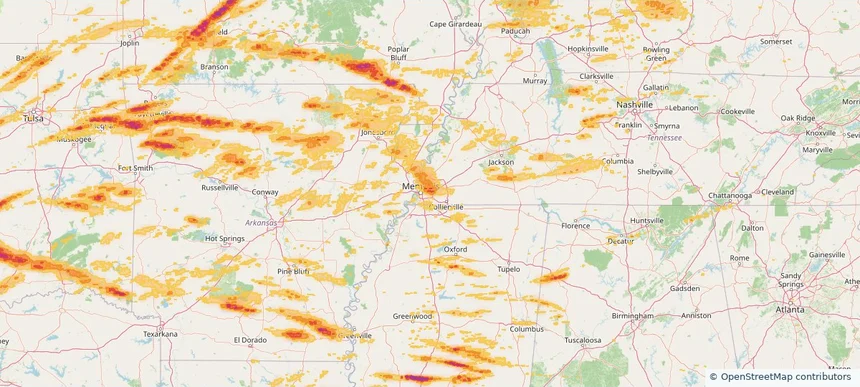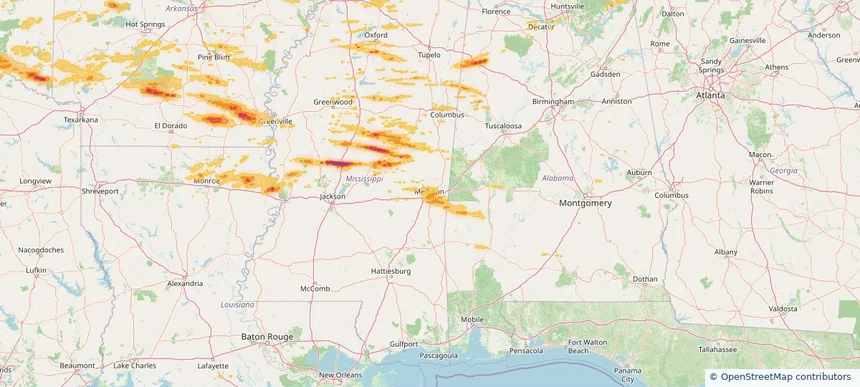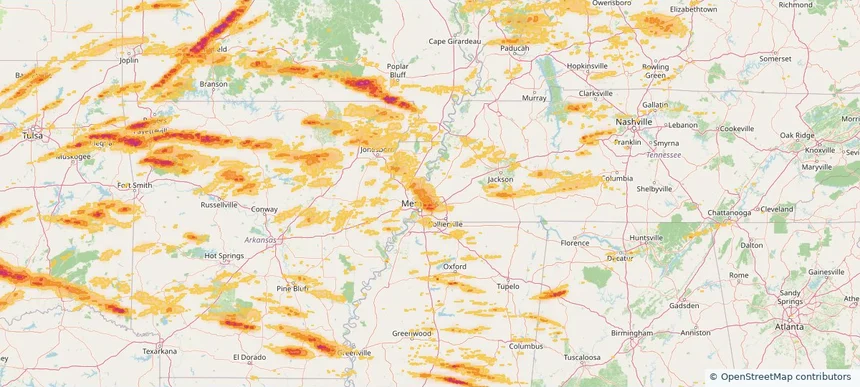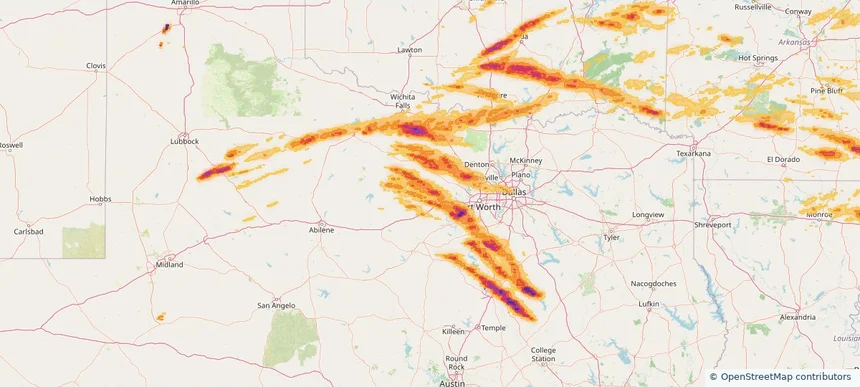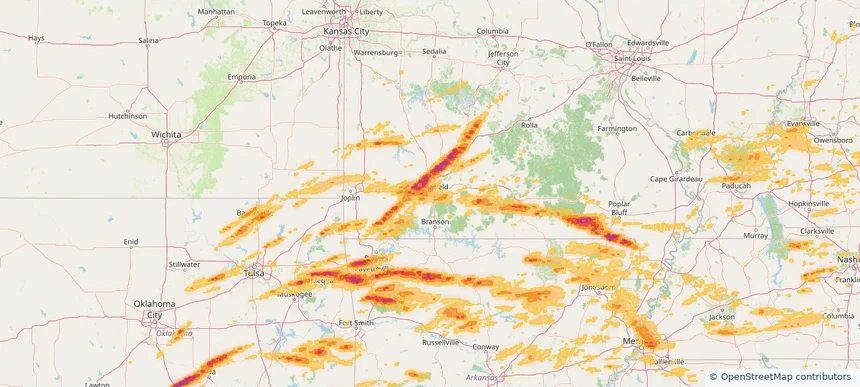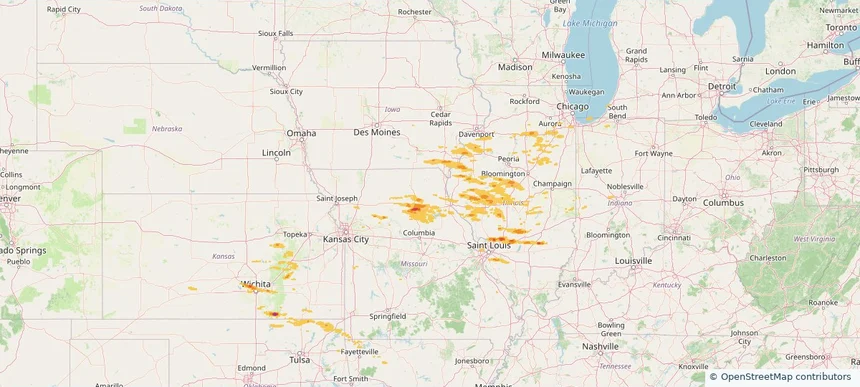
Historical Hail — 2026-05-04
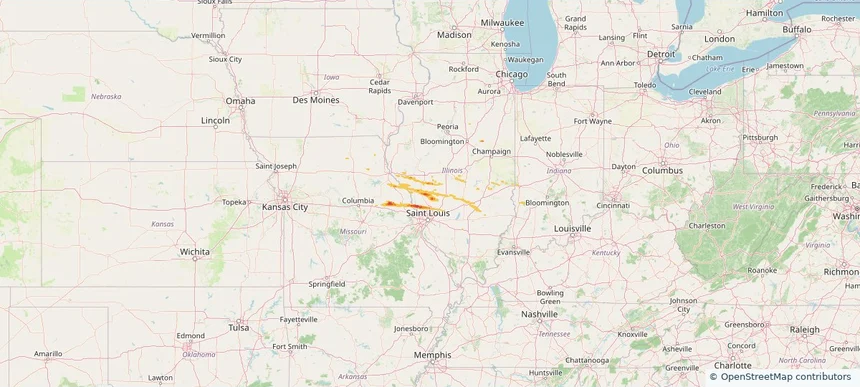
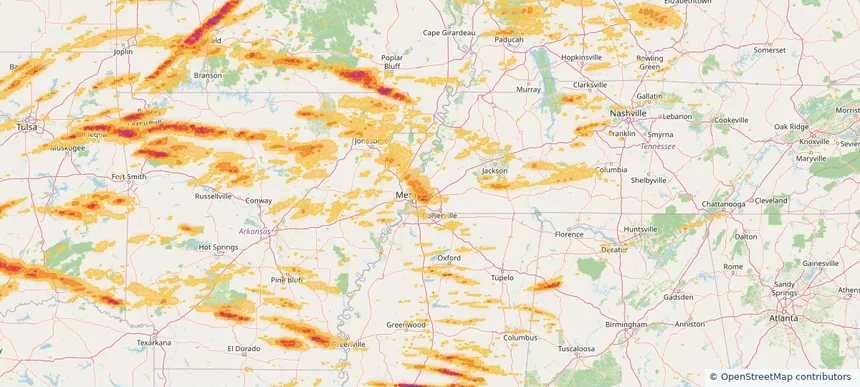
Hail as large as 1.75 inches was reported near Greenville, ILLINOIS. Wind up to 81 mph was reported near 2 miles west of Cambridge, IL. The storm had 13 official hail reports.
Review storm footprints, hail swaths, reports, and replay access. Create a free account to save your setup and move into map access when a storm matters.

Hail as large as 1.75 inches was reported near Greenville, ILLINOIS. Wind up to 81 mph was reported near 2 miles west of Cambridge, IL. The storm had 13 official hail reports.

Hail as large as 1.75 inches was reported near Troy, MISSOURI. The storm had 7 official hail reports.

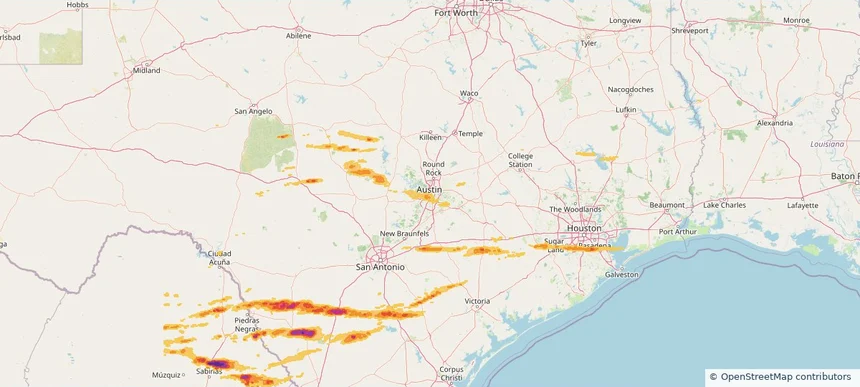
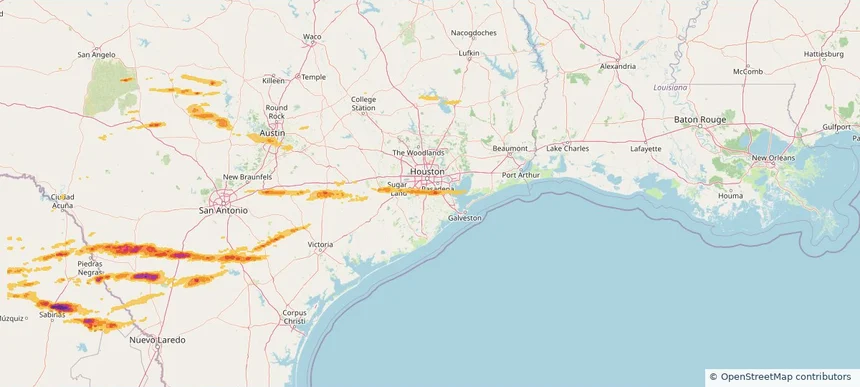
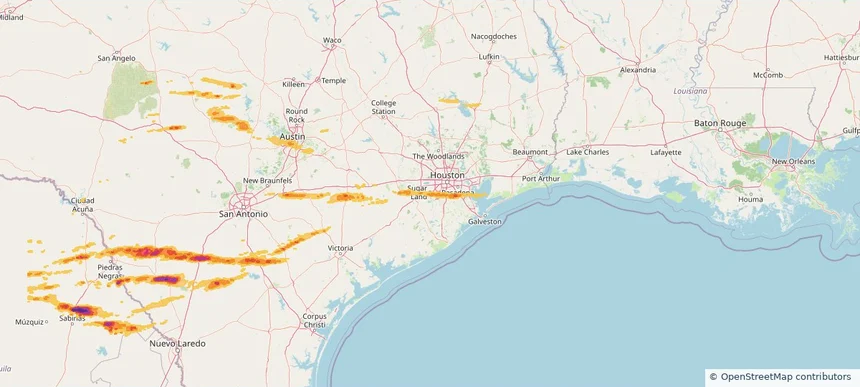
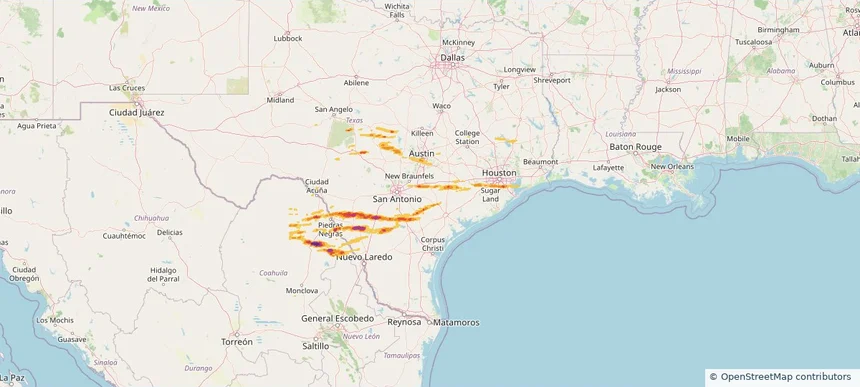
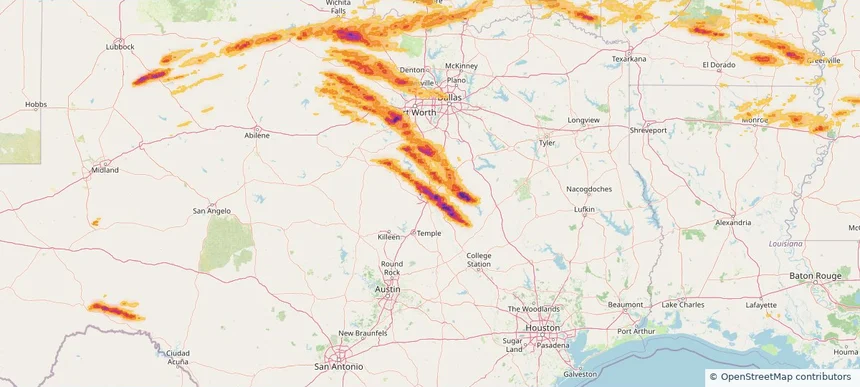
Local hail summary for the Austin area: 4.89 square miles of estimated ground-hail footprint; highest mapped band 1+ inches. 0 official hail report(s) within the summary area. Exposure estimates are not confirmed property damage. Open the map to explore the full coverage included in your access. Statistics cover the mapped hail footprint inside the Census boundary of Austin, TX, not the entire region. The place had 961,855 residents in the 2020 Census. A boundary intersection does not mean the whole community was hit. Estimated housing exposure: 3,138 units in 1-inch-or-larger bands, including 0 in 1.5-inch-or-larger bands and 0 in 2-inch-or-larger bands.

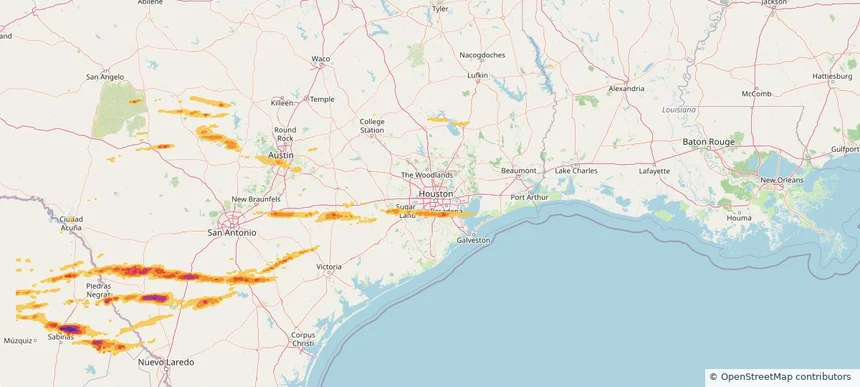
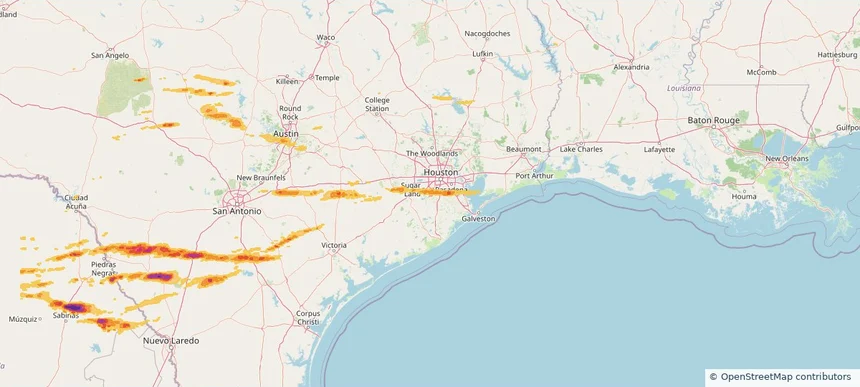
Local hail summary for the Houston area: 5.56 square miles of estimated ground-hail footprint; highest mapped band 1+ inches. 1 official hail report(s) within the summary area. Exposure estimates are not confirmed property damage. Open the map to explore the full coverage included in your access. Statistics cover the mapped hail footprint inside the Census boundary of Houston, TX, not the entire region. The place had 2,304,580 residents in the 2020 Census. A boundary intersection does not mean the whole community was hit. Estimated housing exposure: 484 units in 1-inch-or-larger bands, including 0 in 1.5-inch-or-larger bands and 0 in 2-inch-or-larger bands.

Local hail summary for the Missouri City area: 2.14 square miles of estimated ground-hail footprint; highest mapped band 1+ inches. 0 official hail report(s) within the summary area. Exposure estimates are not confirmed property damage. Open the map to explore the full coverage included in your access. Statistics cover the mapped hail footprint inside the Census boundary of Missouri City, TX, not the entire region. The place had 74,259 residents in the 2020 Census. A boundary intersection does not mean the whole community was hit. Estimated housing exposure: 421 units in 1-inch-or-larger bands, including 0 in 1.5-inch-or-larger bands and 0 in 2-inch-or-larger bands.

Local hail summary for the Pearland area: 14.76 square miles of estimated ground-hail footprint; highest mapped band 1+ inches. 1 official hail report(s) within the summary area. Exposure estimates are not confirmed property damage. Open the map to explore the full coverage included in your access. Statistics cover the mapped hail footprint inside the Census boundary of Pearland, TX, not the entire region. The place had 125,828 residents in the 2020 Census. A boundary intersection does not mean the whole community was hit. Estimated housing exposure: 13,969 units in 1-inch-or-larger bands, including 0 in 1.5-inch-or-larger bands and 0 in 2-inch-or-larger bands.

Local hail summary for the Sugar Land area: 0.80 square miles of estimated ground-hail footprint; highest mapped band 1+ inches. 0 official hail report(s) within the summary area. Exposure estimates are not confirmed property damage. Open the map to explore the full coverage included in your access. Statistics cover the mapped hail footprint inside the Census boundary of Sugar Land, TX, not the entire region. The place had 111,026 residents in the 2020 Census. A boundary intersection does not mean the whole community was hit. Estimated housing exposure: 257 units in 1-inch-or-larger bands, including 0 in 1.5-inch-or-larger bands and 0 in 2-inch-or-larger bands.

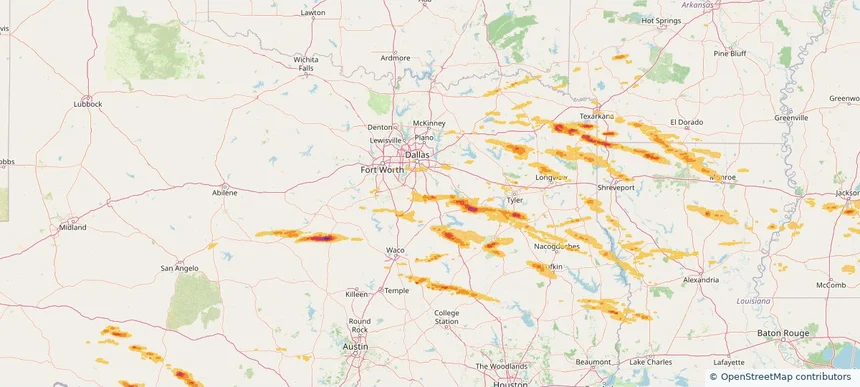
Hail as large as 1.50 inches was reported near Kinkler, TEXAS. The storm had 5 official hail reports.

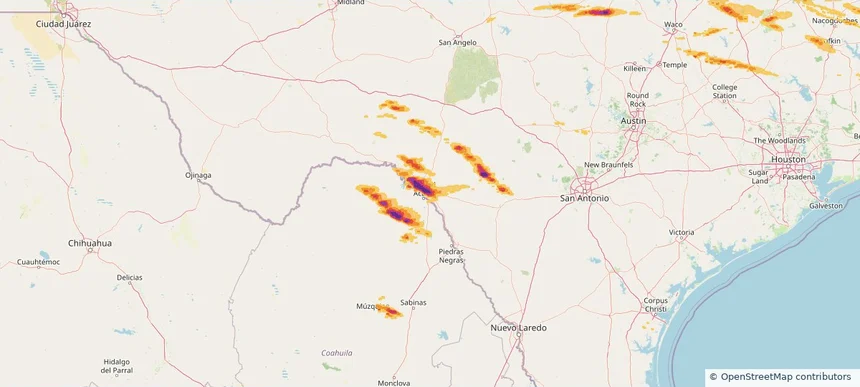
Local hail summary for the Del Rio area: 18.90 square miles of estimated ground-hail footprint; highest mapped band 2.5+ inches. 0 official hail report(s) within the summary area. Exposure estimates are not confirmed property damage. Open the map to explore the full coverage included in your access. Statistics cover the mapped hail footprint inside the Census boundary of Del Rio, TX, not the entire region. The place had 34,673 residents in the 2020 Census. A boundary intersection does not mean the whole community was hit. Estimated housing exposure: 11,807 units in 1-inch-or-larger bands, including 10,870 in 1.5-inch-or-larger bands and 7,788 in 2-inch-or-larger bands.

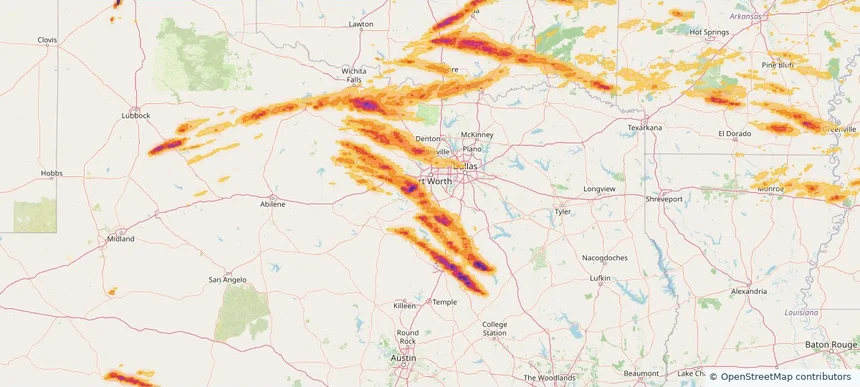
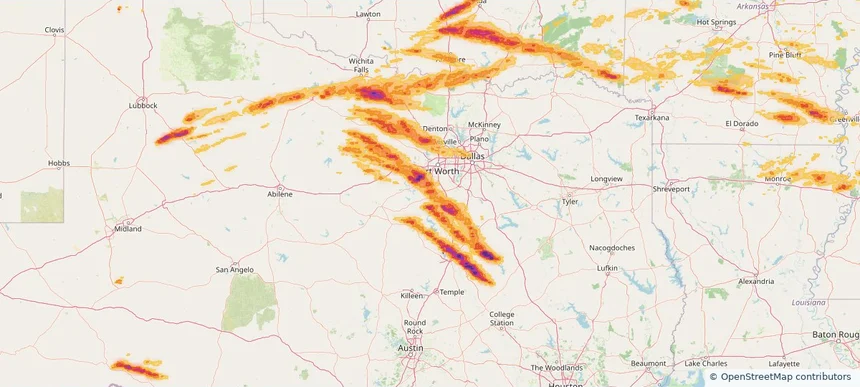
Local hail summary for the Ennis area: 9.64 square miles of estimated ground-hail footprint; highest mapped band 1.5+ inches. 1 official hail report(s) within the summary area. Exposure estimates are not confirmed property damage. Open the map to explore the full coverage included in your access. Statistics cover the mapped hail footprint inside the Census boundary of Ennis, TX, not the entire region. The place had 20,159 residents in the 2020 Census. A boundary intersection does not mean the whole community was hit. Estimated housing exposure: 620 units in 1-inch-or-larger bands, including 3 in 1.5-inch-or-larger bands and 0 in 2-inch-or-larger bands.

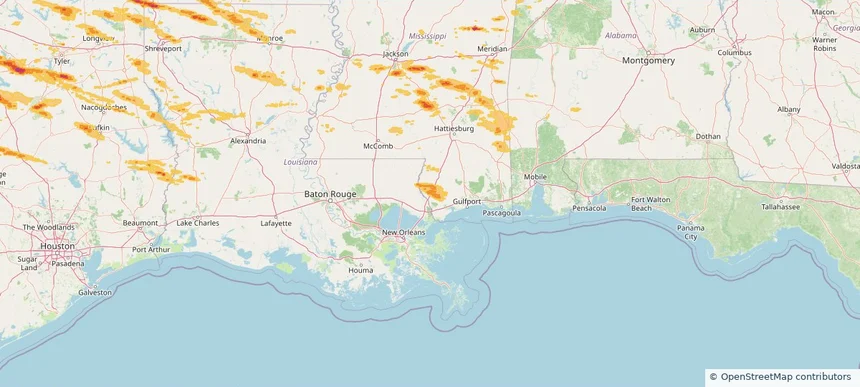
Local hail summary for the Picayune area: 2.67 square miles of estimated ground-hail footprint; highest mapped band 1+ inches. 0 official hail report(s) within the summary area. Exposure estimates are not confirmed property damage. Open the map to explore the full coverage included in your access. Statistics cover the mapped hail footprint inside the Census boundary of Picayune, MS, not the entire region. The place had 11,885 residents in the 2020 Census. A boundary intersection does not mean the whole community was hit. Estimated housing exposure: 162 units in 1-inch-or-larger bands, including 0 in 1.5-inch-or-larger bands and 0 in 2-inch-or-larger bands.

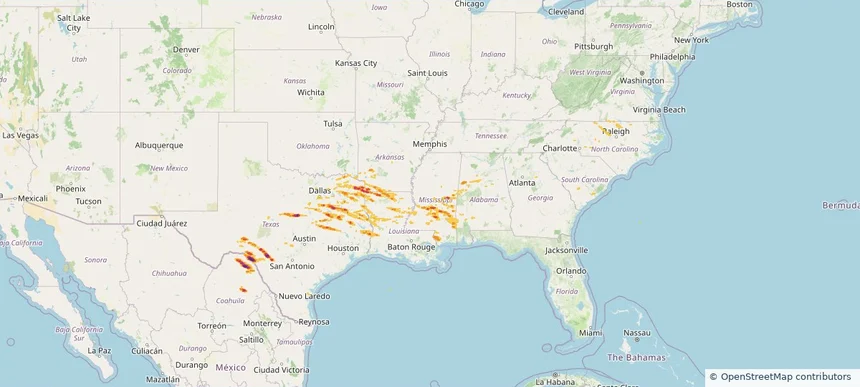
Hail as large as 5.00 inches was reported near Camp Wood, TEXAS. Wind up to 92 mph was reported near 4 miles north-northeast of Sharon, MS. 2 tornadoes were reported, including one near 3 miles northeast of Fayetteville, WV. The storm had 16 official hail reports.

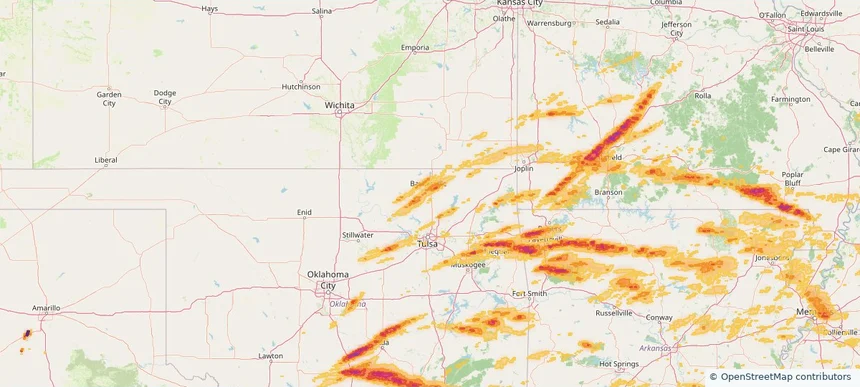
Local hail summary for the Bartlesville area: 11.46 square miles of estimated ground-hail footprint; highest mapped band 1+ inches. 0 official hail report(s) within the summary area. Exposure estimates are not confirmed property damage. Open the map to explore the full coverage included in your access. Statistics cover the mapped hail footprint inside the Census boundary of Bartlesville, OK, not the entire region. The place had 37,290 residents in the 2020 Census. A boundary intersection does not mean the whole community was hit. Estimated housing exposure: 1,406 units in 1-inch-or-larger bands, including 0 in 1.5-inch-or-larger bands and 0 in 2-inch-or-larger bands.

Local hail summary for the Bartlett area: 20.92 square miles of estimated ground-hail footprint; highest mapped band 1+ inches. 0 official hail report(s) within the summary area. Exposure estimates are not confirmed property damage. Open the map to explore the full coverage included in your access. Statistics cover the mapped hail footprint inside the Census boundary of Bartlett, TN, not the entire region. The place had 57,786 residents in the 2020 Census. A boundary intersection does not mean the whole community was hit. Estimated housing exposure: 7,592 units in 1-inch-or-larger bands, including 0 in 1.5-inch-or-larger bands and 0 in 2-inch-or-larger bands.

Local hail summary for the Bellmead area: 6.95 square miles of estimated ground-hail footprint; highest mapped band 2.5+ inches. 0 official hail report(s) within the summary area. Exposure estimates are not confirmed property damage. Open the map to explore the full coverage included in your access. Statistics cover the mapped hail footprint inside the Census boundary of Bellmead, TX, not the entire region. The place had 10,494 residents in the 2020 Census. A boundary intersection does not mean the whole community was hit. Estimated housing exposure: 3,969 units in 1-inch-or-larger bands, including 3,960 in 1.5-inch-or-larger bands and 3,018 in 2-inch-or-larger bands.

Local hail summary for the Burleson area: 2.37 square miles of estimated ground-hail footprint; highest mapped band 1+ inches. 0 official hail report(s) within the summary area. Exposure estimates are not confirmed property damage. Open the map to explore the full coverage included in your access. Statistics cover the mapped hail footprint inside the Census boundary of Burleson, TX, not the entire region. The place had 47,641 residents in the 2020 Census. A boundary intersection does not mean the whole community was hit. Estimated housing exposure: 167 units in 1-inch-or-larger bands, including 0 in 1.5-inch-or-larger bands and 0 in 2-inch-or-larger bands.

Local hail summary for the Cleburne area: 33.88 square miles of estimated ground-hail footprint; highest mapped band 1.5+ inches. 2 official hail report(s) within the summary area. Exposure estimates are not confirmed property damage. Open the map to explore the full coverage included in your access. Statistics cover the mapped hail footprint inside the Census boundary of Cleburne, TX, not the entire region. The place had 31,352 residents in the 2020 Census. A boundary intersection does not mean the whole community was hit. Estimated housing exposure: 11,570 units in 1-inch-or-larger bands, including 761 in 1.5-inch-or-larger bands and 0 in 2-inch-or-larger bands.

Local hail summary for the Dickson area: 4.51 square miles of estimated ground-hail footprint; highest mapped band 1+ inches. 0 official hail report(s) within the summary area. Exposure estimates are not confirmed property damage. Open the map to explore the full coverage included in your access. Statistics cover the mapped hail footprint inside the Census boundary of Dickson, TN, not the entire region. The place had 16,058 residents in the 2020 Census. A boundary intersection does not mean the whole community was hit. Estimated housing exposure: 385 units in 1-inch-or-larger bands, including 0 in 1.5-inch-or-larger bands and 0 in 2-inch-or-larger bands.

Local hail summary for the Fayetteville area: 8.32 square miles of estimated ground-hail footprint; highest mapped band 1.5+ inches. 1 official hail report(s) within the summary area. Exposure estimates are not confirmed property damage. Open the map to explore the full coverage included in your access. Statistics cover the mapped hail footprint inside the Census boundary of Fayetteville, AR, not the entire region. The place had 93,949 residents in the 2020 Census. A boundary intersection does not mean the whole community was hit. Estimated housing exposure: 823 units in 1-inch-or-larger bands, including 0 in 1.5-inch-or-larger bands and 0 in 2-inch-or-larger bands.

Local hail summary for the Memphis area: 69.63 square miles of estimated ground-hail footprint; highest mapped band 1.5+ inches. 0 official hail report(s) within the summary area. Exposure estimates are not confirmed property damage. Open the map to explore the full coverage included in your access. Statistics cover the mapped hail footprint inside the Census boundary of Memphis, TN, not the entire region. The place had 633,104 residents in the 2020 Census. A boundary intersection does not mean the whole community was hit. Estimated housing exposure: 54,759 units in 1-inch-or-larger bands, including 6,267 in 1.5-inch-or-larger bands and 0 in 2-inch-or-larger bands.

Local hail summary for the Meridian area: 24.60 square miles of estimated ground-hail footprint; highest mapped band 1+ inches. 0 official hail report(s) within the summary area. Exposure estimates are not confirmed property damage. Open the map to explore the full coverage included in your access. Statistics cover the mapped hail footprint inside the Census boundary of Meridian, MS, not the entire region. The place had 35,052 residents in the 2020 Census. A boundary intersection does not mean the whole community was hit. Estimated housing exposure: 2,396 units in 1-inch-or-larger bands, including 0 in 1.5-inch-or-larger bands and 0 in 2-inch-or-larger bands.

Local hail summary for the Millington area: 12.01 square miles of estimated ground-hail footprint; highest mapped band 1+ inches. 0 official hail report(s) within the summary area. Exposure estimates are not confirmed property damage. Open the map to explore the full coverage included in your access. Statistics cover the mapped hail footprint inside the Census boundary of Millington, TN, not the entire region. The place had 10,582 residents in the 2020 Census. A boundary intersection does not mean the whole community was hit. Estimated housing exposure: 602 units in 1-inch-or-larger bands, including 0 in 1.5-inch-or-larger bands and 0 in 2-inch-or-larger bands.

Local hail summary for the Mineral Wells area: 13.97 square miles of estimated ground-hail footprint; highest mapped band 2+ inches. 0 official hail report(s) within the summary area. Exposure estimates are not confirmed property damage. Open the map to explore the full coverage included in your access. Statistics cover the mapped hail footprint inside the Census boundary of Mineral Wells, TX, not the entire region. The place had 14,820 residents in the 2020 Census. A boundary intersection does not mean the whole community was hit. Estimated housing exposure: 485 units in 1-inch-or-larger bands, including 8 in 1.5-inch-or-larger bands and 0 in 2-inch-or-larger bands.

Local hail summary for the Nixa area: 6.51 square miles of estimated ground-hail footprint; highest mapped band 1+ inches. 1 official hail report(s) within the summary area. Exposure estimates are not confirmed property damage. Open the map to explore the full coverage included in your access. Statistics cover the mapped hail footprint inside the Census boundary of Nixa, MO, not the entire region. The place had 23,257 residents in the 2020 Census. A boundary intersection does not mean the whole community was hit. Estimated housing exposure: 548 units in 1-inch-or-larger bands, including 0 in 1.5-inch-or-larger bands and 0 in 2-inch-or-larger bands.
Yes. The storm library supports coverage-area filtering so you can find hail maps and hail swaths in a target service area.
The library focuses on published hail events, including ready storm maps and live storms once hail has been detected and a public swath is available.
Yes. They are built to help roofers, adjusters, restoration teams, and property owners review storm footprints before purchase.