
Storm library

Browse live and recent hail maps.

Review storm footprints, hail swaths, reports, and replay access. Create a free account to save your setup and move into map access when a storm matters.

Search filters
Clear
Newest storms first by default.
Don't see your storm? Request a qualifying storm map and we'll email you when it is ready.
Showing 2113-2136 of 2370 storms · Page 89 of 99
‹ 1 88 89 90 99 ›
Request a storm map

Tell us about the storm and we'll build the map. Once it's published you'll get an email and can purchase it from the library — just like any other event.

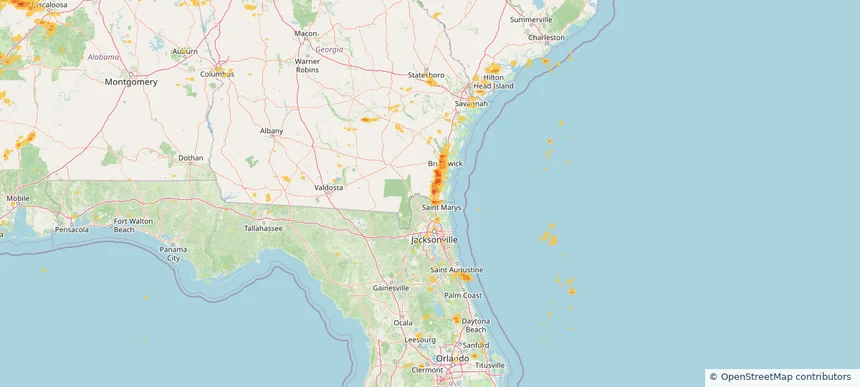
Kingsland, GA — May 25, 2025 — regional hail footprint preview
Storm footprint preview

Local hail summary for the Kingsland area: 9.23 square miles of estimated ground-hail footprint; highest mapped band 1.5+ inches. 0 official hail report(s) within the summary area. Exposure estimates are not confirmed property damage. Open the map to explore the full coverage included in your access. Statistics cover the mapped hail footprint inside the Census boundary of Kingsland, GA, not the entire region. The place had 18,337 residents in the 2020 Census. A boundary intersection does not mean the whole community was hit. Estimated housing exposure: 251 units in 1-inch-or-larger bands, including 3 in 1.5-inch-or-larger bands and 0 in 2-inch-or-larger bands.

Affected states: Kingsland area, GA
1.5+ inRadar size estimate 8,247Population Affected 3,183Houses Affected HailHazards FreeAccount signup
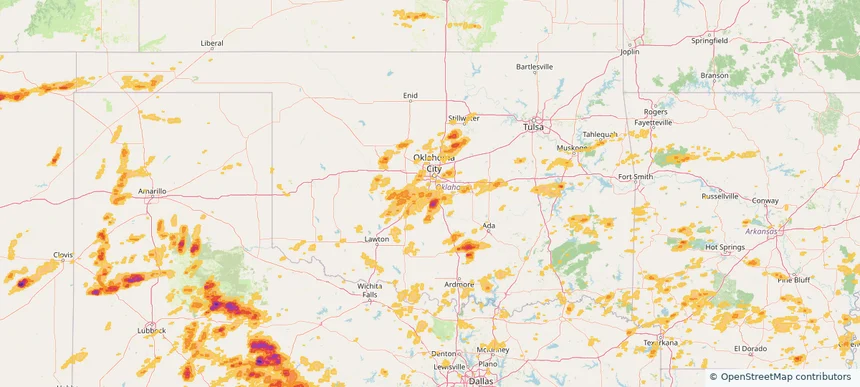
Newcastle, OK — May 25, 2025 — regional hail footprint preview
Storm footprint preview

Local hail summary for the Newcastle area: 19.36 square miles of estimated ground-hail footprint; highest mapped band 1.5+ inches. 1 official hail report(s) within the summary area. Exposure estimates are not confirmed property damage. Open the map to explore the full coverage included in your access. Statistics cover the mapped hail footprint inside the Census boundary of Newcastle, OK, not the entire region. The place had 10,984 residents in the 2020 Census. A boundary intersection does not mean the whole community was hit. Estimated housing exposure: 853 units in 1-inch-or-larger bands, including 10 in 1.5-inch-or-larger bands and 0 in 2-inch-or-larger bands.

Affected states: Newcastle area, OK
1.5+ inRadar size estimate 3,634Population Affected 1,516Houses Affected HailHazards FreeAccount signup
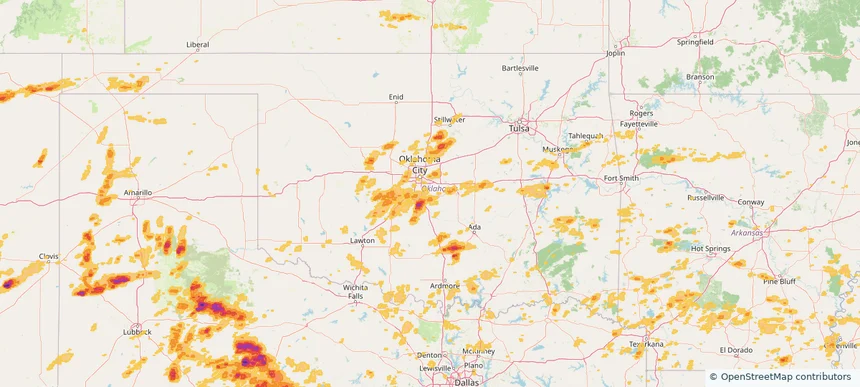
Norman, OK — May 25, 2025 — regional hail footprint preview
Storm footprint preview

Local hail summary for the Norman area: 27.32 square miles of estimated ground-hail footprint; highest mapped band 1+ inches. 1 official hail report(s) within the summary area. Exposure estimates are not confirmed property damage. Open the map to explore the full coverage included in your access. Statistics cover the mapped hail footprint inside the Census boundary of Norman, OK, not the entire region. The place had 128,026 residents in the 2020 Census. A boundary intersection does not mean the whole community was hit. Estimated housing exposure: 946 units in 1-inch-or-larger bands, including 0 in 1.5-inch-or-larger bands and 0 in 2-inch-or-larger bands.

Affected states: Norman area, OK
1+ inRadar size estimate 28,880Population Affected 10,754Houses Affected HailHazards FreeAccount signup
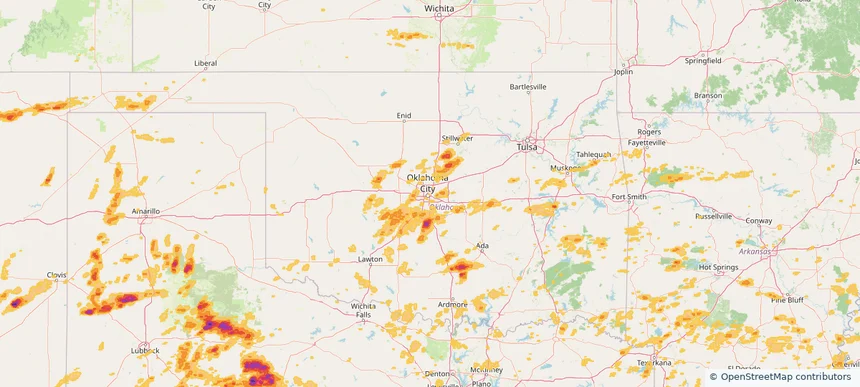
Oklahoma City, OK — May 25, 2025 — regional hail footprint preview
Storm footprint preview

Local hail summary for the Oklahoma City area: 14.73 square miles of estimated ground-hail footprint; highest mapped band 1+ inches. 0 official hail report(s) within the summary area. Exposure estimates are not confirmed property damage. Open the map to explore the full coverage included in your access. Statistics cover the mapped hail footprint inside the Census boundary of Oklahoma City, OK, not the entire region. The place had 681,054 residents in the 2020 Census. A boundary intersection does not mean the whole community was hit. Estimated housing exposure: 555 units in 1-inch-or-larger bands, including 0 in 1.5-inch-or-larger bands and 0 in 2-inch-or-larger bands.

Affected states: Oklahoma City area, OK
1+ inRadar size estimate 17,389Population Affected 7,207Houses Affected HailHazards FreeAccount signup
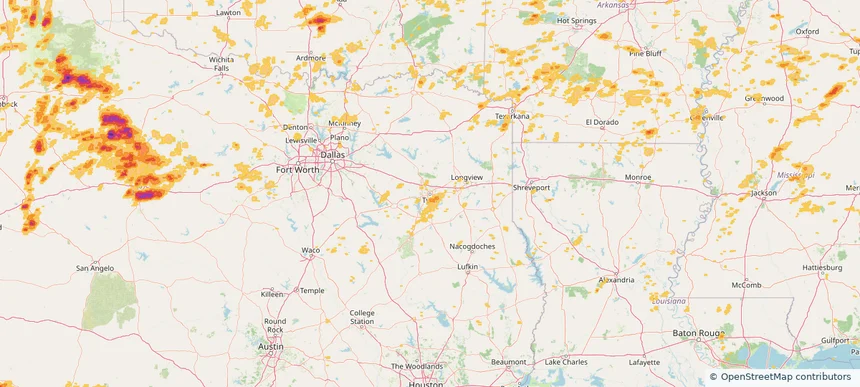
Tyler, TX — May 25, 2025 — regional hail footprint preview
Storm footprint preview

Local hail summary for the Tyler area: 6.14 square miles of estimated ground-hail footprint; highest mapped band 1+ inches. 0 official hail report(s) within the summary area. Exposure estimates are not confirmed property damage. Open the map to explore the full coverage included in your access. Statistics cover the mapped hail footprint inside the Census boundary of Tyler, TX, not the entire region. The place had 105,995 residents in the 2020 Census. A boundary intersection does not mean the whole community was hit. Estimated housing exposure: 1,346 units in 1-inch-or-larger bands, including 0 in 1.5-inch-or-larger bands and 0 in 2-inch-or-larger bands.

Affected states: Tyler area, TX
1+ inRadar size estimate 9,367Population Affected 4,019Houses Affected HailHazards FreeAccount signup
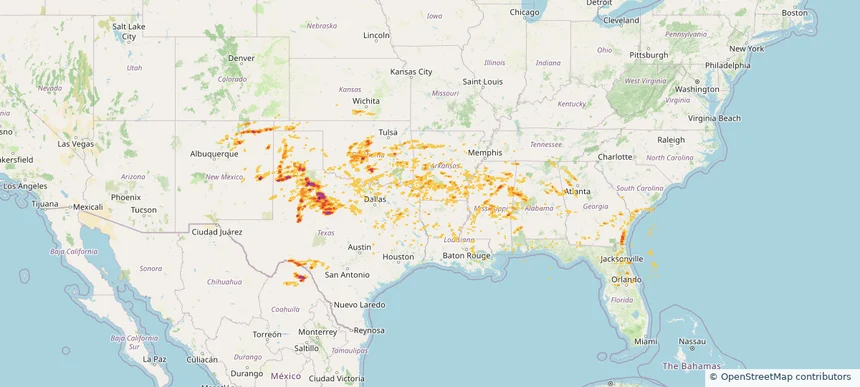
Historical Hail — 2025-05-25 — regional hail footprint preview
Storm footprint preview
May 25, 2025 7:00 AM to May 26, 2025 7:00 AM CST

Historical Hail — 2025-05-25

Hail as large as 2.50 inches was reported near Goldsby, OKLAHOMA. Wind up to 93 mph was reported near 1 mile northeast of Amherst, TX. 38 tornadoes were reported, including one near Grant, LOUISIANA. The storm had 18 official hail reports.

Affected states: National, AL, AR, FL, GA, KS, LA, MS, NM, OK, SC, TN, TX
3.0 inRadar size estimate 1,159,716Population Affected 493,690Houses Affected Hail · Wind · TornadoHazards FreeAccount signup
Black Forest, CO — May 24, 2025 — regional hail footprint preview
Storm footprint preview

Local hail summary for the Black Forest area: 43.43 square miles of estimated ground-hail footprint; highest mapped band 1.5+ inches. 0 official hail report(s) within the summary area. Exposure estimates are not confirmed property damage. Open the map to explore the full coverage included in your access. Statistics cover the mapped hail footprint inside the Census boundary of Black Forest, CO, not the entire region. The place had 15,097 residents in the 2020 Census. A boundary intersection does not mean the whole community was hit. Estimated housing exposure: 769 units in 1-inch-or-larger bands, including 127 in 1.5-inch-or-larger bands and 0 in 2-inch-or-larger bands.

Affected states: Black Forest area, CO
1.5+ inRadar size estimate 4,778Population Affected 1,779Houses Affected HailHazards FreeAccount signup
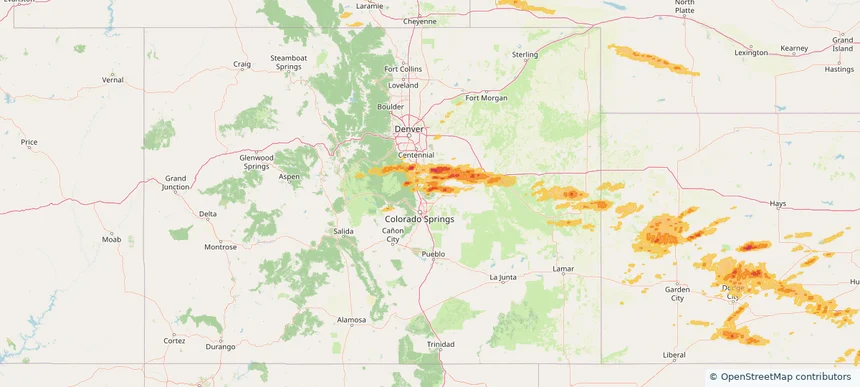
Broken Arrow, OK — May 24, 2025 — regional hail footprint preview
Storm footprint preview

Local hail summary for the Broken Arrow area: 33.19 square miles of estimated ground-hail footprint; highest mapped band 1+ inches. 0 official hail report(s) within the summary area. Exposure estimates are not confirmed property damage. Open the map to explore the full coverage included in your access. Statistics cover the mapped hail footprint inside the Census boundary of Broken Arrow, OK, not the entire region. The place had 113,540 residents in the 2020 Census. A boundary intersection does not mean the whole community was hit. Estimated housing exposure: 9,226 units in 1-inch-or-larger bands, including 0 in 1.5-inch-or-larger bands and 0 in 2-inch-or-larger bands.

Affected states: Broken Arrow area, OK
1+ inRadar size estimate 67,788Population Affected 26,948Houses Affected HailHazards FreeAccount signup
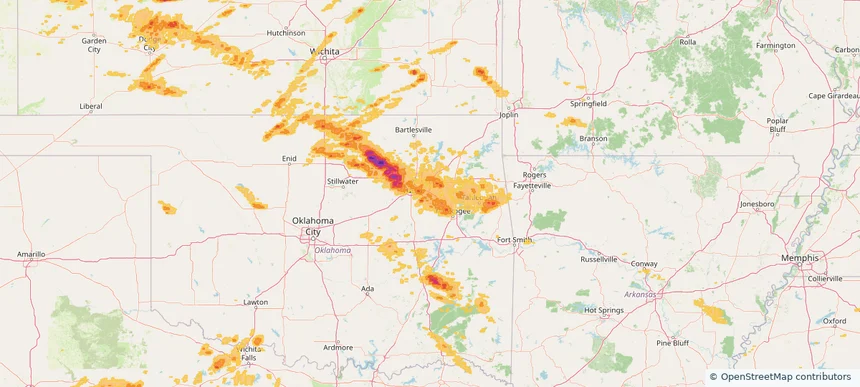
Castle Rock, CO — May 24, 2025 — regional hail footprint preview
Storm footprint preview

Local hail summary for the Castle Rock area: 30.04 square miles of estimated ground-hail footprint; highest mapped band 1.5+ inches. 0 official hail report(s) within the summary area. Exposure estimates are not confirmed property damage. Open the map to explore the full coverage included in your access. Statistics cover the mapped hail footprint inside the Census boundary of Castle Rock, CO, not the entire region. The place had 73,158 residents in the 2020 Census. A boundary intersection does not mean the whole community was hit. Estimated housing exposure: 8,105 units in 1-inch-or-larger bands, including 1,201 in 1.5-inch-or-larger bands and 0 in 2-inch-or-larger bands.

Affected states: Castle Rock area, CO
1.5+ inRadar size estimate 65,708Population Affected 24,173Houses Affected HailHazards FreeAccount signup
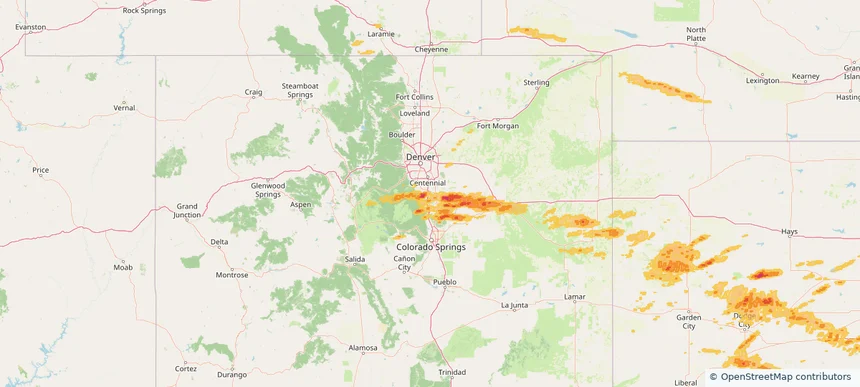
Kenner, LA — May 24, 2025 — regional hail footprint preview
Storm footprint preview

Local hail summary for the Kenner area: 4.34 square miles of estimated ground-hail footprint; highest mapped band 1+ inches. 0 official hail report(s) within the summary area. Exposure estimates are not confirmed property damage. Open the map to explore the full coverage included in your access. Statistics cover the mapped hail footprint inside the Census boundary of Kenner, LA, not the entire region. The place had 66,448 residents in the 2020 Census. A boundary intersection does not mean the whole community was hit. Estimated housing exposure: 5,118 units in 1-inch-or-larger bands, including 0 in 1.5-inch-or-larger bands and 0 in 2-inch-or-larger bands.

Affected states: Kenner area, LA
1+ inRadar size estimate 26,531Population Affected 11,716Houses Affected HailHazards FreeAccount signup
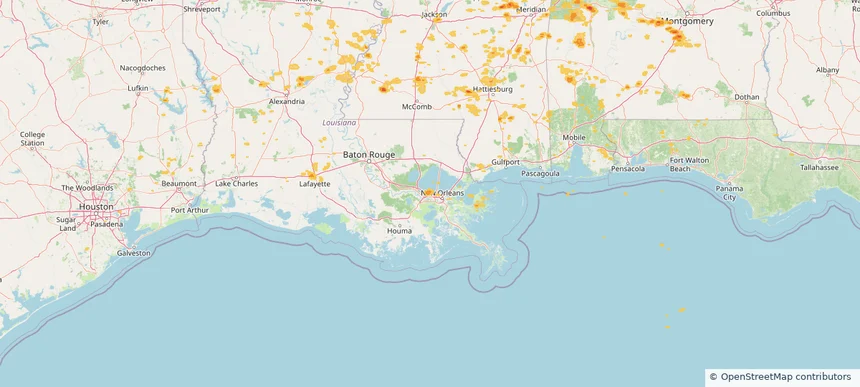
Lehigh Acres, FL — May 24, 2025 — regional hail footprint preview
Storm footprint preview

Local hail summary for the Lehigh Acres area: 17.91 square miles of estimated ground-hail footprint; highest mapped band 1.5+ inches. 0 official hail report(s) within the summary area. Exposure estimates are not confirmed property damage. Open the map to explore the full coverage included in your access. Statistics cover the mapped hail footprint inside the Census boundary of Lehigh Acres, FL, not the entire region. The place had 114,287 residents in the 2020 Census. A boundary intersection does not mean the whole community was hit. Estimated housing exposure: 1,853 units in 1-inch-or-larger bands, including 646 in 1.5-inch-or-larger bands and 0 in 2-inch-or-larger bands.

Affected states: Lehigh Acres area, FL
1.5+ inRadar size estimate 10,247Population Affected 3,570Houses Affected HailHazards FreeAccount signup
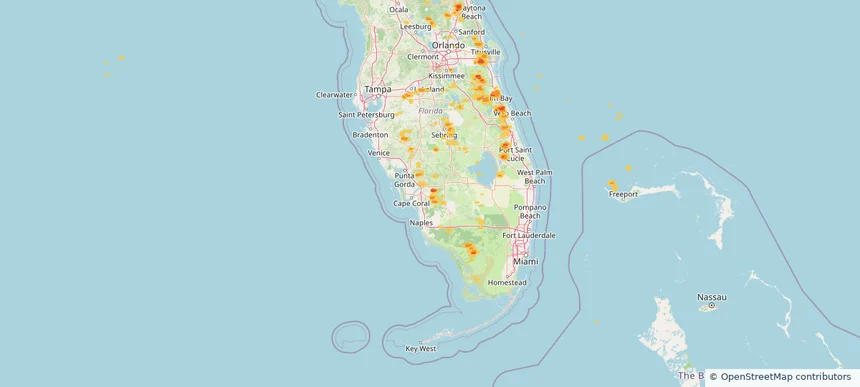
Medulla, FL — May 24, 2025 — regional hail footprint preview
Storm footprint preview

Local hail summary for the Medulla area: 3.01 square miles of estimated ground-hail footprint; highest mapped band 1+ inches. 0 official hail report(s) within the summary area. Exposure estimates are not confirmed property damage. Open the map to explore the full coverage included in your access. Statistics cover the mapped hail footprint inside the Census boundary of Medulla, FL, not the entire region. The place had 10,871 residents in the 2020 Census. A boundary intersection does not mean the whole community was hit. Estimated housing exposure: 2,336 units in 1-inch-or-larger bands, including 0 in 1.5-inch-or-larger bands and 0 in 2-inch-or-larger bands.

Affected states: Medulla area, FL
1+ inRadar size estimate 6,541Population Affected 2,736Houses Affected HailHazards FreeAccount signup
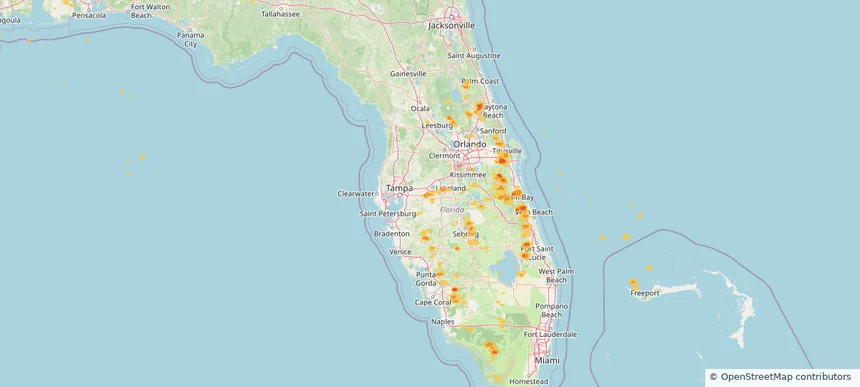
Palm Bay, FL — May 24, 2025 — regional hail footprint preview
Storm footprint preview

Local hail summary for the Palm Bay area: 20.27 square miles of estimated ground-hail footprint; highest mapped band 1.5+ inches. 2 official hail report(s) within the summary area. Exposure estimates are not confirmed property damage. Open the map to explore the full coverage included in your access. Statistics cover the mapped hail footprint inside the Census boundary of Palm Bay, FL, not the entire region. The place had 119,760 residents in the 2020 Census. A boundary intersection does not mean the whole community was hit. Estimated housing exposure: 9,002 units in 1-inch-or-larger bands, including 0 in 1.5-inch-or-larger bands and 0 in 2-inch-or-larger bands.

Affected states: Palm Bay area, FL
1.5+ inRadar size estimate 33,965Population Affected 13,552Houses Affected HailHazards FreeAccount signup
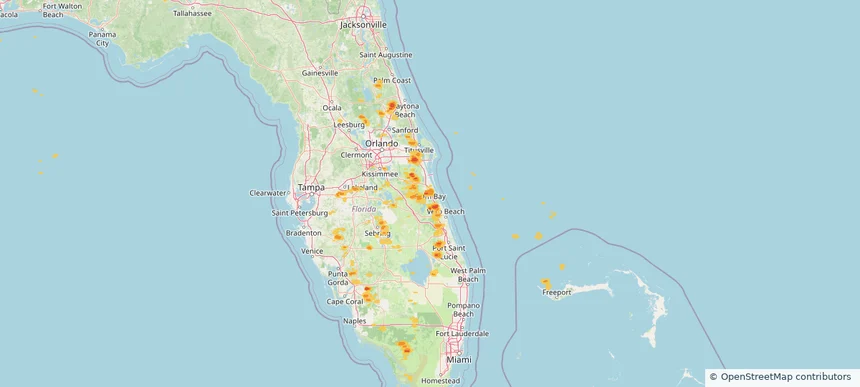
Ponca City, OK — May 24, 2025 — regional hail footprint preview
Storm footprint preview

Local hail summary for the Ponca City area: 6.57 square miles of estimated ground-hail footprint; highest mapped band 1+ inches. 0 official hail report(s) within the summary area. Exposure estimates are not confirmed property damage. Open the map to explore the full coverage included in your access. Statistics cover the mapped hail footprint inside the Census boundary of Ponca City, OK, not the entire region. The place had 24,424 residents in the 2020 Census. A boundary intersection does not mean the whole community was hit. Estimated housing exposure: 1,432 units in 1-inch-or-larger bands, including 0 in 1.5-inch-or-larger bands and 0 in 2-inch-or-larger bands.

Affected states: Ponca City area, OK
1+ inRadar size estimate 9,211Population Affected 4,272Houses Affected HailHazards FreeAccount signup
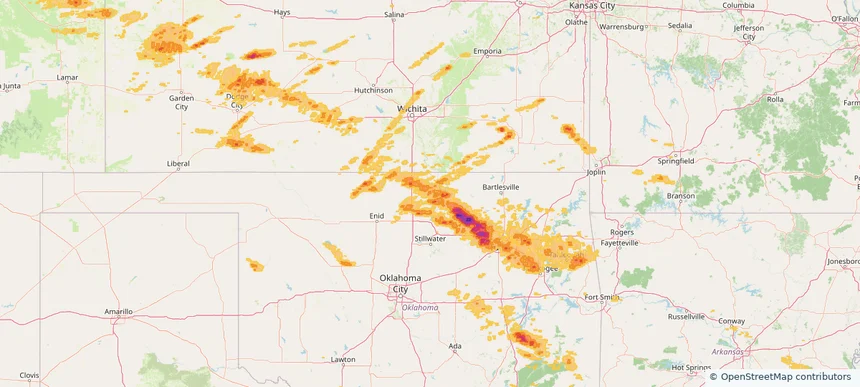
Port St. John, FL — May 24, 2025 — regional hail footprint preview
Storm footprint preview

Local hail summary for the Port St. John area: 6.25 square miles of estimated ground-hail footprint; highest mapped band 1+ inches. 0 official hail report(s) within the summary area. Exposure estimates are not confirmed property damage. Open the map to explore the full coverage included in your access. Statistics cover the mapped hail footprint inside the Census boundary of Port St. John, FL, not the entire region. The place had 23,474 residents in the 2020 Census. A boundary intersection does not mean the whole community was hit. Estimated housing exposure: 2,190 units in 1-inch-or-larger bands, including 0 in 1.5-inch-or-larger bands and 0 in 2-inch-or-larger bands.

Affected states: Port St. John area, FL
1+ inRadar size estimate 13,818Population Affected 5,387Houses Affected HailHazards FreeAccount signup
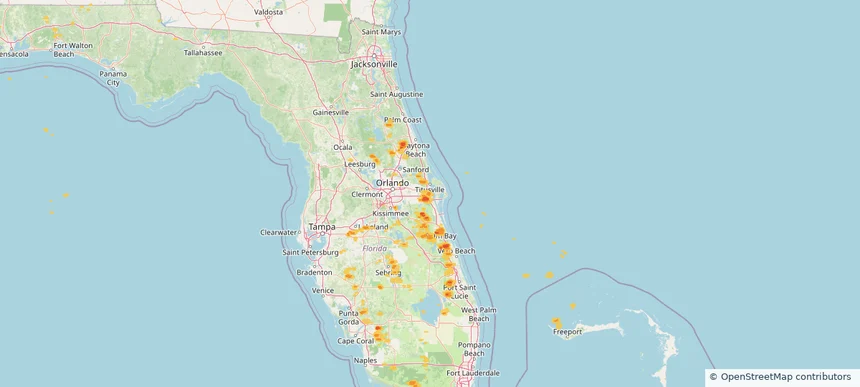
Sand Springs, OK — May 24, 2025 — regional hail footprint preview
Storm footprint preview

Local hail summary for the Sand Springs area: 16.69 square miles of estimated ground-hail footprint; highest mapped band 2.5+ inches. 0 official hail report(s) within the summary area. Exposure estimates are not confirmed property damage. Open the map to explore the full coverage included in your access. Statistics cover the mapped hail footprint inside the Census boundary of Sand Springs, OK, not the entire region. The place had 19,874 residents in the 2020 Census. A boundary intersection does not mean the whole community was hit. Estimated housing exposure: 5,040 units in 1-inch-or-larger bands, including 140 in 1.5-inch-or-larger bands and 5 in 2-inch-or-larger bands.

Affected states: Sand Springs area, OK
2.5+ inRadar size estimate 13,507Population Affected 5,902Houses Affected HailHazards FreeAccount signup
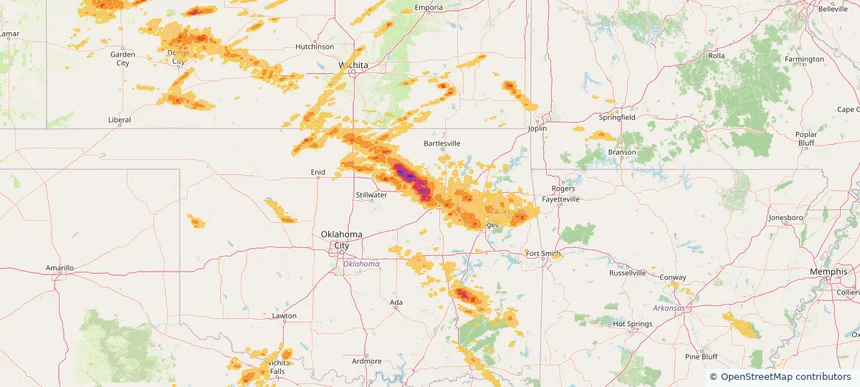
Tulsa, OK — May 24, 2025 — regional hail footprint preview
Storm footprint preview

Local hail summary for the Tulsa area: 83.36 square miles of estimated ground-hail footprint; highest mapped band 1.5+ inches. 2 official hail report(s) within the summary area. Exposure estimates are not confirmed property damage. Open the map to explore the full coverage included in your access. Statistics cover the mapped hail footprint inside the Census boundary of Tulsa, OK, not the entire region. The place had 413,066 residents in the 2020 Census. A boundary intersection does not mean the whole community was hit. Estimated housing exposure: 56,412 units in 1-inch-or-larger bands, including 2,625 in 1.5-inch-or-larger bands and 0 in 2-inch-or-larger bands.

Affected states: Tulsa area, OK
1.5+ inRadar size estimate 242,596Population Affected 115,117Houses Affected HailHazards FreeAccount signup
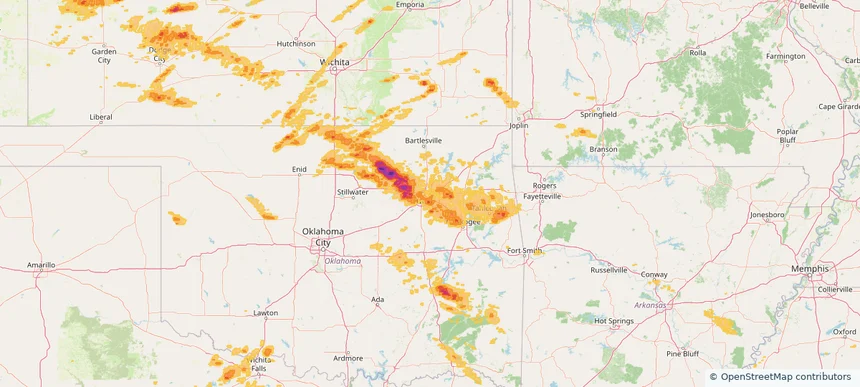
West Odessa, TX — May 24, 2025 — regional hail footprint preview
Storm footprint preview

Local hail summary for the West Odessa area: 33.34 square miles of estimated ground-hail footprint; highest mapped band 1+ inches. 0 official hail report(s) within the summary area. Exposure estimates are not confirmed property damage. Open the map to explore the full coverage included in your access. Statistics cover the mapped hail footprint inside the Census boundary of West Odessa, TX, not the entire region. The place had 33,340 residents in the 2020 Census. A boundary intersection does not mean the whole community was hit. Estimated housing exposure: 2,068 units in 1-inch-or-larger bands, including 0 in 1.5-inch-or-larger bands and 0 in 2-inch-or-larger bands.

Affected states: West Odessa area, TX
1+ inRadar size estimate 14,015Population Affected 5,161Houses Affected HailHazards FreeAccount signup
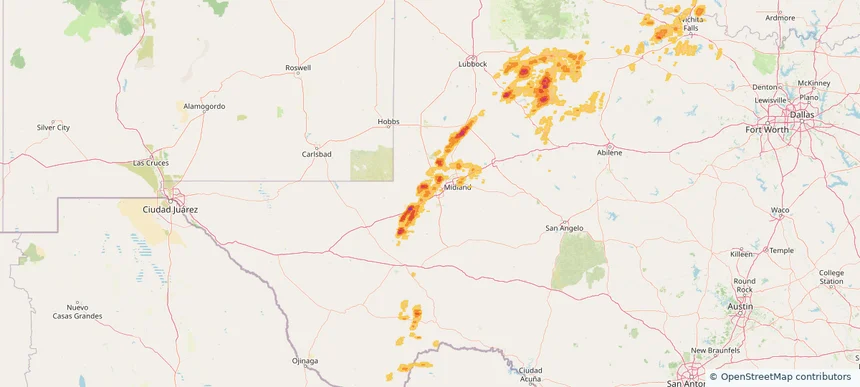
Historical Hail — 2025-05-24 — regional hail footprint preview
Storm footprint preview
May 24, 2025 7:00 AM to May 25, 2025 7:00 AM CST

Historical Hail — 2025-05-24

Hail as large as 1.75 inches was reported near Mc Alester, OKLAHOMA. Wind up to 101 mph was reported near 1 mile north-northwest of Jetmore, KS. 27 tornadoes were reported, including one near Grant, LOUISIANA. The storm had 14 official hail reports.

Affected states: National, AL, AR, CO, FL, GA, KS, LA, MS, MO, NE, OK, TX, WY
3.28 inRadar size estimate 1,557,739Population Affected 668,712Houses Affected Hail · Wind · TornadoHazards FreeAccount signup
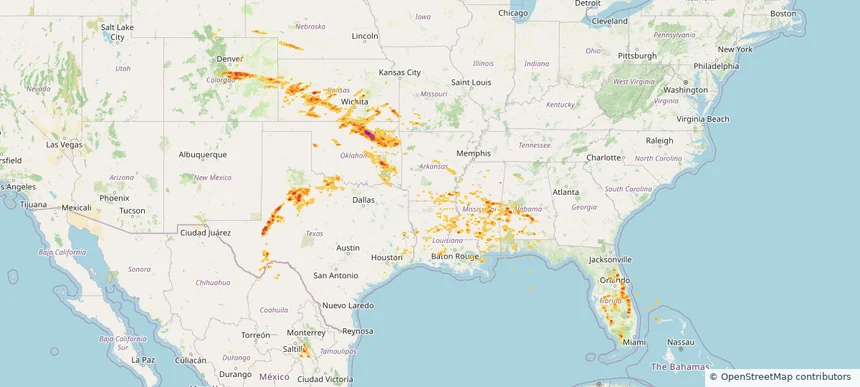
Ada, OK — May 23, 2025 — regional hail footprint preview
Storm footprint preview

Local hail summary for the Ada area: 19.52 square miles of estimated ground-hail footprint; highest mapped band 2.5+ inches. 0 official hail report(s) within the summary area. Exposure estimates are not confirmed property damage. Open the map to explore the full coverage included in your access. Statistics cover the mapped hail footprint inside the Census boundary of Ada, OK, not the entire region. The place had 16,481 residents in the 2020 Census. A boundary intersection does not mean the whole community was hit. Estimated housing exposure: 8,109 units in 1-inch-or-larger bands, including 3,759 in 1.5-inch-or-larger bands and 5 in 2-inch-or-larger bands.

Affected states: Ada area, OK
2.5+ inRadar size estimate 16,315Population Affected 8,120Houses Affected HailHazards FreeAccount signup
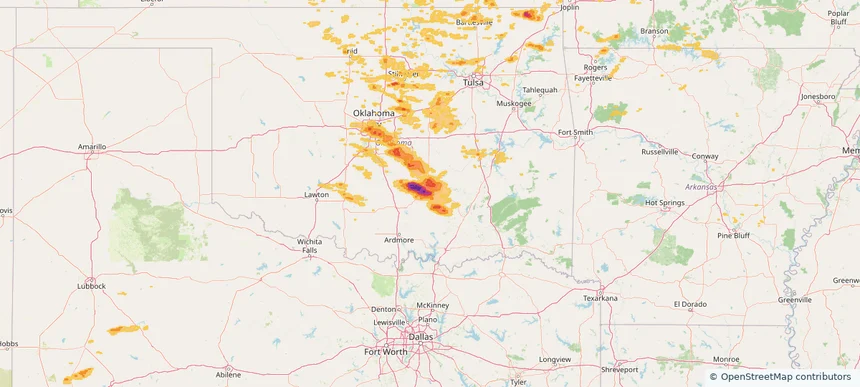
Boca Raton, FL — May 23, 2025 — regional hail footprint preview
Storm footprint preview

Local hail summary for the Boca Raton area: 0.92 square miles of estimated ground-hail footprint; highest mapped band 1+ inches. 0 official hail report(s) within the summary area. Exposure estimates are not confirmed property damage. Open the map to explore the full coverage included in your access. Statistics cover the mapped hail footprint inside the Census boundary of Boca Raton, FL, not the entire region. The place had 97,422 residents in the 2020 Census. A boundary intersection does not mean the whole community was hit. Estimated housing exposure: 1,600 units in 1-inch-or-larger bands, including 0 in 1.5-inch-or-larger bands and 0 in 2-inch-or-larger bands.

Affected states: Boca Raton area, FL
1+ inRadar size estimate 4,457Population Affected 2,528Houses Affected HailHazards FreeAccount signup
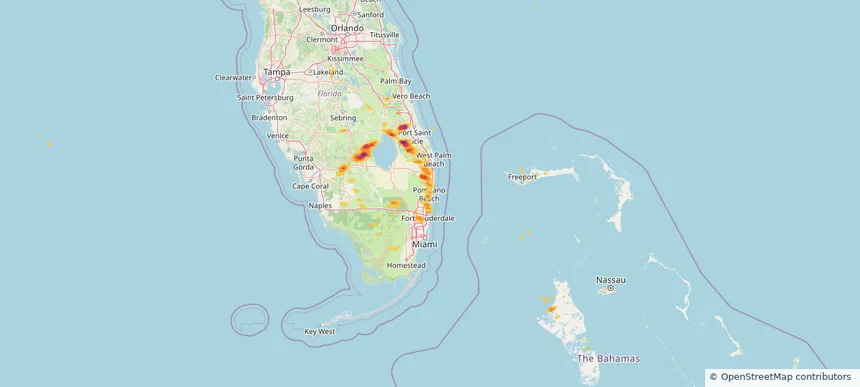
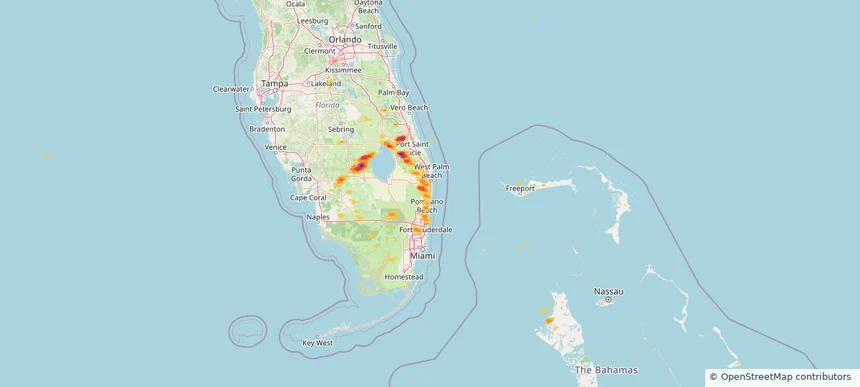
Boynton Beach, FL — May 23, 2025 — regional hail footprint preview
Storm footprint preview

Local hail summary for the Boynton Beach area: 0.46 square miles of estimated ground-hail footprint; highest mapped band 1+ inches. 0 official hail report(s) within the summary area. Exposure estimates are not confirmed property damage. Open the map to explore the full coverage included in your access. Statistics cover the mapped hail footprint inside the Census boundary of Boynton Beach, FL, not the entire region. The place had 80,380 residents in the 2020 Census. A boundary intersection does not mean the whole community was hit. Estimated housing exposure: 295 units in 1-inch-or-larger bands, including 0 in 1.5-inch-or-larger bands and 0 in 2-inch-or-larger bands.

Affected states: Boynton Beach area, FL
1+ inRadar size estimate 639Population Affected 497Houses Affected HailHazards FreeAccount signup
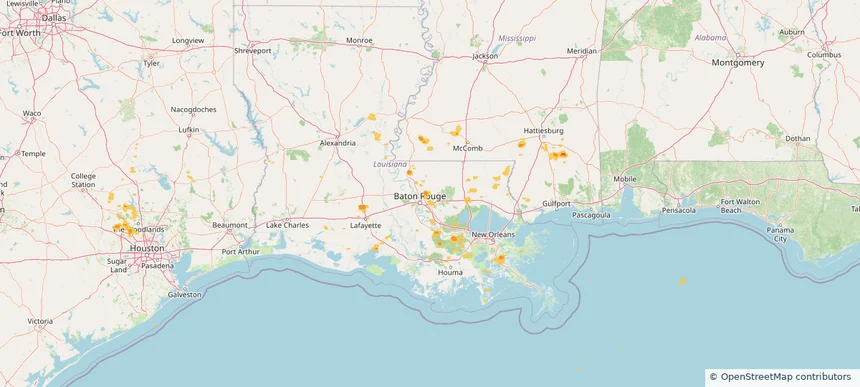
Central, LA — May 23, 2025 — regional hail footprint preview
Storm footprint preview

Local hail summary for the Central area: 3.01 square miles of estimated ground-hail footprint; highest mapped band 1+ inches. 0 official hail report(s) within the summary area. Exposure estimates are not confirmed property damage. Open the map to explore the full coverage included in your access. Statistics cover the mapped hail footprint inside the Census boundary of Central, LA, not the entire region. The place had 29,565 residents in the 2020 Census. A boundary intersection does not mean the whole community was hit. Estimated housing exposure: 215 units in 1-inch-or-larger bands, including 0 in 1.5-inch-or-larger bands and 0 in 2-inch-or-larger bands.

Affected states: Central area, LA
1+ inRadar size estimate 475Population Affected 215Houses Affected HailHazards FreeAccount signup
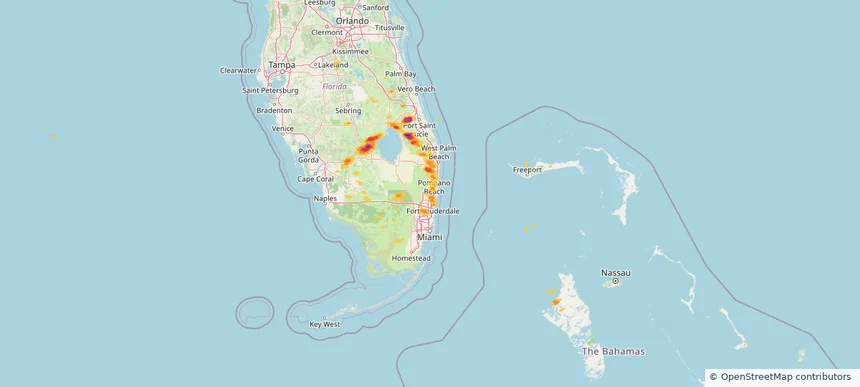
Coconut Creek, FL — May 23, 2025 — regional hail footprint preview
Storm footprint preview

Local hail summary for the Coconut Creek area: 1.29 square miles of estimated ground-hail footprint; highest mapped band 1+ inches. 0 official hail report(s) within the summary area. Exposure estimates are not confirmed property damage. Open the map to explore the full coverage included in your access. Statistics cover the mapped hail footprint inside the Census boundary of Coconut Creek, FL, not the entire region. The place had 57,833 residents in the 2020 Census. A boundary intersection does not mean the whole community was hit. Estimated housing exposure: 2,121 units in 1-inch-or-larger bands, including 0 in 1.5-inch-or-larger bands and 0 in 2-inch-or-larger bands.

Affected states: Coconut Creek area, FL
1+ inRadar size estimate 4,925Population Affected 2,121Houses Affected HailHazards FreeAccount signup
Page 89 of 99
‹ 1 88 89 90 99 ›

Frequently asked questions

Can I search hail maps by coverage area?

Yes. The storm library supports coverage-area filtering so you can find hail maps and hail swaths in a target service area.

What kinds of storms appear in the HailMapr library?

The library focuses on published hail events, including ready storm maps and live storms once hail has been detected and a public swath is available.

Are HailMapr storm pages useful for roofers and adjusters?

Yes. They are built to help roofers, adjusters, restoration teams, and property owners review storm footprints before purchase.