
Storm library

Browse live and recent hail maps.

Review storm footprints, hail swaths, reports, and replay access. Create a free account to save your setup and move into map access when a storm matters.

Search filters
Clear
Newest storms first by default.
Don't see your storm? Request a qualifying storm map and we'll email you when it is ready.
Showing 2065-2088 of 2371 storms · Page 87 of 99
‹ 1 86 87 88 99 ›
Request a storm map

Tell us about the storm and we'll build the map. Once it's published you'll get an email and can purchase it from the library — just like any other event.

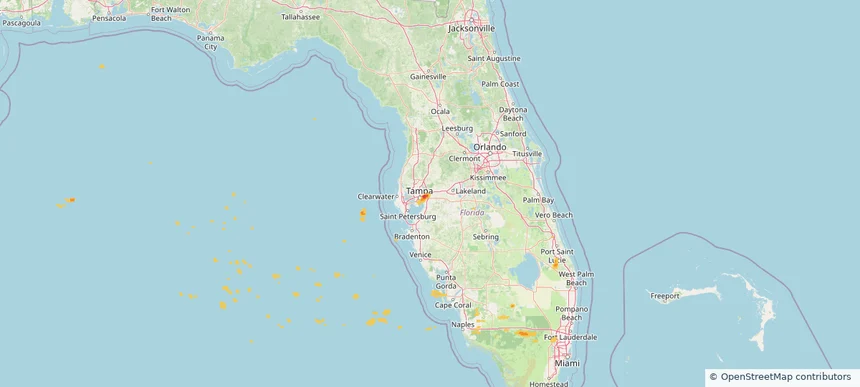
Mango, FL — June 02, 2025 — regional hail footprint preview
Storm footprint preview

Local hail summary for the Mango area: 1.31 square miles of estimated ground-hail footprint; highest mapped band 1+ inches. 0 official hail report(s) within the summary area. Exposure estimates are not confirmed property damage. Open the map to explore the full coverage included in your access. Statistics cover the mapped hail footprint inside the Census boundary of Mango, FL, not the entire region. The place had 12,699 residents in the 2020 Census. A boundary intersection does not mean the whole community was hit. Estimated housing exposure: 249 units in 1-inch-or-larger bands, including 0 in 1.5-inch-or-larger bands and 0 in 2-inch-or-larger bands.

Affected states: Mango area, FL
1+ inRadar size estimate 4,535Population Affected 1,636Houses Affected HailHazards FreeAccount signup
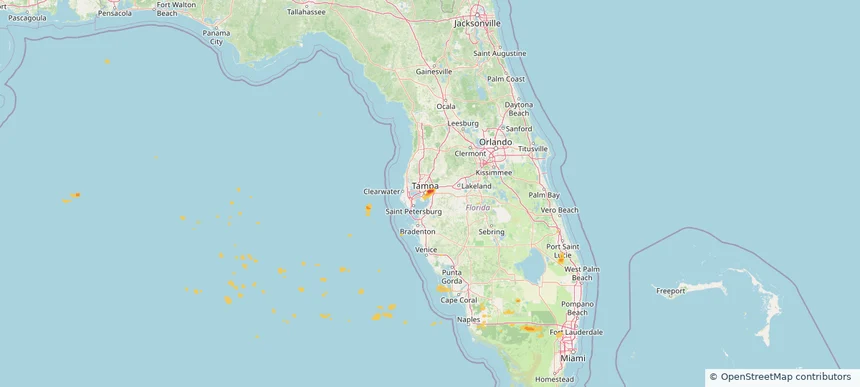
Storm footprint preview

Local hail summary for the North Platte area: 3.18 square miles of estimated ground-hail footprint; highest mapped band 1.5+ inches. 0 official hail report(s) within the summary area. Exposure estimates are not confirmed property damage. Open the map to explore the full coverage included in your access. Statistics cover the mapped hail footprint inside the Census boundary of North Platte, NE, not the entire region. The place had 23,390 residents in the 2020 Census. A boundary intersection does not mean the whole community was hit. Estimated housing exposure: 2,424 units in 1-inch-or-larger bands, including 0 in 1.5-inch-or-larger bands and 0 in 2-inch-or-larger bands.

Affected states: North Platte area, NE
1.5+ inRadar size estimate 8,442Population Affected 4,008Houses Affected HailHazards FreeAccount signup
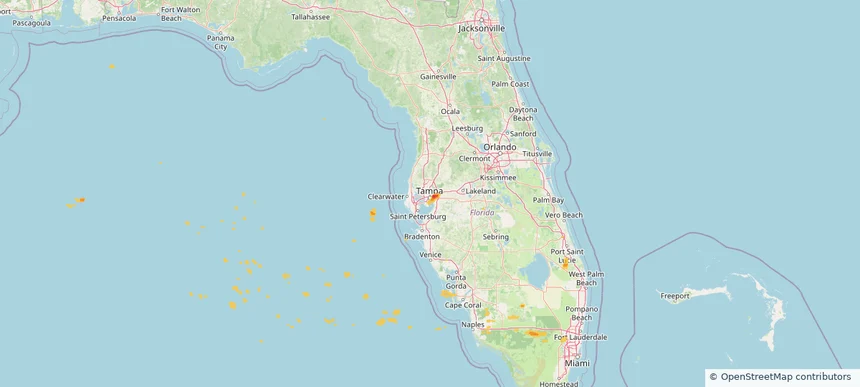
Palm River-Clair Mel, FL — June 02, 2025 — regional hail footprint preview
Storm footprint preview

Local hail summary for the Palm River-Clair Mel area: 4.32 square miles of estimated ground-hail footprint; highest mapped band 1.5+ inches. 0 official hail report(s) within the summary area. Exposure estimates are not confirmed property damage. Open the map to explore the full coverage included in your access. Statistics cover the mapped hail footprint inside the Census boundary of Palm River-Clair Mel, FL, not the entire region. The place had 26,142 residents in the 2020 Census. A boundary intersection does not mean the whole community was hit. Estimated housing exposure: 2,603 units in 1-inch-or-larger bands, including 431 in 1.5-inch-or-larger bands and 0 in 2-inch-or-larger bands.

Affected states: Palm River-Clair Mel area, FL
1.5+ inRadar size estimate 8,108Population Affected 3,061Houses Affected HailHazards FreeAccount signup
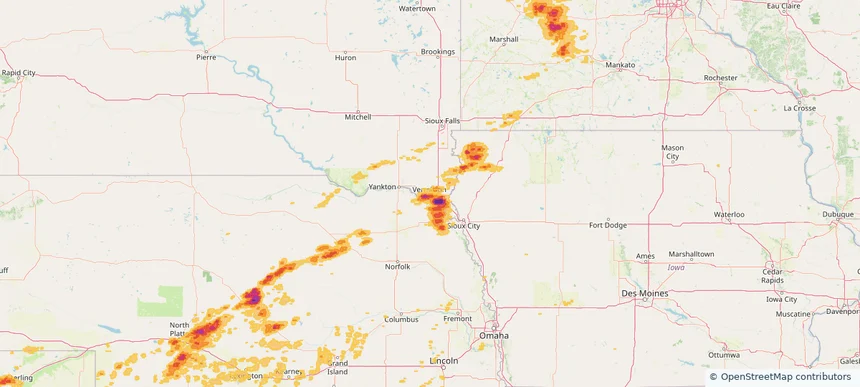
Tampa, FL — June 02, 2025 — regional hail footprint preview
Storm footprint preview

Local hail summary for the Tampa area: 5.15 square miles of estimated ground-hail footprint; highest mapped band 2+ inches. 0 official hail report(s) within the summary area. Exposure estimates are not confirmed property damage. Open the map to explore the full coverage included in your access. Statistics cover the mapped hail footprint inside the Census boundary of Tampa, FL, not the entire region. The place had 384,959 residents in the 2020 Census. A boundary intersection does not mean the whole community was hit. Estimated housing exposure: 1,159 units in 1-inch-or-larger bands, including 455 in 1.5-inch-or-larger bands and 114 in 2-inch-or-larger bands.

Affected states: Tampa area, FL
2+ inRadar size estimate 4,069Population Affected 1,160Houses Affected HailHazards FreeAccount signup
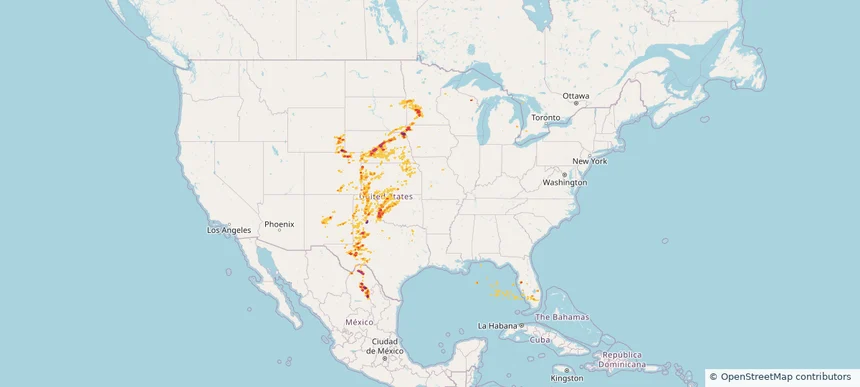
Vermillion, SD — June 02, 2025 — regional hail footprint preview
Storm footprint preview

Local hail summary for the Vermillion area: 3.38 square miles of estimated ground-hail footprint; highest mapped band 2+ inches. 0 official hail report(s) within the summary area. Exposure estimates are not confirmed property damage. Open the map to explore the full coverage included in your access. Statistics cover the mapped hail footprint inside the Census boundary of Vermillion, SD, not the entire region. The place had 11,695 residents in the 2020 Census. A boundary intersection does not mean the whole community was hit. Estimated housing exposure: 3,015 units in 1-inch-or-larger bands, including 1,313 in 1.5-inch-or-larger bands and 0 in 2-inch-or-larger bands.

Affected states: Vermillion area, SD
2+ inRadar size estimate 7,570Population Affected 3,387Houses Affected HailHazards FreeAccount signup
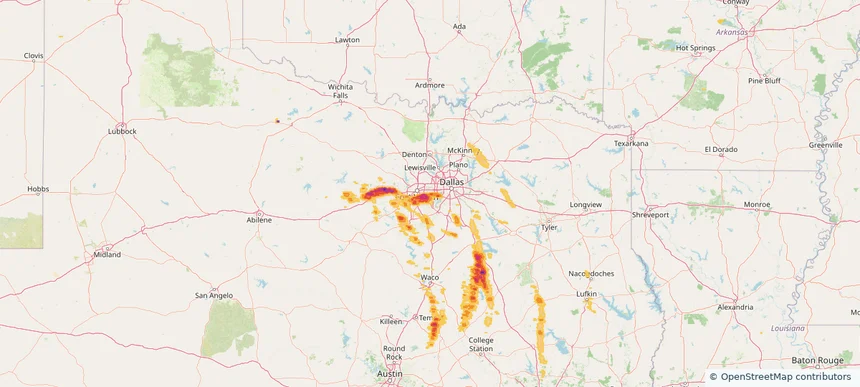
Historical Hail — 2025-06-02 — regional hail footprint preview
Storm footprint preview
Jun 2, 2025 7:00 AM to Jun 3, 2025 7:00 AM CST

Historical Hail — 2025-06-02

Hail as large as 1.75 inches was reported near Elk Pt, SOUTH DAKOTA. Wind up to 120 mph was reported near Tx, TX. 21 tornadoes were reported, including one near Mercer, ILLINOIS. The storm had 19 official hail reports.

Affected states: National, CO, FL, IA, KS, MN, NE, NM, OK, SD, TX, WI, WY
3.5 inRadar size estimate 279,329Population Affected 115,804Houses Affected Hail · Wind · TornadoHazards FreeAccount signup
Arlington, TX — June 01, 2025 — regional hail footprint preview
Storm footprint preview

Local hail summary for the Arlington area: 48.16 square miles of estimated ground-hail footprint; highest mapped band 2+ inches. 3 official hail report(s) within the summary area. Exposure estimates are not confirmed property damage. Open the map to explore the full coverage included in your access. Statistics cover the mapped hail footprint inside the Census boundary of Arlington, TX, not the entire region. The place had 394,266 residents in the 2020 Census. A boundary intersection does not mean the whole community was hit. Estimated housing exposure: 61,996 units in 1-inch-or-larger bands, including 23,877 in 1.5-inch-or-larger bands and 16,010 in 2-inch-or-larger bands.

Affected states: Arlington area, TX
2+ inRadar size estimate 204,651Population Affected 77,026Houses Affected HailHazards FreeAccount signup
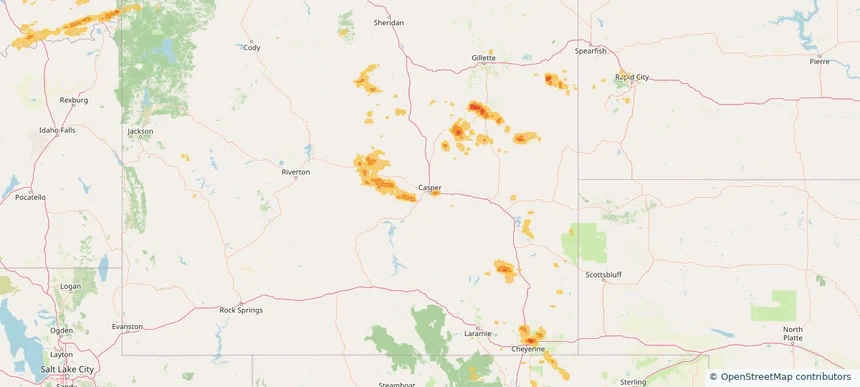
Casper, WY — June 01, 2025 — regional hail footprint preview
Storm footprint preview

Local hail summary for the Casper area: 3.96 square miles of estimated ground-hail footprint; highest mapped band 1+ inches. 0 official hail report(s) within the summary area. Exposure estimates are not confirmed property damage. Open the map to explore the full coverage included in your access. Statistics cover the mapped hail footprint inside the Census boundary of Casper, WY, not the entire region. The place had 59,038 residents in the 2020 Census. A boundary intersection does not mean the whole community was hit. Estimated housing exposure: 987 units in 1-inch-or-larger bands, including 0 in 1.5-inch-or-larger bands and 0 in 2-inch-or-larger bands.

Affected states: Casper area, WY
1+ inRadar size estimate 10,757Population Affected 4,670Houses Affected HailHazards FreeAccount signup
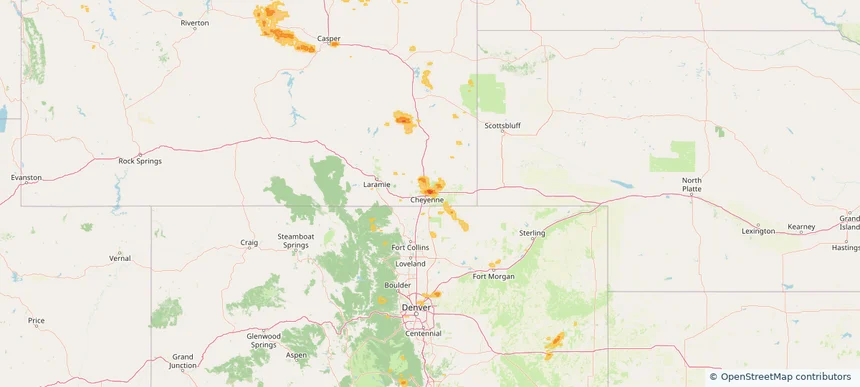
Cheyenne, WY — June 01, 2025 — regional hail footprint preview
Storm footprint preview

Local hail summary for the Cheyenne area: 23.02 square miles of estimated ground-hail footprint; highest mapped band 1.5+ inches. 1 official hail report(s) within the summary area. Exposure estimates are not confirmed property damage. Open the map to explore the full coverage included in your access. Statistics cover the mapped hail footprint inside the Census boundary of Cheyenne, WY, not the entire region. The place had 65,132 residents in the 2020 Census. A boundary intersection does not mean the whole community was hit. Estimated housing exposure: 24,374 units in 1-inch-or-larger bands, including 4,749 in 1.5-inch-or-larger bands and 0 in 2-inch-or-larger bands.

Affected states: Cheyenne area, WY
1.5+ inRadar size estimate 57,270Population Affected 26,464Houses Affected HailHazards FreeAccount signup
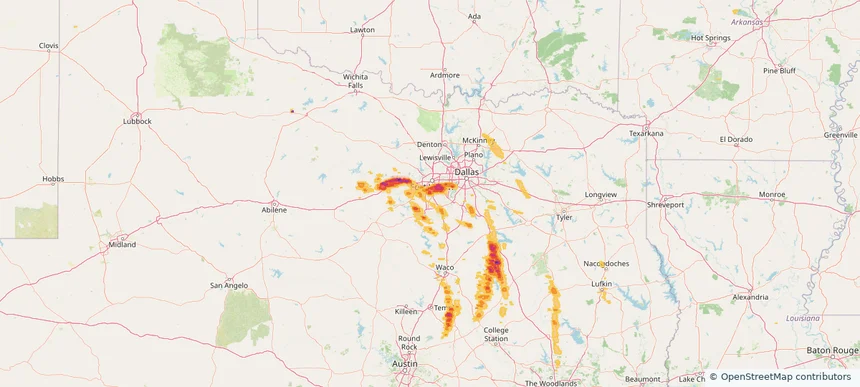
Crowley, TX — June 01, 2025 — regional hail footprint preview
Storm footprint preview

Local hail summary for the Crowley area: 5.51 square miles of estimated ground-hail footprint; highest mapped band 1.5+ inches. 0 official hail report(s) within the summary area. Exposure estimates are not confirmed property damage. Open the map to explore the full coverage included in your access. Statistics cover the mapped hail footprint inside the Census boundary of Crowley, TX, not the entire region. The place had 18,070 residents in the 2020 Census. A boundary intersection does not mean the whole community was hit. Estimated housing exposure: 2,708 units in 1-inch-or-larger bands, including 1,019 in 1.5-inch-or-larger bands and 0 in 2-inch-or-larger bands.

Affected states: Crowley area, TX
1.5+ inRadar size estimate 13,891Population Affected 4,888Houses Affected HailHazards FreeAccount signup
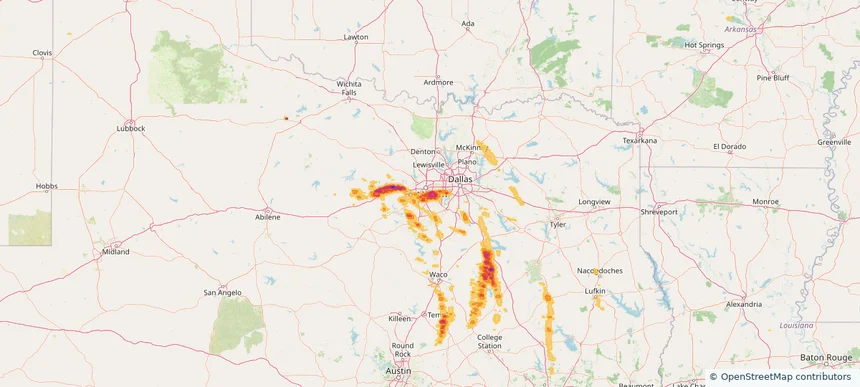
Forest Hill, TX — June 01, 2025 — regional hail footprint preview
Storm footprint preview

Local hail summary for the Forest Hill area: 4.17 square miles of estimated ground-hail footprint; highest mapped band 2+ inches. 0 official hail report(s) within the summary area. Exposure estimates are not confirmed property damage. Open the map to explore the full coverage included in your access. Statistics cover the mapped hail footprint inside the Census boundary of Forest Hill, TX, not the entire region. The place had 13,955 residents in the 2020 Census. A boundary intersection does not mean the whole community was hit. Estimated housing exposure: 4,500 units in 1-inch-or-larger bands, including 4,500 in 1.5-inch-or-larger bands and 2,835 in 2-inch-or-larger bands.

Affected states: Forest Hill area, TX
2+ inRadar size estimate 13,955Population Affected 4,500Houses Affected HailHazards FreeAccount signup
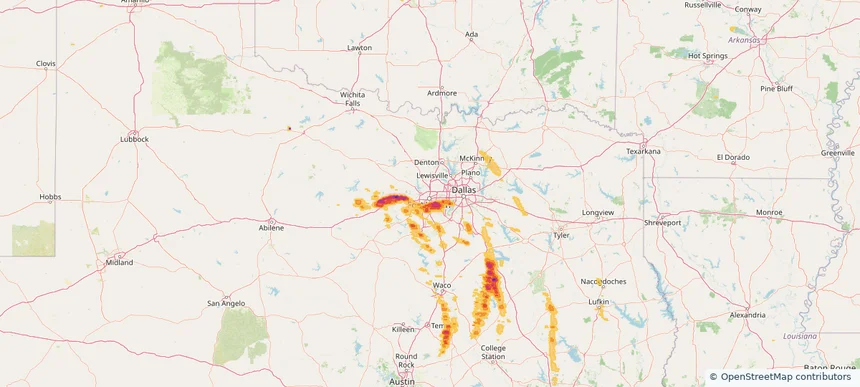
Fort Worth, TX — June 01, 2025 — regional hail footprint preview
Storm footprint preview

Local hail summary for the Fort Worth area: 60.23 square miles of estimated ground-hail footprint; highest mapped band 2+ inches. 0 official hail report(s) within the summary area. Exposure estimates are not confirmed property damage. Open the map to explore the full coverage included in your access. Statistics cover the mapped hail footprint inside the Census boundary of Fort Worth, TX, not the entire region. The place had 918,915 residents in the 2020 Census. A boundary intersection does not mean the whole community was hit. Estimated housing exposure: 60,458 units in 1-inch-or-larger bands, including 14,935 in 1.5-inch-or-larger bands and 3,554 in 2-inch-or-larger bands.

Affected states: Fort Worth area, TX
2+ inRadar size estimate 191,298Population Affected 65,009Houses Affected HailHazards FreeAccount signup
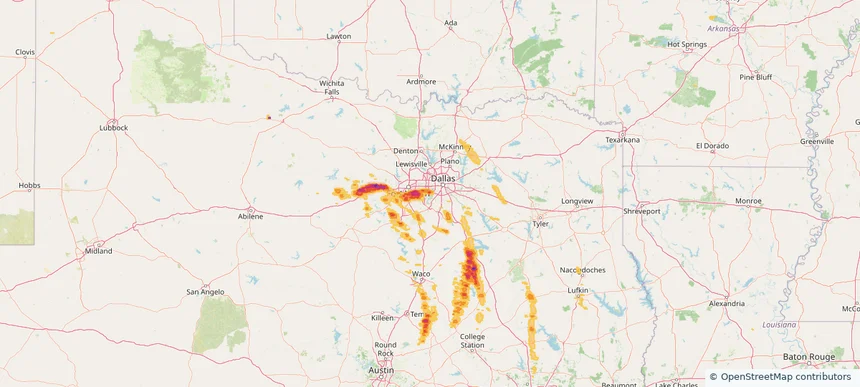
Grand Prairie, TX — June 01, 2025 — regional hail footprint preview
Storm footprint preview

Local hail summary for the Grand Prairie area: 11.79 square miles of estimated ground-hail footprint; highest mapped band 1+ inches. 0 official hail report(s) within the summary area. Exposure estimates are not confirmed property damage. Open the map to explore the full coverage included in your access. Statistics cover the mapped hail footprint inside the Census boundary of Grand Prairie, TX, not the entire region. The place had 196,100 residents in the 2020 Census. A boundary intersection does not mean the whole community was hit. Estimated housing exposure: 13,539 units in 1-inch-or-larger bands, including 0 in 1.5-inch-or-larger bands and 0 in 2-inch-or-larger bands.

Affected states: Grand Prairie area, TX
1+ inRadar size estimate 45,179Population Affected 16,371Houses Affected HailHazards FreeAccount signup
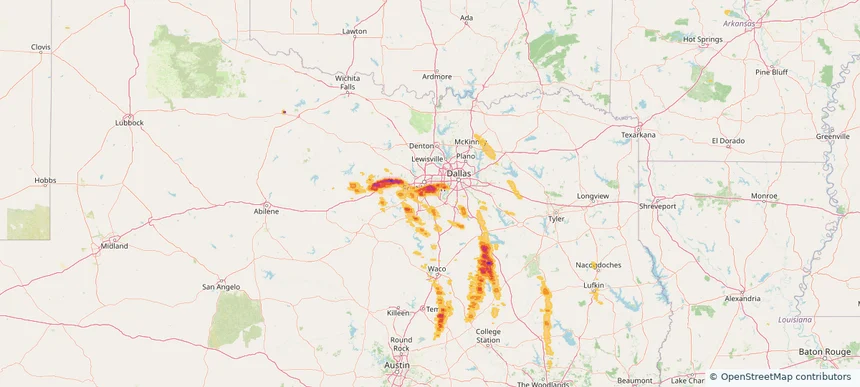
Rendon, TX — June 01, 2025 — regional hail footprint preview
Storm footprint preview

Local hail summary for the Rendon area: 3.66 square miles of estimated ground-hail footprint; highest mapped band 1.5+ inches. 0 official hail report(s) within the summary area. Exposure estimates are not confirmed property damage. Open the map to explore the full coverage included in your access. Statistics cover the mapped hail footprint inside the Census boundary of Rendon, TX, not the entire region. The place had 13,533 residents in the 2020 Census. A boundary intersection does not mean the whole community was hit. Estimated housing exposure: 259 units in 1-inch-or-larger bands, including 42 in 1.5-inch-or-larger bands and 0 in 2-inch-or-larger bands.

Affected states: Rendon area, TX
1.5+ inRadar size estimate 1,304Population Affected 509Houses Affected HailHazards FreeAccount signup
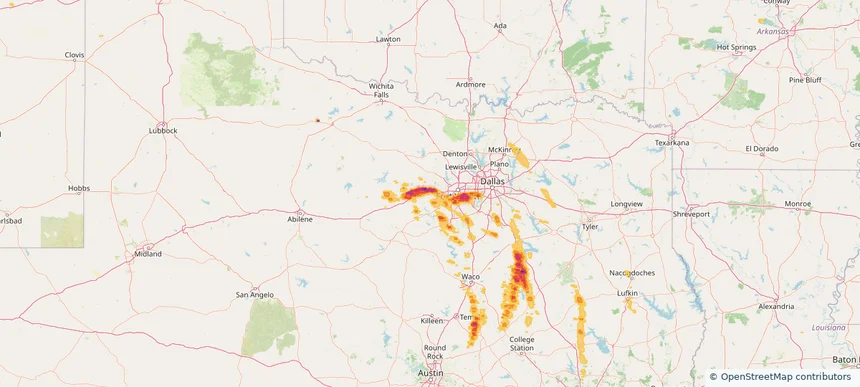
Weatherford, TX — June 01, 2025 — regional hail footprint preview
Storm footprint preview

Local hail summary for the Weatherford area: 27.03 square miles of estimated ground-hail footprint; highest mapped band 2.5+ inches. 1 official hail report(s) within the summary area. Exposure estimates are not confirmed property damage. Open the map to explore the full coverage included in your access. Statistics cover the mapped hail footprint inside the Census boundary of Weatherford, TX, not the entire region. The place had 30,854 residents in the 2020 Census. A boundary intersection does not mean the whole community was hit. Estimated housing exposure: 12,498 units in 1-inch-or-larger bands, including 11,109 in 1.5-inch-or-larger bands and 7,138 in 2-inch-or-larger bands.

Affected states: Weatherford area, TX
2.5+ inRadar size estimate 30,599Population Affected 12,784Houses Affected HailHazards FreeAccount signup
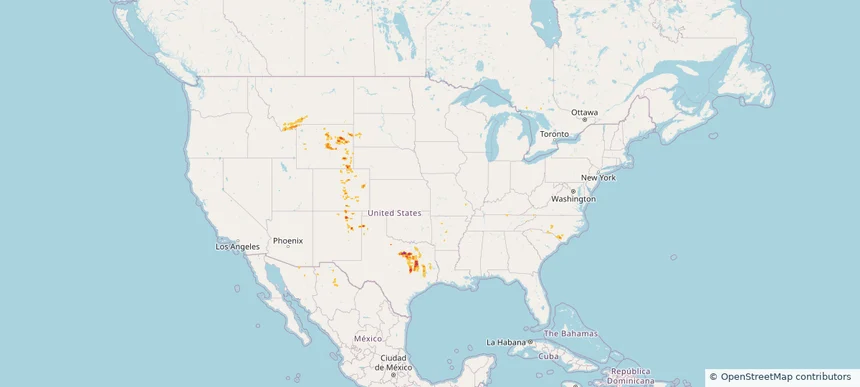
Historical Hail — 2025-06-01 — regional hail footprint preview
Storm footprint preview
Jun 1, 2025 7:00 AM to Jun 2, 2025 7:00 AM CST

Historical Hail — 2025-06-01

Hail as large as 3.00 inches was reported near Weatherford, TEXAS. Wind up to 104 mph was reported near Ector, TEXAS. 15 tornadoes were reported, including one near Mercer, ILLINOIS. The storm had 14 official hail reports.

Affected states: National, AZ, AR, CO, ID, MT, NM, NC, SC, SD, TN, TX, UT, WY
2.5 inRadar size estimate 962,688Population Affected 361,964Houses Affected Hail · Wind · TornadoHazards FreeAccount signup
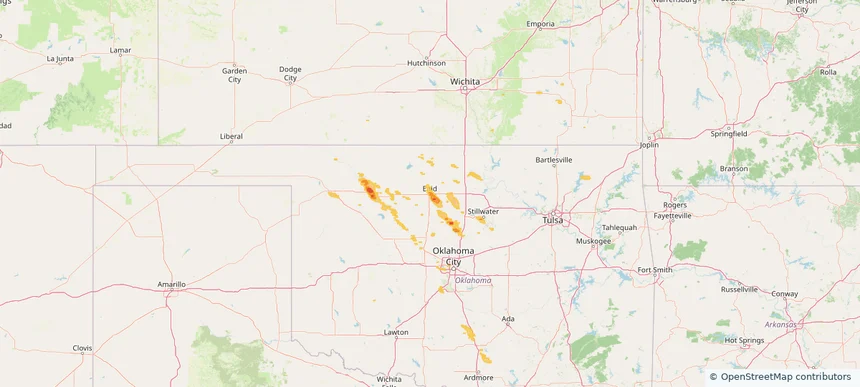
Enid, OK — May 31, 2025 — regional hail footprint preview
Storm footprint preview

Local hail summary for the Enid area: 8.20 square miles of estimated ground-hail footprint; highest mapped band 1+ inches. 0 official hail report(s) within the summary area. Exposure estimates are not confirmed property damage. Open the map to explore the full coverage included in your access. Statistics cover the mapped hail footprint inside the Census boundary of Enid, OK, not the entire region. The place had 51,308 residents in the 2020 Census. A boundary intersection does not mean the whole community was hit. Estimated housing exposure: 725 units in 1-inch-or-larger bands, including 0 in 1.5-inch-or-larger bands and 0 in 2-inch-or-larger bands.

Affected states: Enid area, OK
1+ inRadar size estimate 12,581Population Affected 5,508Houses Affected HailHazards FreeAccount signup
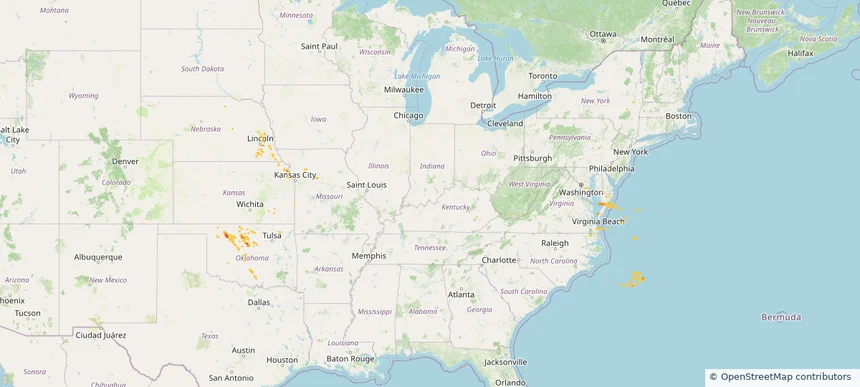
Historical Hail — 2025-05-31 — regional hail footprint preview
Storm footprint preview
May 31, 2025 7:00 AM to Jun 1, 2025 7:00 AM CST

Historical Hail — 2025-05-31

Hail as large as 1.00 inches was reported near Woods Corner, VIRGINIA. Wind up to 78 mph was reported near Clarendon, SOUTH CAROLINA. 6 tornadoes were reported, including one near Page, VIRGINIA. The storm had 3 official hail reports.

Affected states: National, DE, DC, KS, MD, MO, NE, NC, OK, VA
1.81 inRadar size estimate 89,017Population Affected 39,111Houses Affected Hail · Wind · TornadoHazards FreeAccount signup
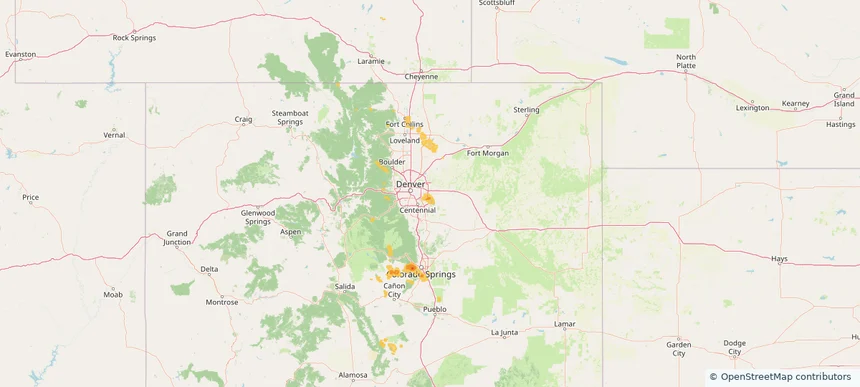
Aurora, CO — May 30, 2025 — regional hail footprint preview
Storm footprint preview

Local hail summary for the Aurora area: 25.01 square miles of estimated ground-hail footprint; highest mapped band 1+ inches. 0 official hail report(s) within the summary area. Exposure estimates are not confirmed property damage. Open the map to explore the full coverage included in your access. Statistics cover the mapped hail footprint inside the Census boundary of Aurora, CO, not the entire region. The place had 386,261 residents in the 2020 Census. A boundary intersection does not mean the whole community was hit. Estimated housing exposure: 2,196 units in 1-inch-or-larger bands, including 0 in 1.5-inch-or-larger bands and 0 in 2-inch-or-larger bands.

Affected states: Aurora area, CO
1+ inRadar size estimate 52,821Population Affected 17,694Houses Affected HailHazards FreeAccount signup
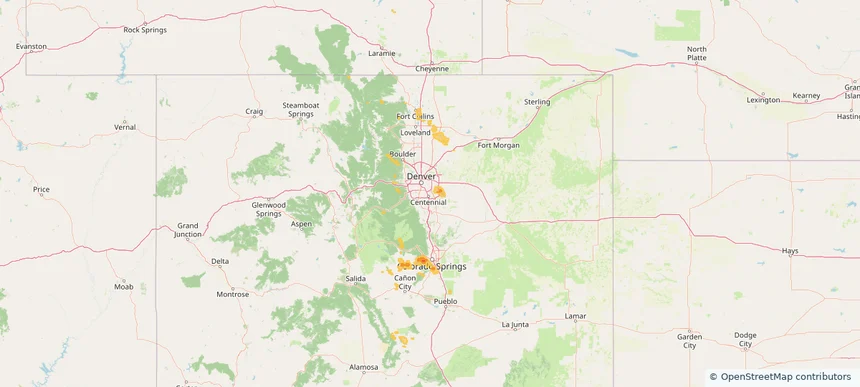
Centennial, CO — May 30, 2025 — regional hail footprint preview
Storm footprint preview

Local hail summary for the Centennial area: 1.56 square miles of estimated ground-hail footprint; highest mapped band 1+ inches. 0 official hail report(s) within the summary area. Exposure estimates are not confirmed property damage. Open the map to explore the full coverage included in your access. Statistics cover the mapped hail footprint inside the Census boundary of Centennial, CO, not the entire region. The place had 108,418 residents in the 2020 Census. A boundary intersection does not mean the whole community was hit. Estimated housing exposure: 581 units in 1-inch-or-larger bands, including 0 in 1.5-inch-or-larger bands and 0 in 2-inch-or-larger bands.

Affected states: Centennial area, CO
1+ inRadar size estimate 10,492Population Affected 3,406Houses Affected HailHazards FreeAccount signup
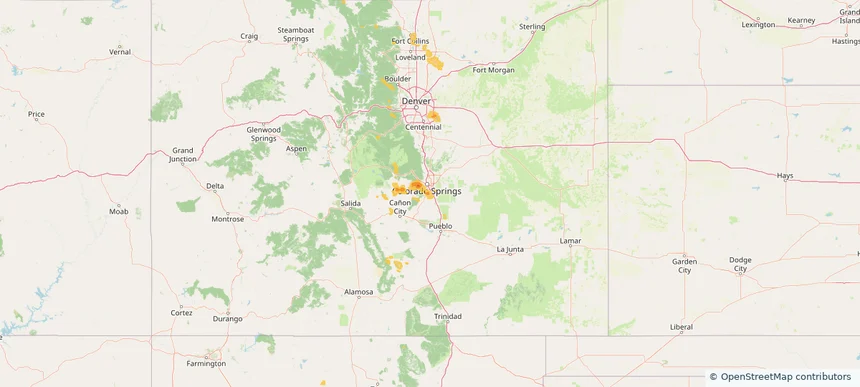
Fort Carson, CO — May 30, 2025 — regional hail footprint preview
Storm footprint preview

Local hail summary for the Fort Carson area: 16.52 square miles of estimated ground-hail footprint; highest mapped band 1+ inches. 0 official hail report(s) within the summary area. Exposure estimates are not confirmed property damage. Open the map to explore the full coverage included in your access. Statistics cover the mapped hail footprint inside the Census boundary of Fort Carson, CO, not the entire region. The place had 17,693 residents in the 2020 Census. A boundary intersection does not mean the whole community was hit. Estimated housing exposure: 1,460 units in 1-inch-or-larger bands, including 0 in 1.5-inch-or-larger bands and 0 in 2-inch-or-larger bands.

Affected states: Fort Carson area, CO
1+ inRadar size estimate 15,845Population Affected 2,763Houses Affected HailHazards FreeAccount signup
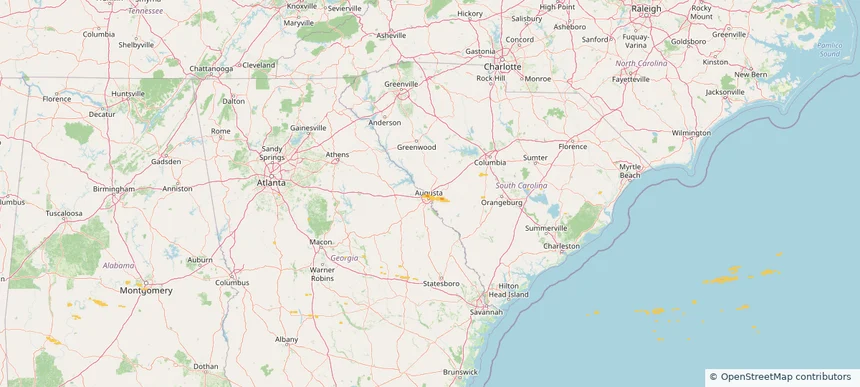
North Augusta, SC — May 30, 2025 — regional hail footprint preview
Storm footprint preview

Local hail summary for the North Augusta area: 2.32 square miles of estimated ground-hail footprint; highest mapped band 1+ inches. 0 official hail report(s) within the summary area. Exposure estimates are not confirmed property damage. Open the map to explore the full coverage included in your access. Statistics cover the mapped hail footprint inside the Census boundary of North Augusta, SC, not the entire region. The place had 24,379 residents in the 2020 Census. A boundary intersection does not mean the whole community was hit. Estimated housing exposure: 644 units in 1-inch-or-larger bands, including 0 in 1.5-inch-or-larger bands and 0 in 2-inch-or-larger bands.

Affected states: North Augusta area, SC
1+ inRadar size estimate 4,873Population Affected 2,425Houses Affected HailHazards FreeAccount signup
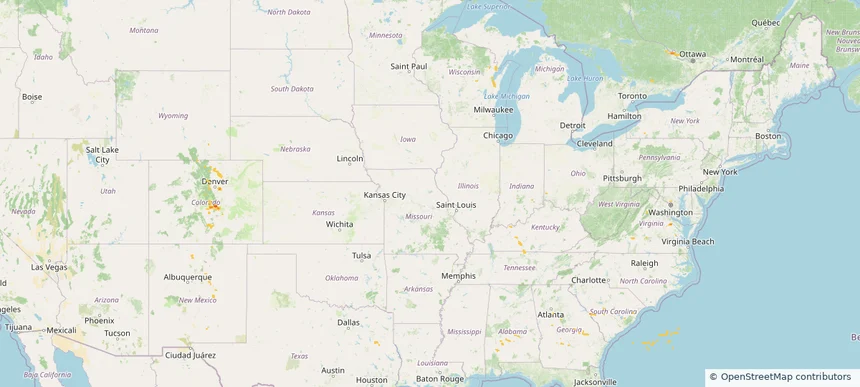
Historical Hail — 2025-05-30 — regional hail footprint preview
Storm footprint preview
May 30, 2025 7:00 AM to May 31, 2025 7:00 AM CST

Historical Hail — 2025-05-30

Hail as large as 1.00 inches was reported near Marksville, VIRGINIA. Wind up to 104 mph was reported near 3 miles east-northeast of Swansea, SC. 17 tornadoes were reported, including one near Page, VIRGINIA. The storm had 2 official hail reports.

Affected states: National, AL, CO, GA, KY, MD, NM, NC, OH, SC, TN, TX, VA, WV, WI
1.32 inRadar size estimate 155,019Population Affected 56,748Houses Affected Hail · Wind · TornadoHazards FreeAccount signup
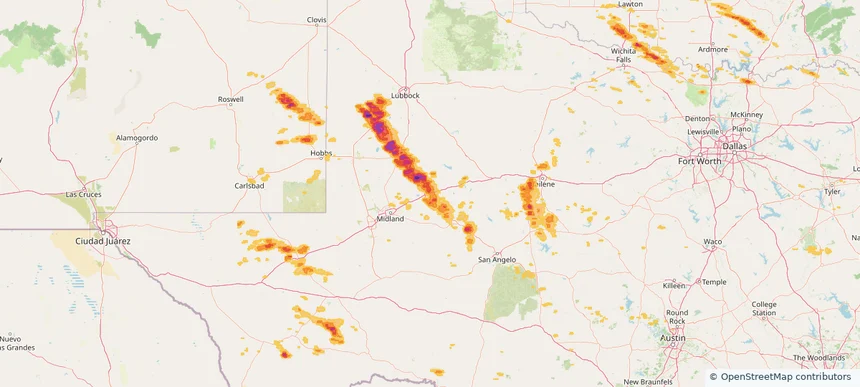
Big Spring, TX — May 29, 2025 — regional hail footprint preview
Storm footprint preview

Local hail summary for the Big Spring area: 13.78 square miles of estimated ground-hail footprint; highest mapped band 1.5+ inches. 0 official hail report(s) within the summary area. Exposure estimates are not confirmed property damage. Open the map to explore the full coverage included in your access. Statistics cover the mapped hail footprint inside the Census boundary of Big Spring, TX, not the entire region. The place had 26,144 residents in the 2020 Census. A boundary intersection does not mean the whole community was hit. Estimated housing exposure: 7,325 units in 1-inch-or-larger bands, including 2,623 in 1.5-inch-or-larger bands and 0 in 2-inch-or-larger bands.

Affected states: Big Spring area, TX
1.5+ inRadar size estimate 18,144Population Affected 8,424Houses Affected HailHazards FreeAccount signup
Page 87 of 99
‹ 1 86 87 88 99 ›

Frequently asked questions

Can I search hail maps by coverage area?

Yes. The storm library supports coverage-area filtering so you can find hail maps and hail swaths in a target service area.

What kinds of storms appear in the HailMapr library?

The library focuses on published hail events, including ready storm maps and live storms once hail has been detected and a public swath is available.

Are HailMapr storm pages useful for roofers and adjusters?

Yes. They are built to help roofers, adjusters, restoration teams, and property owners review storm footprints before purchase.