Storm library

Browse live and recent hail maps.

Review storm footprints, hail swaths, reports, and replay access. Create a free account to save your setup and move into map access when a storm matters.

Search filters
Clear
Newest storms first by default.
Don't see your storm? Request a qualifying storm map and we'll email you when it is ready.
Showing 1945-1968 of 2371 storms · Page 82 of 99
‹ 1 81 82 83 99 ›
Request a storm map

Tell us about the storm and we'll build the map. Once it's published you'll get an email and can purchase it from the library — just like any other event.

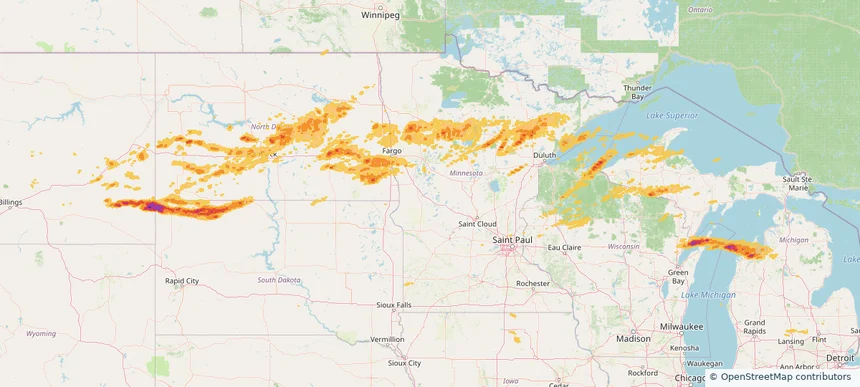
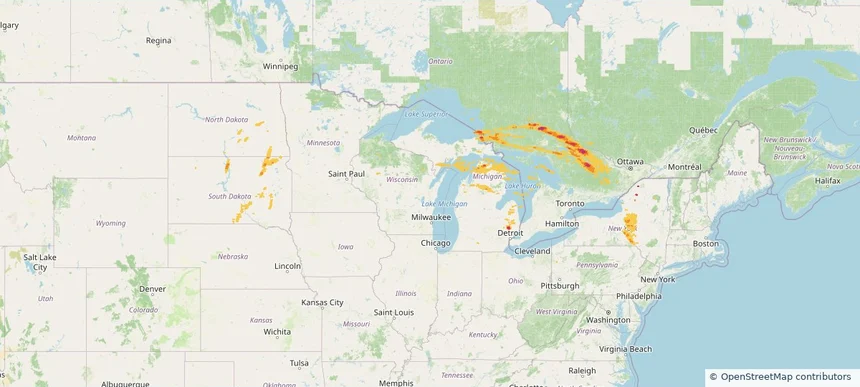
Historical Hail — 2025-06-21 — regional hail footprint preview
Storm footprint preview
Jun 21, 2025 7:00 AM to Jun 22, 2025 7:00 AM CST

Historical Hail — 2025-06-21

Hail as large as 1.75 inches was reported near 3 miles north of Riggsville, MI. Wind up to 104 mph was reported near Beltrami, MINNESOTA. 14 tornadoes were reported, including one near Stutsman, NORTH DAKOTA. The storm had 1 official hail report.

Affected states: National, MI, NY, ND, SD, WI
2.73 inRadar size estimate 127,879Population Affected 61,992Houses Affected Hail · Wind · TornadoHazards FreeAccount signup
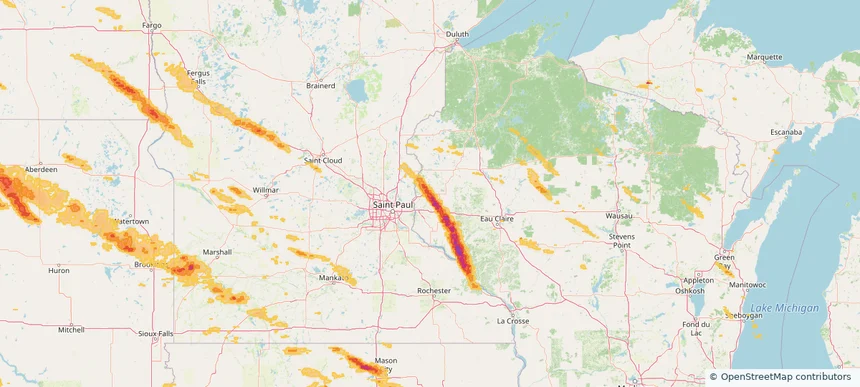
Storm footprint preview

Local hail summary for the Grand Rapids area: 13.00 square miles of estimated ground-hail footprint; highest mapped band 1+ inches. 0 official hail report(s) within the summary area. Exposure estimates are not confirmed property damage. Open the map to explore the full coverage included in your access. Statistics cover the mapped hail footprint inside the Census boundary of Grand Rapids, MN, not the entire region. The place had 11,126 residents in the 2020 Census. A boundary intersection does not mean the whole community was hit. Estimated housing exposure: 218 units in 1-inch-or-larger bands, including 0 in 1.5-inch-or-larger bands and 0 in 2-inch-or-larger bands.

Affected states: Grand Rapids area, MN
1+ inRadar size estimate 5,516Population Affected 2,583Houses Affected HailHazards FreeAccount signup
Hibbing, MN — June 20, 2025 — regional hail footprint preview
Storm footprint preview

Local hail summary for the Hibbing area: 25.73 square miles of estimated ground-hail footprint; highest mapped band 1+ inches. 0 official hail report(s) within the summary area. Exposure estimates are not confirmed property damage. Open the map to explore the full coverage included in your access. Statistics cover the mapped hail footprint inside the Census boundary of Hibbing, MN, not the entire region. The place had 16,214 residents in the 2020 Census. A boundary intersection does not mean the whole community was hit. Estimated housing exposure: 116 units in 1-inch-or-larger bands, including 0 in 1.5-inch-or-larger bands and 0 in 2-inch-or-larger bands.

Affected states: Hibbing area, MN
1+ inRadar size estimate 983Population Affected 484Houses Affected HailHazards FreeAccount signup
Jamestown, ND — June 20, 2025 — regional hail footprint preview
Storm footprint preview

Local hail summary for the Jamestown area: 12.92 square miles of estimated ground-hail footprint; highest mapped band 1.5+ inches. 0 official hail report(s) within the summary area. Exposure estimates are not confirmed property damage. Open the map to explore the full coverage included in your access. Statistics cover the mapped hail footprint inside the Census boundary of Jamestown, ND, not the entire region. The place had 15,849 residents in the 2020 Census. A boundary intersection does not mean the whole community was hit. Estimated housing exposure: 7,493 units in 1-inch-or-larger bands, including 1,411 in 1.5-inch-or-larger bands and 0 in 2-inch-or-larger bands.

Affected states: Jamestown area, ND
1.5+ inRadar size estimate 15,849Population Affected 7,493Houses Affected HailHazards FreeAccount signup
Traverse City, MI — June 20, 2025 — regional hail footprint preview
Storm footprint preview

Local hail summary for the Traverse City area: 7.60 square miles of estimated ground-hail footprint; highest mapped band 1+ inches. 0 official hail report(s) within the summary area. Exposure estimates are not confirmed property damage. Open the map to explore the full coverage included in your access. Statistics cover the mapped hail footprint inside the Census boundary of Traverse City, MI, not the entire region. The place had 15,678 residents in the 2020 Census. A boundary intersection does not mean the whole community was hit. Estimated housing exposure: 4,914 units in 1-inch-or-larger bands, including 0 in 1.5-inch-or-larger bands and 0 in 2-inch-or-larger bands.

Affected states: Traverse City area, MI
1+ inRadar size estimate 15,590Population Affected 8,358Houses Affected HailHazards FreeAccount signup
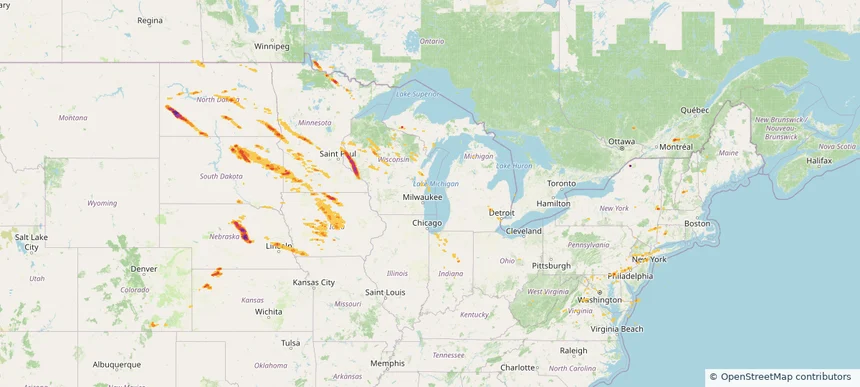
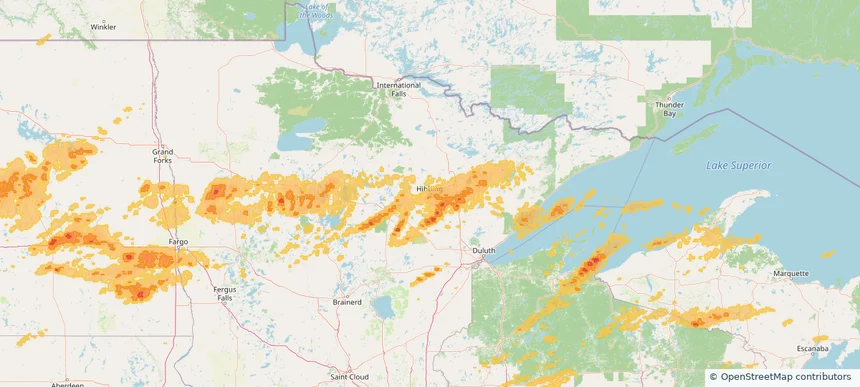
Historical Hail — 2025-06-20 — regional hail footprint preview
Storm footprint preview
Jun 20, 2025 7:00 AM to Jun 21, 2025 7:00 AM CST

Historical Hail — 2025-06-20

Hail as large as 3.00 inches was reported near Jamestown, NORTH DAKOTA. Wind up to 128 mph was reported near 1 mile east of Luverne, ND. 57 tornadoes were reported, including one near Stutsman, NORTH DAKOTA. The storm had 10 official hail reports.

Affected states: National, IA, MI, MN, MT, ND, SD, WI
2.87 inRadar size estimate 457,176Population Affected 233,330Houses Affected Hail · Wind · TornadoHazards FreeAccount signup
Storm footprint preview

Local hail summary for the Boone area: 0.94 square miles of estimated ground-hail footprint; highest mapped band 1+ inches. 0 official hail report(s) within the summary area. Exposure estimates are not confirmed property damage. Open the map to explore the full coverage included in your access. Statistics cover the mapped hail footprint inside the Census boundary of Boone, IA, not the entire region. The place had 12,460 residents in the 2020 Census. A boundary intersection does not mean the whole community was hit. Estimated housing exposure: 393 units in 1-inch-or-larger bands, including 0 in 1.5-inch-or-larger bands and 0 in 2-inch-or-larger bands.

Affected states: Boone area, IA
1+ inRadar size estimate 1,433Population Affected 655Houses Affected HailHazards FreeAccount signup
New Richmond, WI — June 19, 2025 — regional hail footprint preview
Storm footprint preview

Local hail summary for the New Richmond area: 11.04 square miles of estimated ground-hail footprint; highest mapped band 1.5+ inches. 2 official hail report(s) within the summary area. Exposure estimates are not confirmed property damage. Open the map to explore the full coverage included in your access. Statistics cover the mapped hail footprint inside the Census boundary of New Richmond, WI, not the entire region. The place had 10,079 residents in the 2020 Census. A boundary intersection does not mean the whole community was hit. Estimated housing exposure: 4,101 units in 1-inch-or-larger bands, including 2,927 in 1.5-inch-or-larger bands and 0 in 2-inch-or-larger bands.

Affected states: New Richmond area, WI
1.5+ inRadar size estimate 9,614Population Affected 4,101Houses Affected HailHazards FreeAccount signup
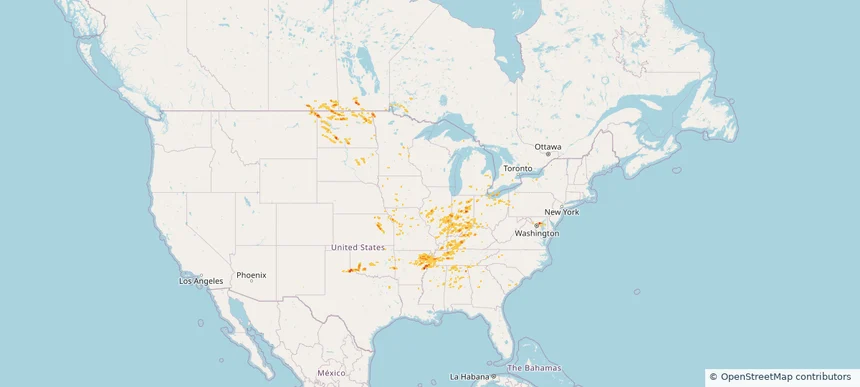
Historical Hail — 2025-06-19 — regional hail footprint preview
Storm footprint preview
Jun 19, 2025 7:00 AM to Jun 20, 2025 7:00 AM CST

Historical Hail — 2025-06-19

Hail as large as 2.50 inches was reported near (Dik)Dickinson Muni, NORTH DAKOTA. Wind up to 104 mph was reported near Beltrami, MINNESOTA. 34 tornadoes were reported, including one near Ottawa, OHIO. The storm had 25 official hail reports.

Affected states: National, CO, CT, DE, DC, IN, IA, KS, ME, MD, MI, MN, NE, NH, NJ, NY, ND, OH, PA, SD, VT, VA, WV, WI
4.09 inRadar size estimate 1,040,687Population Affected 436,626Houses Affected Hail · Wind · TornadoHazards FreeAccount signup
Odenton, MD — June 18, 2025 — regional hail footprint preview
Storm footprint preview

Local hail summary for the Odenton area: 6.03 square miles of estimated ground-hail footprint; highest mapped band 2+ inches. 0 official hail report(s) within the summary area. Exposure estimates are not confirmed property damage. Open the map to explore the full coverage included in your access. Statistics cover the mapped hail footprint inside the Census boundary of Odenton, MD, not the entire region. The place had 42,947 residents in the 2020 Census. A boundary intersection does not mean the whole community was hit. Estimated housing exposure: 6,917 units in 1-inch-or-larger bands, including 2,897 in 1.5-inch-or-larger bands and 108 in 2-inch-or-larger bands.

Affected states: Odenton area, MD
2+ inRadar size estimate 24,829Population Affected 10,523Houses Affected HailHazards FreeAccount signup
Severn, MD — June 18, 2025 — regional hail footprint preview
Storm footprint preview

Local hail summary for the Severn area: 4.66 square miles of estimated ground-hail footprint; highest mapped band 1.5+ inches. 1 official hail report(s) within the summary area. Exposure estimates are not confirmed property damage. Open the map to explore the full coverage included in your access. Statistics cover the mapped hail footprint inside the Census boundary of Severn, MD, not the entire region. The place had 57,118 residents in the 2020 Census. A boundary intersection does not mean the whole community was hit. Estimated housing exposure: 4,078 units in 1-inch-or-larger bands, including 0 in 1.5-inch-or-larger bands and 0 in 2-inch-or-larger bands.

Affected states: Severn area, MD
1.5+ inRadar size estimate 14,072Population Affected 4,844Houses Affected HailHazards FreeAccount signup
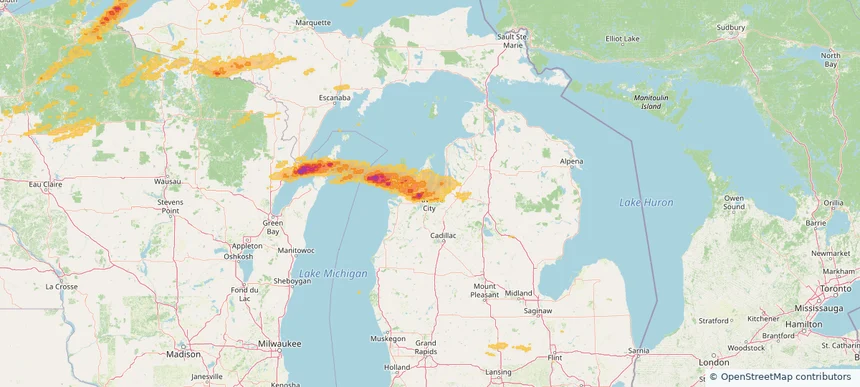
Historical Hail — 2025-06-18 — regional hail footprint preview
Storm footprint preview
Jun 18, 2025 7:00 AM to Jun 19, 2025 7:00 AM CST

Historical Hail — 2025-06-18

Hail as large as 1.25 inches was reported near Delmont, MARYLAND. Wind up to 104 mph was reported near Beltrami, MINNESOTA. 117 tornadoes were reported, including one near Converse, WYOMING. The storm had 6 official hail reports.

Affected states: National, AL, AR, DE, GA, IL, IN, IA, KS, KY, MD, MI, MN, MS, MO, MT, NY, ND, OH, OK, PA, SC, SD, TN, TX, WV
1.99 inRadar size estimate 541,839Population Affected 224,016Houses Affected Hail · Wind · TornadoHazards FreeAccount signup
Andover, KS — June 17, 2025 — regional hail footprint preview
Storm footprint preview

Local hail summary for the Andover area: 2.16 square miles of estimated ground-hail footprint; highest mapped band 1+ inches. 0 official hail report(s) within the summary area. Exposure estimates are not confirmed property damage. Open the map to explore the full coverage included in your access. Statistics cover the mapped hail footprint inside the Census boundary of Andover, KS, not the entire region. The place had 14,892 residents in the 2020 Census. A boundary intersection does not mean the whole community was hit. Estimated housing exposure: 600 units in 1-inch-or-larger bands, including 0 in 1.5-inch-or-larger bands and 0 in 2-inch-or-larger bands.

Affected states: Andover area, KS
1+ inRadar size estimate 2,560Population Affected 788Houses Affected HailHazards FreeAccount signup
Arkansas City, KS — June 17, 2025 — regional hail footprint preview
Storm footprint preview

Local hail summary for the Arkansas City area: 9.34 square miles of estimated ground-hail footprint; highest mapped band 2+ inches. 1 official hail report(s) within the summary area. Exposure estimates are not confirmed property damage. Open the map to explore the full coverage included in your access. Statistics cover the mapped hail footprint inside the Census boundary of Arkansas City, KS, not the entire region. The place had 11,974 residents in the 2020 Census. A boundary intersection does not mean the whole community was hit. Estimated housing exposure: 5,351 units in 1-inch-or-larger bands, including 5,351 in 1.5-inch-or-larger bands and 2,670 in 2-inch-or-larger bands.

Affected states: Arkansas City area, KS
2+ inRadar size estimate 11,916Population Affected 5,351Houses Affected HailHazards FreeAccount signup
Bartlesville, OK — June 17, 2025 — regional hail footprint preview
Storm footprint preview

Local hail summary for the Bartlesville area: 22.69 square miles of estimated ground-hail footprint; highest mapped band 1.5+ inches. 0 official hail report(s) within the summary area. Exposure estimates are not confirmed property damage. Open the map to explore the full coverage included in your access. Statistics cover the mapped hail footprint inside the Census boundary of Bartlesville, OK, not the entire region. The place had 37,290 residents in the 2020 Census. A boundary intersection does not mean the whole community was hit. Estimated housing exposure: 17,144 units in 1-inch-or-larger bands, including 1,840 in 1.5-inch-or-larger bands and 0 in 2-inch-or-larger bands.

Affected states: Bartlesville area, OK
1.5+ inRadar size estimate 37,293Population Affected 17,144Houses Affected HailHazards FreeAccount signup
Storm footprint preview

Local hail summary for the Boulder area: 5.84 square miles of estimated ground-hail footprint; highest mapped band 1+ inches. 0 official hail report(s) within the summary area. Exposure estimates are not confirmed property damage. Open the map to explore the full coverage included in your access. Statistics cover the mapped hail footprint inside the Census boundary of Boulder, CO, not the entire region. The place had 108,250 residents in the 2020 Census. A boundary intersection does not mean the whole community was hit. Estimated housing exposure: 1,789 units in 1-inch-or-larger bands, including 0 in 1.5-inch-or-larger bands and 0 in 2-inch-or-larger bands.

Affected states: Boulder area, CO
1+ inRadar size estimate 18,542Population Affected 8,686Houses Affected HailHazards FreeAccount signup
Storm footprint preview

Local hail summary for the Broomfield area: 26.67 square miles of estimated ground-hail footprint; highest mapped band 1+ inches. 0 official hail report(s) within the summary area. Exposure estimates are not confirmed property damage. Open the map to explore the full coverage included in your access. Statistics cover the mapped hail footprint inside the Census boundary of Broomfield, CO, not the entire region. The place had 74,112 residents in the 2020 Census. A boundary intersection does not mean the whole community was hit. Estimated housing exposure: 17,243 units in 1-inch-or-larger bands, including 0 in 1.5-inch-or-larger bands and 0 in 2-inch-or-larger bands.

Affected states: Broomfield area, CO
1+ inRadar size estimate 62,726Population Affected 24,708Houses Affected HailHazards FreeAccount signup
Storm footprint preview

Local hail summary for the Colorado Springs area: 14.54 square miles of estimated ground-hail footprint; highest mapped band 1+ inches. 3 official hail report(s) within the summary area. Exposure estimates are not confirmed property damage. Open the map to explore the full coverage included in your access. Statistics cover the mapped hail footprint inside the Census boundary of Colorado Springs, CO, not the entire region. The place had 478,961 residents in the 2020 Census. A boundary intersection does not mean the whole community was hit. Estimated housing exposure: 2,089 units in 1-inch-or-larger bands, including 0 in 1.5-inch-or-larger bands and 0 in 2-inch-or-larger bands.

Affected states: Colorado Springs area, CO
1+ inRadar size estimate 30,996Population Affected 13,383Houses Affected HailHazards FreeAccount signup
Storm footprint preview

Local hail summary for the Erie area: 17.00 square miles of estimated ground-hail footprint; highest mapped band 1.5+ inches. 0 official hail report(s) within the summary area. Exposure estimates are not confirmed property damage. Open the map to explore the full coverage included in your access. Statistics cover the mapped hail footprint inside the Census boundary of Erie, CO, not the entire region. The place had 30,038 residents in the 2020 Census. A boundary intersection does not mean the whole community was hit. Estimated housing exposure: 4,614 units in 1-inch-or-larger bands, including 0 in 1.5-inch-or-larger bands and 0 in 2-inch-or-larger bands.

Affected states: Erie area, CO
1.5+ inRadar size estimate 29,961Population Affected 10,298Houses Affected HailHazards FreeAccount signup
Storm footprint preview

Local hail summary for the Evans area: 7.89 square miles of estimated ground-hail footprint; highest mapped band 1+ inches. 0 official hail report(s) within the summary area. Exposure estimates are not confirmed property damage. Open the map to explore the full coverage included in your access. Statistics cover the mapped hail footprint inside the Census boundary of Evans, CO, not the entire region. The place had 22,165 residents in the 2020 Census. A boundary intersection does not mean the whole community was hit. Estimated housing exposure: 2,423 units in 1-inch-or-larger bands, including 0 in 1.5-inch-or-larger bands and 0 in 2-inch-or-larger bands.

Affected states: Evans area, CO
1+ inRadar size estimate 14,468Population Affected 5,011Houses Affected HailHazards FreeAccount signup
Storm footprint preview

Local hail summary for the Federal Heights area: 1.42 square miles of estimated ground-hail footprint; highest mapped band 1+ inches. 0 official hail report(s) within the summary area. Exposure estimates are not confirmed property damage. Open the map to explore the full coverage included in your access. Statistics cover the mapped hail footprint inside the Census boundary of Federal Heights, CO, not the entire region. The place had 14,382 residents in the 2020 Census. A boundary intersection does not mean the whole community was hit. Estimated housing exposure: 2,322 units in 1-inch-or-larger bands, including 0 in 1.5-inch-or-larger bands and 0 in 2-inch-or-larger bands.

Affected states: Federal Heights area, CO
1+ inRadar size estimate 13,078Population Affected 4,929Houses Affected HailHazards FreeAccount signup
Storm footprint preview

Local hail summary for the Firestone area: 7.06 square miles of estimated ground-hail footprint; highest mapped band 1.5+ inches. 0 official hail report(s) within the summary area. Exposure estimates are not confirmed property damage. Open the map to explore the full coverage included in your access. Statistics cover the mapped hail footprint inside the Census boundary of Firestone, CO, not the entire region. The place had 16,381 residents in the 2020 Census. A boundary intersection does not mean the whole community was hit. Estimated housing exposure: 2,178 units in 1-inch-or-larger bands, including 28 in 1.5-inch-or-larger bands and 0 in 2-inch-or-larger bands.

Affected states: Firestone area, CO
1.5+ inRadar size estimate 11,492Population Affected 3,714Houses Affected HailHazards FreeAccount signup
Storm footprint preview

Local hail summary for the Fort Collins area: 26.85 square miles of estimated ground-hail footprint; highest mapped band 1+ inches. 0 official hail report(s) within the summary area. Exposure estimates are not confirmed property damage. Open the map to explore the full coverage included in your access. Statistics cover the mapped hail footprint inside the Census boundary of Fort Collins, CO, not the entire region. The place had 169,810 residents in the 2020 Census. A boundary intersection does not mean the whole community was hit. Estimated housing exposure: 6,948 units in 1-inch-or-larger bands, including 0 in 1.5-inch-or-larger bands and 0 in 2-inch-or-larger bands.

Affected states: Fort Collins area, CO
1+ inRadar size estimate 81,742Population Affected 34,209Houses Affected HailHazards FreeAccount signup
Storm footprint preview

Local hail summary for the Greeley area: 17.19 square miles of estimated ground-hail footprint; highest mapped band 1+ inches. 0 official hail report(s) within the summary area. Exposure estimates are not confirmed property damage. Open the map to explore the full coverage included in your access. Statistics cover the mapped hail footprint inside the Census boundary of Greeley, CO, not the entire region. The place had 108,795 residents in the 2020 Census. A boundary intersection does not mean the whole community was hit. Estimated housing exposure: 6,337 units in 1-inch-or-larger bands, including 0 in 1.5-inch-or-larger bands and 0 in 2-inch-or-larger bands.

Affected states: Greeley area, CO
1+ inRadar size estimate 52,332Population Affected 20,825Houses Affected HailHazards FreeAccount signup
Page 82 of 99
‹ 1 81 82 83 99 ›

Frequently asked questions

Can I search hail maps by coverage area?

Yes. The storm library supports coverage-area filtering so you can find hail maps and hail swaths in a target service area.

What kinds of storms appear in the HailMapr library?

The library focuses on published hail events, including ready storm maps and live storms once hail has been detected and a public swath is available.

Are HailMapr storm pages useful for roofers and adjusters?

Yes. They are built to help roofers, adjusters, restoration teams, and property owners review storm footprints before purchase.