Storm library

Browse live and recent hail maps.

Review storm footprints, hail swaths, reports, and replay access. Create a free account to save your setup and move into map access when a storm matters.

Search filters
Clear
Newest storms first by default.
Don't see your storm? Request a qualifying storm map and we'll email you when it is ready.
Showing 1753-1776 of 2395 storms · Page 74 of 100
‹ 1 73 74 75 100 ›
Request a storm map

Tell us about the storm and we'll build the map. Once it's published you'll get an email and can purchase it from the library — just like any other event.

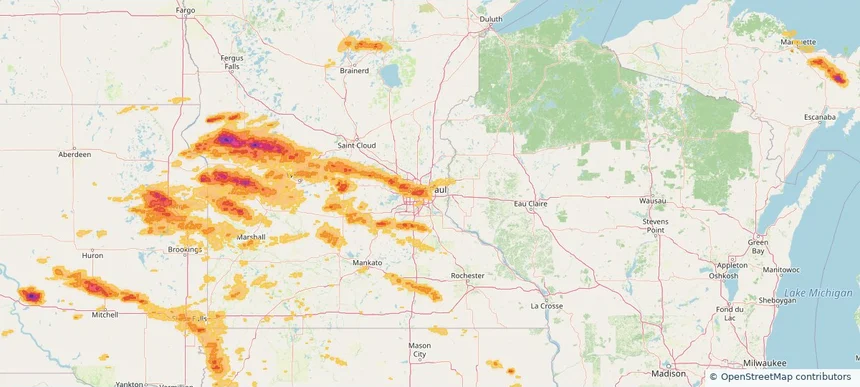
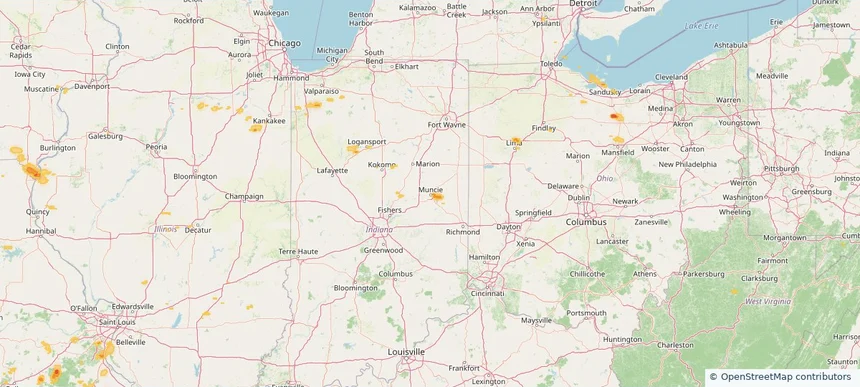
Muncie, IN — July 30, 2025 — regional hail footprint preview
Storm footprint preview

Local hail summary for the Muncie area: 1.61 square miles of estimated ground-hail footprint; highest mapped band 1+ inches. 0 official hail report(s) within the summary area. Exposure estimates are not confirmed property damage. Open the map to explore the full coverage included in your access. Statistics cover the mapped hail footprint inside the Census boundary of Muncie, IN, not the entire region. The place had 65,194 residents in the 2020 Census. A boundary intersection does not mean the whole community was hit. Estimated housing exposure: 115 units in 1-inch-or-larger bands, including 0 in 1.5-inch-or-larger bands and 0 in 2-inch-or-larger bands.

Affected states: Muncie area, IN
1+ inRadar size estimate 1,498Population Affected 734Houses Affected HailHazards FreeAccount signup
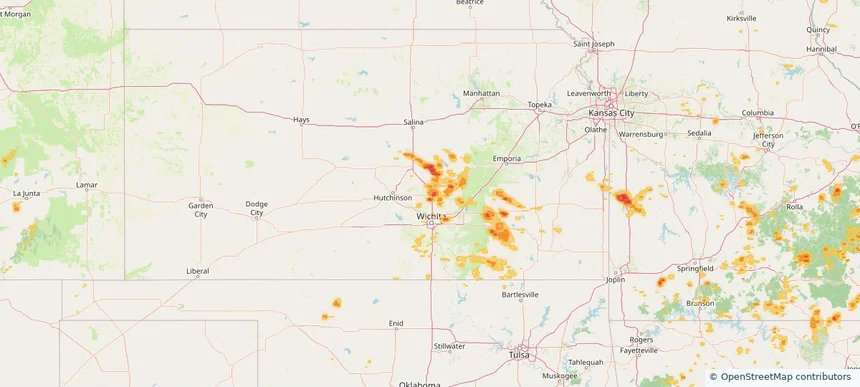
Newton, KS — July 30, 2025 — regional hail footprint preview
Storm footprint preview

Local hail summary for the Newton area: 9.83 square miles of estimated ground-hail footprint; highest mapped band 1.5+ inches. 0 official hail report(s) within the summary area. Exposure estimates are not confirmed property damage. Open the map to explore the full coverage included in your access. Statistics cover the mapped hail footprint inside the Census boundary of Newton, KS, not the entire region. The place had 18,602 residents in the 2020 Census. A boundary intersection does not mean the whole community was hit. Estimated housing exposure: 6,277 units in 1-inch-or-larger bands, including 283 in 1.5-inch-or-larger bands and 0 in 2-inch-or-larger bands.

Affected states: Newton area, KS
1.5+ inRadar size estimate 15,396Population Affected 6,943Houses Affected HailHazards FreeAccount signup
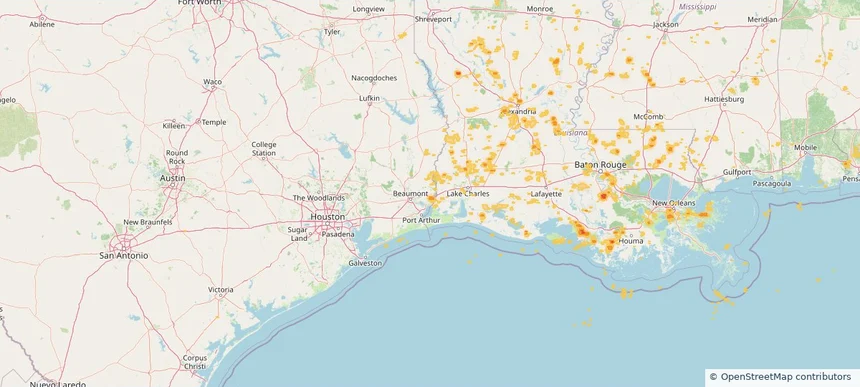
Orange, TX — July 30, 2025 — regional hail footprint preview
Storm footprint preview

Local hail summary for the Orange area: 3.64 square miles of estimated ground-hail footprint; highest mapped band 1+ inches. 0 official hail report(s) within the summary area. Exposure estimates are not confirmed property damage. Open the map to explore the full coverage included in your access. Statistics cover the mapped hail footprint inside the Census boundary of Orange, TX, not the entire region. The place had 19,324 residents in the 2020 Census. A boundary intersection does not mean the whole community was hit. Estimated housing exposure: 1,433 units in 1-inch-or-larger bands, including 0 in 1.5-inch-or-larger bands and 0 in 2-inch-or-larger bands.

Affected states: Orange area, TX
1+ inRadar size estimate 3,461Population Affected 1,517Houses Affected HailHazards FreeAccount signup
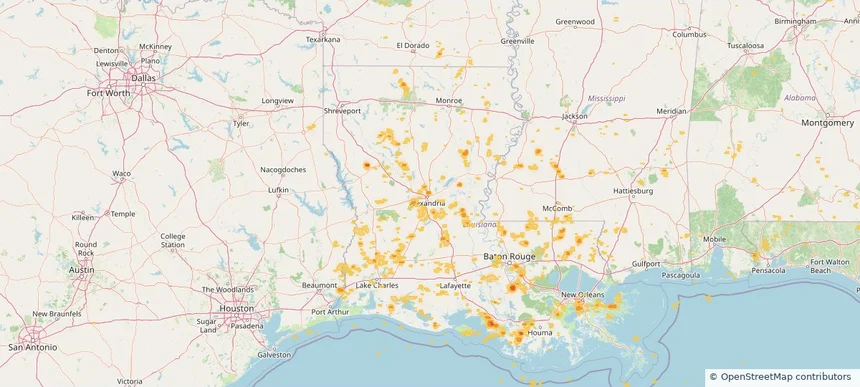
Pineville, LA — July 30, 2025 — regional hail footprint preview
Storm footprint preview

Local hail summary for the Pineville area: 1.05 square miles of estimated ground-hail footprint; highest mapped band 1+ inches. 0 official hail report(s) within the summary area. Exposure estimates are not confirmed property damage. Open the map to explore the full coverage included in your access. Statistics cover the mapped hail footprint inside the Census boundary of Pineville, LA, not the entire region. The place had 14,384 residents in the 2020 Census. A boundary intersection does not mean the whole community was hit. Estimated housing exposure: 257 units in 1-inch-or-larger bands, including 0 in 1.5-inch-or-larger bands and 0 in 2-inch-or-larger bands.

Affected states: Pineville area, LA
1+ inRadar size estimate 514Population Affected 303Houses Affected HailHazards FreeAccount signup
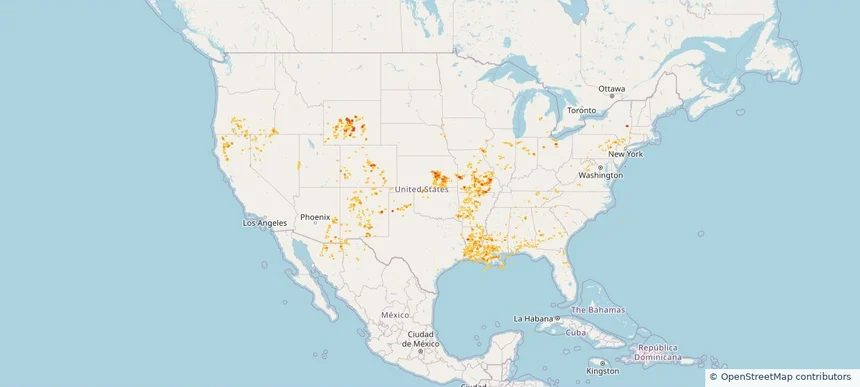
Historical Hail — 2025-07-30 — regional hail footprint preview
Storm footprint preview
Jul 30, 2025 7:00 AM to Jul 31, 2025 7:00 AM CST

Historical Hail — 2025-07-30

Hail as large as 1.00 inches was reported near Mooar, IOWA. Wind up to 83 mph was reported near 1 mile west-southwest of Allison, NM. 12 tornadoes were reported, including one near Bernalillo, NEW MEXICO. The storm had 2 official hail reports.

Affected states: National, AL, AZ, AR, CA, CO, CT, FL, GA, ID, IL, IN, IA, KS, LA, MS, MO, NE, NV, NM, NY, OH, OK, OR, PA, TN, TX, UT, VA, WV, WY
2.5 inRadar size estimate 508,659Population Affected 225,784Houses Affected Hail · Wind · TornadoHazards FreeAccount signup
Clive, IA — July 29, 2025 — regional hail footprint preview
Storm footprint preview

Local hail summary for the Clive area: 1.46 square miles of estimated ground-hail footprint; highest mapped band 1+ inches. 0 official hail report(s) within the summary area. Exposure estimates are not confirmed property damage. Open the map to explore the full coverage included in your access. Statistics cover the mapped hail footprint inside the Census boundary of Clive, IA, not the entire region. The place had 18,601 residents in the 2020 Census. A boundary intersection does not mean the whole community was hit. Estimated housing exposure: 608 units in 1-inch-or-larger bands, including 0 in 1.5-inch-or-larger bands and 0 in 2-inch-or-larger bands.

Affected states: Clive area, IA
1+ inRadar size estimate 4,226Population Affected 1,574Houses Affected HailHazards FreeAccount signup
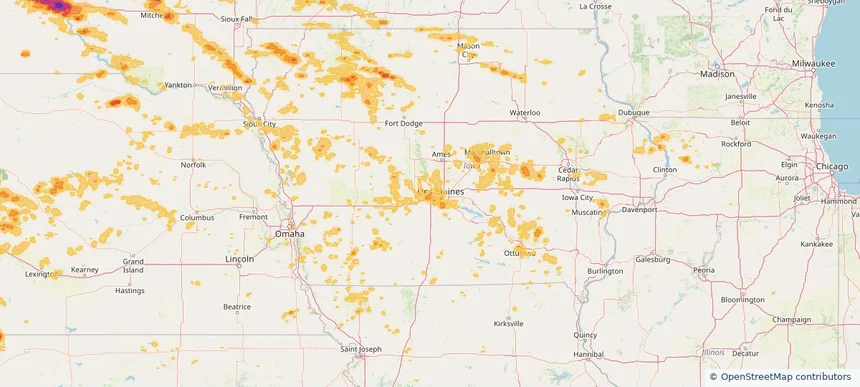
Des Moines, IA — July 29, 2025 — regional hail footprint preview
Storm footprint preview

Local hail summary for the Des Moines area: 9.28 square miles of estimated ground-hail footprint; highest mapped band 1+ inches. 0 official hail report(s) within the summary area. Exposure estimates are not confirmed property damage. Open the map to explore the full coverage included in your access. Statistics cover the mapped hail footprint inside the Census boundary of Des Moines, IA, not the entire region. The place had 214,133 residents in the 2020 Census. A boundary intersection does not mean the whole community was hit. Estimated housing exposure: 3,777 units in 1-inch-or-larger bands, including 0 in 1.5-inch-or-larger bands and 0 in 2-inch-or-larger bands.

Affected states: Des Moines area, IA
1+ inRadar size estimate 13,257Population Affected 6,036Houses Affected HailHazards FreeAccount signup
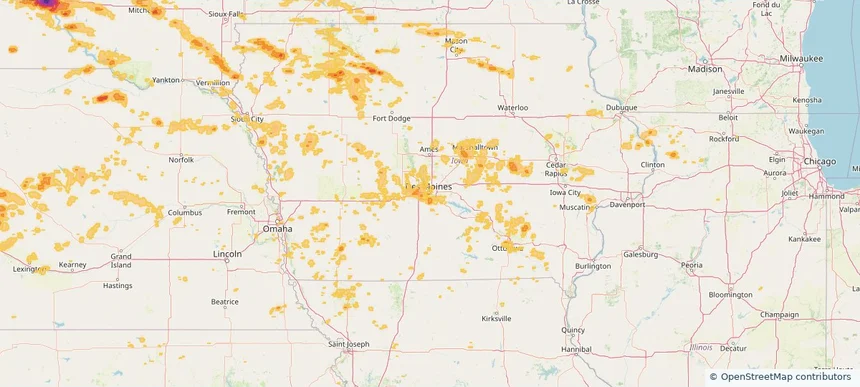
Mitchell, SD — July 29, 2025 — regional hail footprint preview
Storm footprint preview

Local hail summary for the Mitchell area: 6.29 square miles of estimated ground-hail footprint; highest mapped band 1+ inches. 0 official hail report(s) within the summary area. Exposure estimates are not confirmed property damage. Open the map to explore the full coverage included in your access. Statistics cover the mapped hail footprint inside the Census boundary of Mitchell, SD, not the entire region. The place had 15,660 residents in the 2020 Census. A boundary intersection does not mean the whole community was hit. Estimated housing exposure: 1,992 units in 1-inch-or-larger bands, including 0 in 1.5-inch-or-larger bands and 0 in 2-inch-or-larger bands.

Affected states: Mitchell area, SD
1+ inRadar size estimate 4,779Population Affected 2,339Houses Affected HailHazards FreeAccount signup
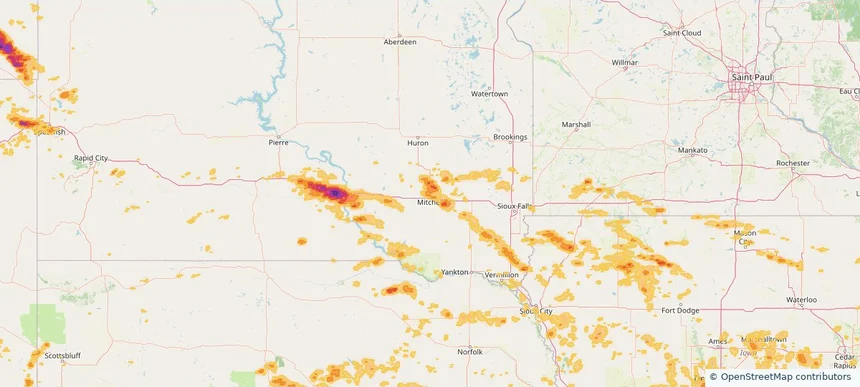
Pueblo, CO — July 29, 2025 — regional hail footprint preview
Storm footprint preview

Local hail summary for the Pueblo area: 3.93 square miles of estimated ground-hail footprint; highest mapped band 1.5+ inches. 0 official hail report(s) within the summary area. Exposure estimates are not confirmed property damage. Open the map to explore the full coverage included in your access. Statistics cover the mapped hail footprint inside the Census boundary of Pueblo, CO, not the entire region. The place had 111,876 residents in the 2020 Census. A boundary intersection does not mean the whole community was hit. Estimated housing exposure: 1,683 units in 1-inch-or-larger bands, including 0 in 1.5-inch-or-larger bands and 0 in 2-inch-or-larger bands.

Affected states: Pueblo area, CO
1.5+ inRadar size estimate 10,399Population Affected 4,325Houses Affected HailHazards FreeAccount signup
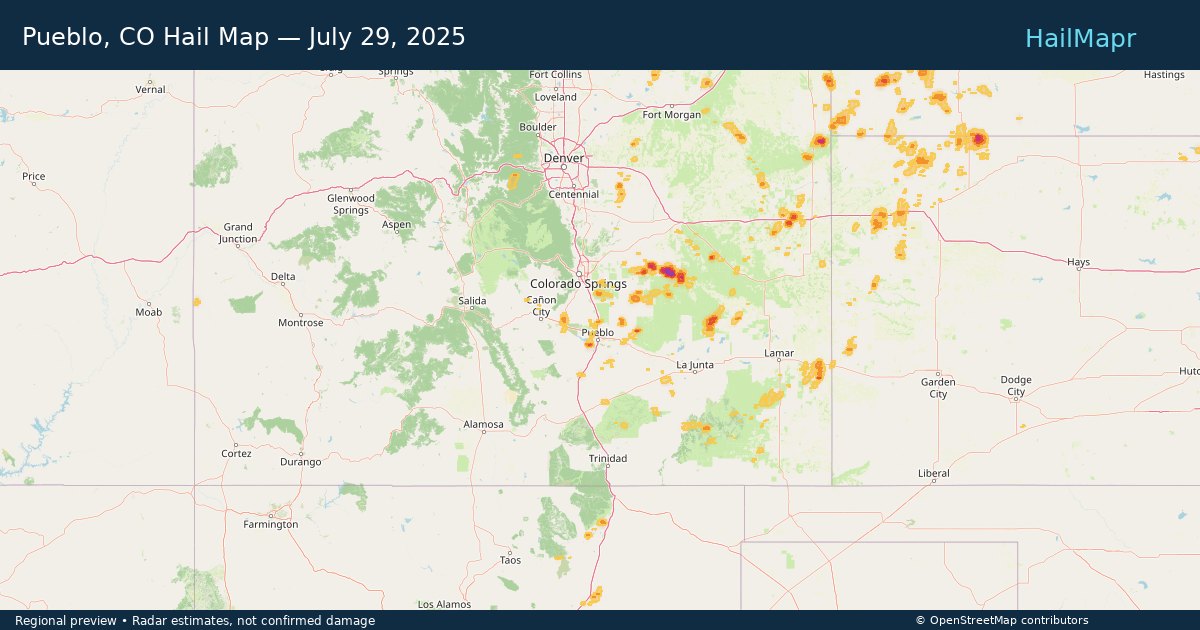
Warner Robins, GA — July 29, 2025 — regional hail footprint preview
Storm footprint preview

Local hail summary for the Warner Robins area: 0.86 square miles of estimated ground-hail footprint; highest mapped band 1+ inches. 0 official hail report(s) within the summary area. Exposure estimates are not confirmed property damage. Open the map to explore the full coverage included in your access. Statistics cover the mapped hail footprint inside the Census boundary of Warner Robins, GA, not the entire region. The place had 80,308 residents in the 2020 Census. A boundary intersection does not mean the whole community was hit. Estimated housing exposure: 137 units in 1-inch-or-larger bands, including 0 in 1.5-inch-or-larger bands and 0 in 2-inch-or-larger bands.

Affected states: Warner Robins area, GA
1+ inRadar size estimate 921Population Affected 344Houses Affected HailHazards FreeAccount signup
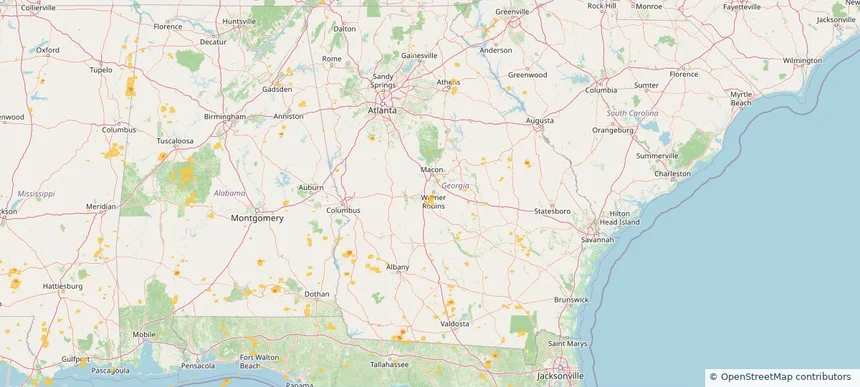
Waukee, IA — July 29, 2025 — regional hail footprint preview
Storm footprint preview

Local hail summary for the Waukee area: 2.93 square miles of estimated ground-hail footprint; highest mapped band 1+ inches. 0 official hail report(s) within the summary area. Exposure estimates are not confirmed property damage. Open the map to explore the full coverage included in your access. Statistics cover the mapped hail footprint inside the Census boundary of Waukee, IA, not the entire region. The place had 23,940 residents in the 2020 Census. A boundary intersection does not mean the whole community was hit. Estimated housing exposure: 262 units in 1-inch-or-larger bands, including 0 in 1.5-inch-or-larger bands and 0 in 2-inch-or-larger bands.

Affected states: Waukee area, IA
1+ inRadar size estimate 3,824Population Affected 1,267Houses Affected HailHazards FreeAccount signup
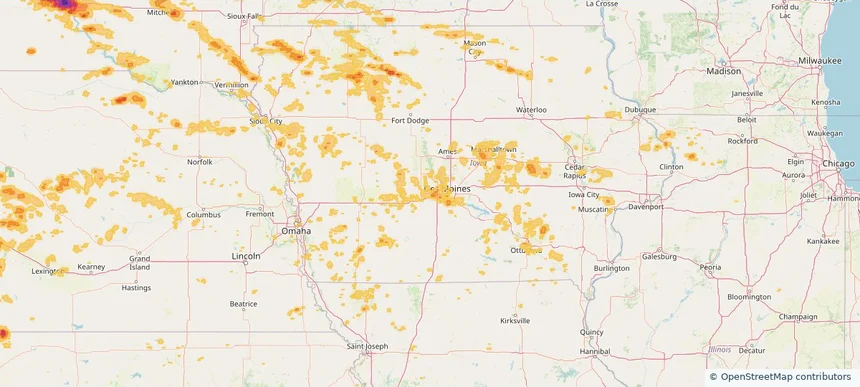
West Des Moines, IA — July 29, 2025 — regional hail footprint preview
Storm footprint preview

Local hail summary for the West Des Moines area: 11.67 square miles of estimated ground-hail footprint; highest mapped band 1+ inches. 0 official hail report(s) within the summary area. Exposure estimates are not confirmed property damage. Open the map to explore the full coverage included in your access. Statistics cover the mapped hail footprint inside the Census boundary of West Des Moines, IA, not the entire region. The place had 68,723 residents in the 2020 Census. A boundary intersection does not mean the whole community was hit. Estimated housing exposure: 315 units in 1-inch-or-larger bands, including 0 in 1.5-inch-or-larger bands and 0 in 2-inch-or-larger bands.

Affected states: West Des Moines area, IA
1+ inRadar size estimate 27,716Population Affected 12,569Houses Affected HailHazards FreeAccount signup
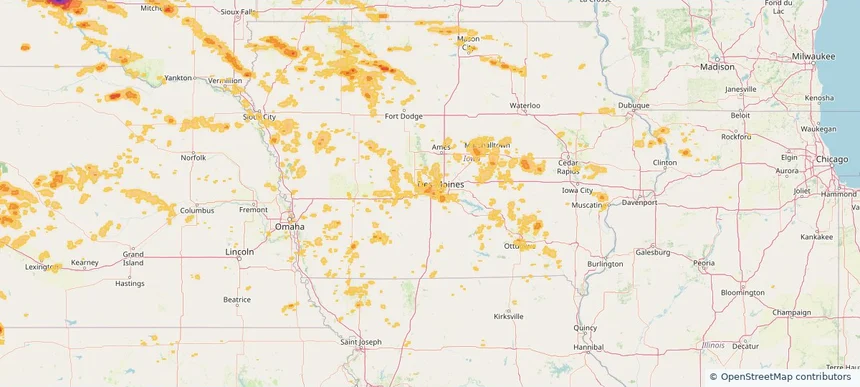
Historical Hail — 2025-07-29 — regional hail footprint preview
Storm footprint preview
Jul 29, 2025 7:00 AM to Jul 30, 2025 7:00 AM CST

Historical Hail — 2025-07-29

Hail as large as 1.75 inches was reported near Volborg, MONTANA. Wind up to 100 mph was reported near Nd, ND. 8 tornadoes were reported, including one near Lyon, IOWA. The storm had 7 official hail reports.

Affected states: National, AL, AZ, AR, CA, CO, FL, GA, ID, IL, IA, KS, LA, MN, MS, MO, MT, NE, NV, NM, ND, OR, SC, SD, TN, TX, UT, WY
4.18 inRadar size estimate 704,974Population Affected 317,473Houses Affected Hail · Wind · TornadoHazards FreeAccount signup
Billings, MT — July 28, 2025 — regional hail footprint preview
Storm footprint preview

Local hail summary for the Billings area: 5.89 square miles of estimated ground-hail footprint; highest mapped band 1.5+ inches. 2 official hail report(s) within the summary area. Exposure estimates are not confirmed property damage. Open the map to explore the full coverage included in your access. Statistics cover the mapped hail footprint inside the Census boundary of Billings, MT, not the entire region. The place had 117,116 residents in the 2020 Census. A boundary intersection does not mean the whole community was hit. Estimated housing exposure: 1,020 units in 1-inch-or-larger bands, including 301 in 1.5-inch-or-larger bands and 0 in 2-inch-or-larger bands.

Affected states: Billings area, MT
1.5+ inRadar size estimate 8,166Population Affected 3,303Houses Affected HailHazards FreeAccount signup
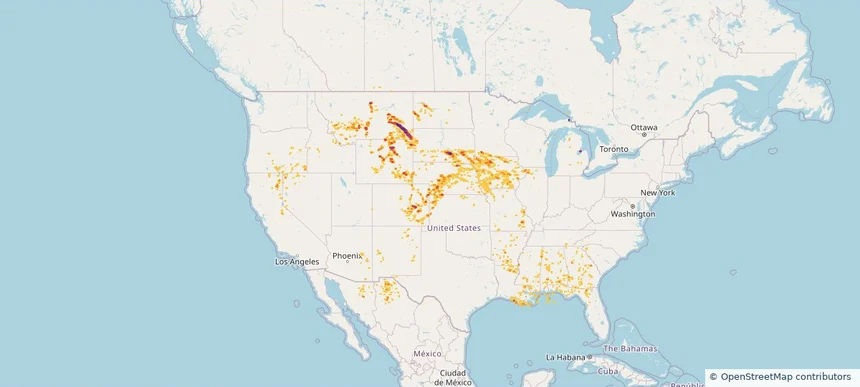
Mason City, IA — July 28, 2025 — regional hail footprint preview
Storm footprint preview

Local hail summary for the Mason City area: 19.64 square miles of estimated ground-hail footprint; highest mapped band 1+ inches. 0 official hail report(s) within the summary area. Exposure estimates are not confirmed property damage. Open the map to explore the full coverage included in your access. Statistics cover the mapped hail footprint inside the Census boundary of Mason City, IA, not the entire region. The place had 27,338 residents in the 2020 Census. A boundary intersection does not mean the whole community was hit. Estimated housing exposure: 1,213 units in 1-inch-or-larger bands, including 0 in 1.5-inch-or-larger bands and 0 in 2-inch-or-larger bands.

Affected states: Mason City area, IA
1+ inRadar size estimate 23,203Population Affected 11,369Houses Affected HailHazards FreeAccount signup
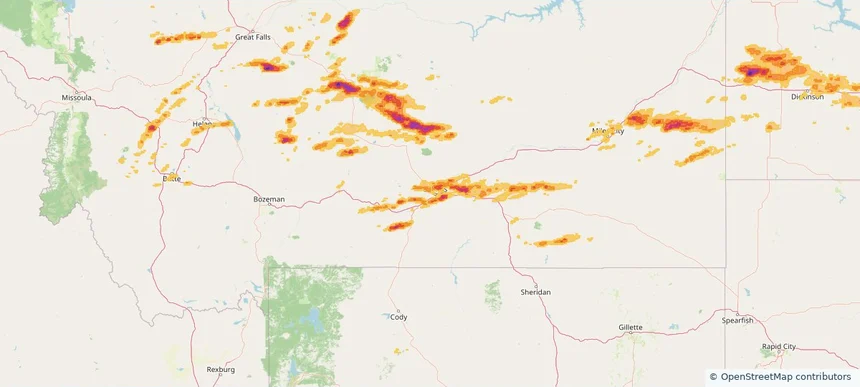
Historical Hail — 2025-07-28 — regional hail footprint preview
Storm footprint preview
Jul 28, 2025 7:00 AM to Jul 29, 2025 7:00 AM CST

Historical Hail — 2025-07-28

Hail as large as 2.75 inches was reported near Cresbard, SOUTH DAKOTA. Wind up to 115 mph was reported near Sd, SD. 22 tornadoes were reported, including one near Lyon, IOWA. The storm had 24 official hail reports.

Affected states: National, IL, IA, MN, MT, NE, ND, SD, WI
3.23 inRadar size estimate 424,526Population Affected 194,477Houses Affected Hail · Wind · TornadoHazards FreeAccount signup
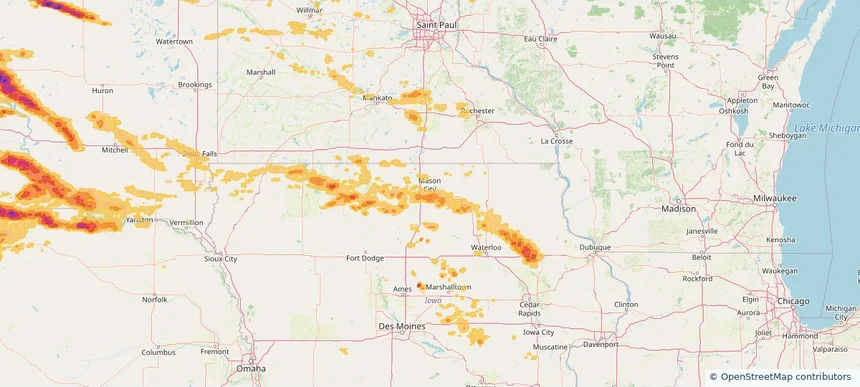
Brooklyn Park, MN — July 27, 2025 — regional hail footprint preview
Storm footprint preview

Local hail summary for the Brooklyn Park area: 5.80 square miles of estimated ground-hail footprint; highest mapped band 1+ inches. 0 official hail report(s) within the summary area. Exposure estimates are not confirmed property damage. Open the map to explore the full coverage included in your access. Statistics cover the mapped hail footprint inside the Census boundary of Brooklyn Park, MN, not the entire region. The place had 86,478 residents in the 2020 Census. A boundary intersection does not mean the whole community was hit. Estimated housing exposure: 4,077 units in 1-inch-or-larger bands, including 0 in 1.5-inch-or-larger bands and 0 in 2-inch-or-larger bands.

Affected states: Brooklyn Park area, MN
1+ inRadar size estimate 21,853Population Affected 8,187Houses Affected HailHazards FreeAccount signup
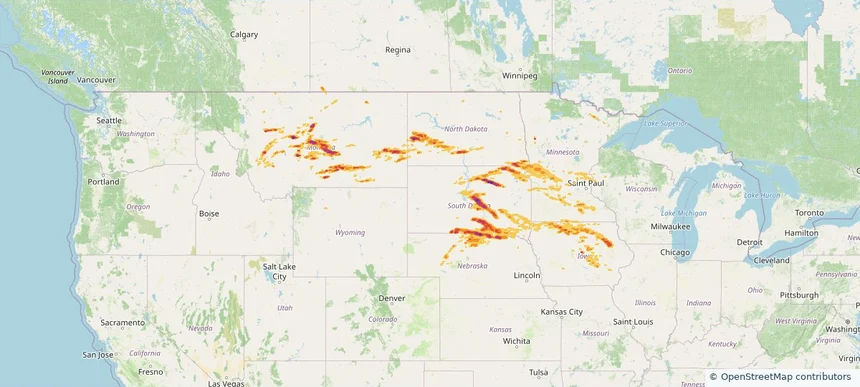
Buffalo, MN — July 27, 2025 — regional hail footprint preview
Storm footprint preview

Local hail summary for the Buffalo area: 7.25 square miles of estimated ground-hail footprint; highest mapped band 1+ inches. 0 official hail report(s) within the summary area. Exposure estimates are not confirmed property damage. Open the map to explore the full coverage included in your access. Statistics cover the mapped hail footprint inside the Census boundary of Buffalo, MN, not the entire region. The place had 16,168 residents in the 2020 Census. A boundary intersection does not mean the whole community was hit. Estimated housing exposure: 3,453 units in 1-inch-or-larger bands, including 0 in 1.5-inch-or-larger bands and 0 in 2-inch-or-larger bands.

Affected states: Buffalo area, MN
1+ inRadar size estimate 12,380Population Affected 5,016Houses Affected HailHazards FreeAccount signup
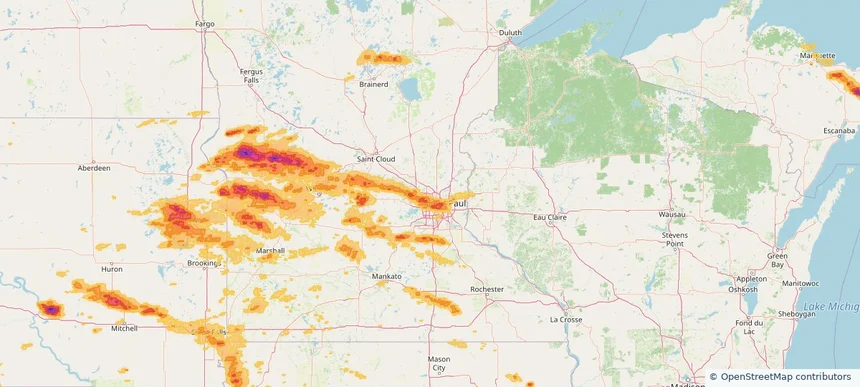
Columbia Heights, MN — July 27, 2025 — regional hail footprint preview
Storm footprint preview

Local hail summary for the Columbia Heights area: 2.17 square miles of estimated ground-hail footprint; highest mapped band 1+ inches. 0 official hail report(s) within the summary area. Exposure estimates are not confirmed property damage. Open the map to explore the full coverage included in your access. Statistics cover the mapped hail footprint inside the Census boundary of Columbia Heights, MN, not the entire region. The place had 21,973 residents in the 2020 Census. A boundary intersection does not mean the whole community was hit. Estimated housing exposure: 861 units in 1-inch-or-larger bands, including 0 in 1.5-inch-or-larger bands and 0 in 2-inch-or-larger bands.

Affected states: Columbia Heights area, MN
1+ inRadar size estimate 14,076Population Affected 6,077Houses Affected HailHazards FreeAccount signup
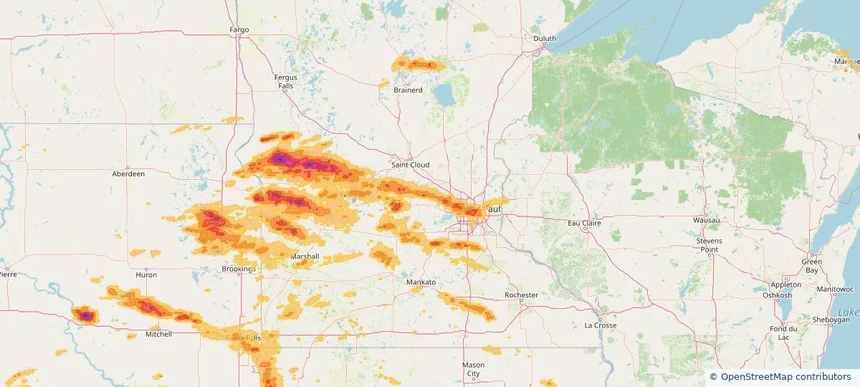
Crystal, MN — July 27, 2025 — regional hail footprint preview
Storm footprint preview

Local hail summary for the Crystal area: 5.77 square miles of estimated ground-hail footprint; highest mapped band 1+ inches. 0 official hail report(s) within the summary area. Exposure estimates are not confirmed property damage. Open the map to explore the full coverage included in your access. Statistics cover the mapped hail footprint inside the Census boundary of Crystal, MN, not the entire region. The place had 23,330 residents in the 2020 Census. A boundary intersection does not mean the whole community was hit. Estimated housing exposure: 8,172 units in 1-inch-or-larger bands, including 0 in 1.5-inch-or-larger bands and 0 in 2-inch-or-larger bands.

Affected states: Crystal area, MN
1+ inRadar size estimate 22,689Population Affected 9,530Houses Affected HailHazards FreeAccount signup
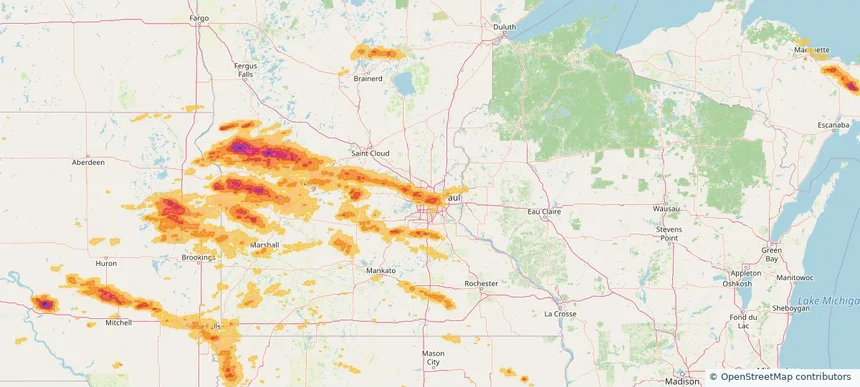
Golden Valley, MN — July 27, 2025 — regional hail footprint preview
Storm footprint preview

Local hail summary for the Golden Valley area: 4.69 square miles of estimated ground-hail footprint; highest mapped band 1+ inches. 0 official hail report(s) within the summary area. Exposure estimates are not confirmed property damage. Open the map to explore the full coverage included in your access. Statistics cover the mapped hail footprint inside the Census boundary of Golden Valley, MN, not the entire region. The place had 22,552 residents in the 2020 Census. A boundary intersection does not mean the whole community was hit. Estimated housing exposure: 2,198 units in 1-inch-or-larger bands, including 0 in 1.5-inch-or-larger bands and 0 in 2-inch-or-larger bands.

Affected states: Golden Valley area, MN
1+ inRadar size estimate 9,802Population Affected 4,532Houses Affected HailHazards FreeAccount signup
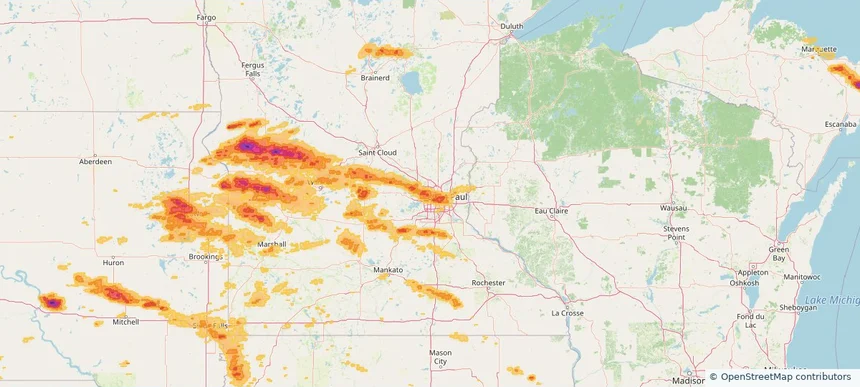
Little Canada, MN — July 27, 2025 — regional hail footprint preview
Storm footprint preview

Local hail summary for the Little Canada area: 1.56 square miles of estimated ground-hail footprint; highest mapped band 1+ inches. 0 official hail report(s) within the summary area. Exposure estimates are not confirmed property damage. Open the map to explore the full coverage included in your access. Statistics cover the mapped hail footprint inside the Census boundary of Little Canada, MN, not the entire region. The place had 10,819 residents in the 2020 Census. A boundary intersection does not mean the whole community was hit. Estimated housing exposure: 2,259 units in 1-inch-or-larger bands, including 0 in 1.5-inch-or-larger bands and 0 in 2-inch-or-larger bands.

Affected states: Little Canada area, MN
1+ inRadar size estimate 4,726Population Affected 2,310Houses Affected HailHazards FreeAccount signup
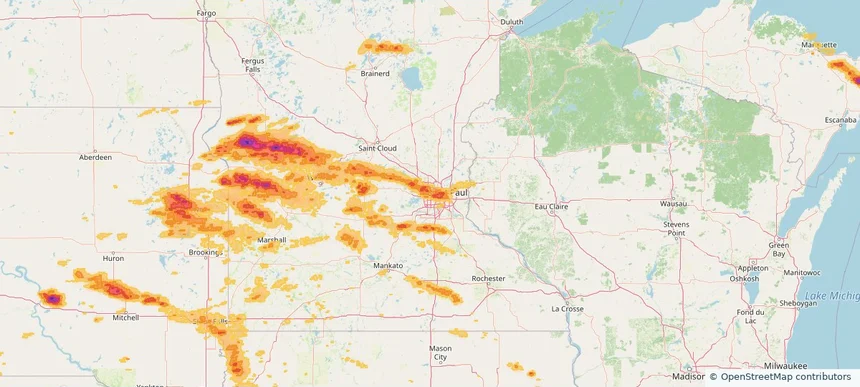
Maple Grove, MN — July 27, 2025 — regional hail footprint preview
Storm footprint preview

Local hail summary for the Maple Grove area: 12.43 square miles of estimated ground-hail footprint; highest mapped band 1.5+ inches. 0 official hail report(s) within the summary area. Exposure estimates are not confirmed property damage. Open the map to explore the full coverage included in your access. Statistics cover the mapped hail footprint inside the Census boundary of Maple Grove, MN, not the entire region. The place had 70,253 residents in the 2020 Census. A boundary intersection does not mean the whole community was hit. Estimated housing exposure: 9,504 units in 1-inch-or-larger bands, including 1,000 in 1.5-inch-or-larger bands and 0 in 2-inch-or-larger bands.

Affected states: Maple Grove area, MN
1.5+ inRadar size estimate 26,851Population Affected 10,025Houses Affected HailHazards FreeAccount signup
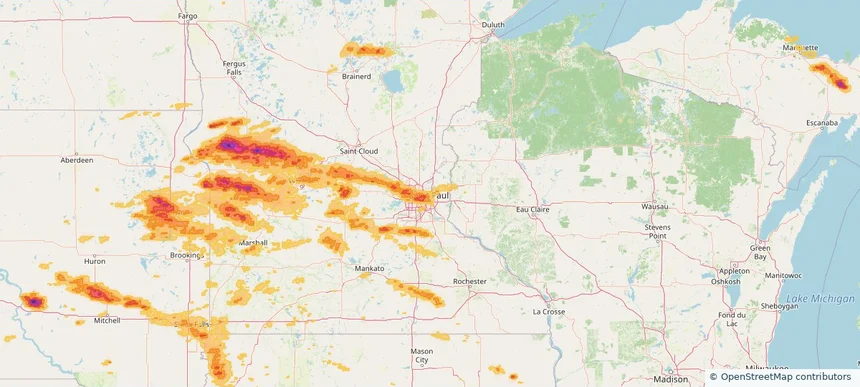
Maplewood, MN — July 27, 2025 — regional hail footprint preview
Storm footprint preview

Local hail summary for the Maplewood area: 2.37 square miles of estimated ground-hail footprint; highest mapped band 1+ inches. 0 official hail report(s) within the summary area. Exposure estimates are not confirmed property damage. Open the map to explore the full coverage included in your access. Statistics cover the mapped hail footprint inside the Census boundary of Maplewood, MN, not the entire region. The place had 42,088 residents in the 2020 Census. A boundary intersection does not mean the whole community was hit. Estimated housing exposure: 2,470 units in 1-inch-or-larger bands, including 0 in 1.5-inch-or-larger bands and 0 in 2-inch-or-larger bands.

Affected states: Maplewood area, MN
1+ inRadar size estimate 6,758Population Affected 2,527Houses Affected HailHazards FreeAccount signup
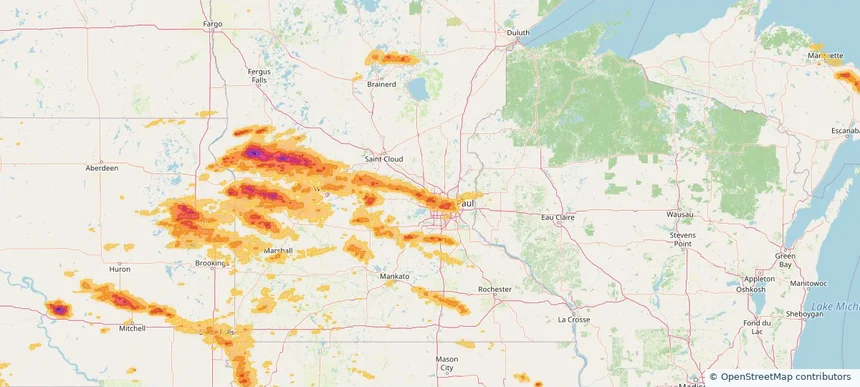
Page 74 of 100
‹ 1 73 74 75 100 ›

Frequently asked questions

Can I search hail maps by coverage area?

Yes. The storm library supports coverage-area filtering so you can find hail maps and hail swaths in a target service area.

What kinds of storms appear in the HailMapr library?

The library focuses on published hail events, including ready storm maps and live storms once hail has been detected and a public swath is available.

Are HailMapr storm pages useful for roofers and adjusters?

Yes. They are built to help roofers, adjusters, restoration teams, and property owners review storm footprints before purchase.