
Storm library

Browse live and recent hail maps.

Review storm footprints, hail swaths, reports, and replay access. Create a free account to save your setup and move into map access when a storm matters.

Search filters
Clear
Newest storms first by default.
Don't see your storm? Request a qualifying storm map and we'll email you when it is ready.
Showing 1681-1704 of 2395 storms · Page 71 of 100
‹ 1 70 71 72 100 ›
Request a storm map

Tell us about the storm and we'll build the map. Once it's published you'll get an email and can purchase it from the library — just like any other event.

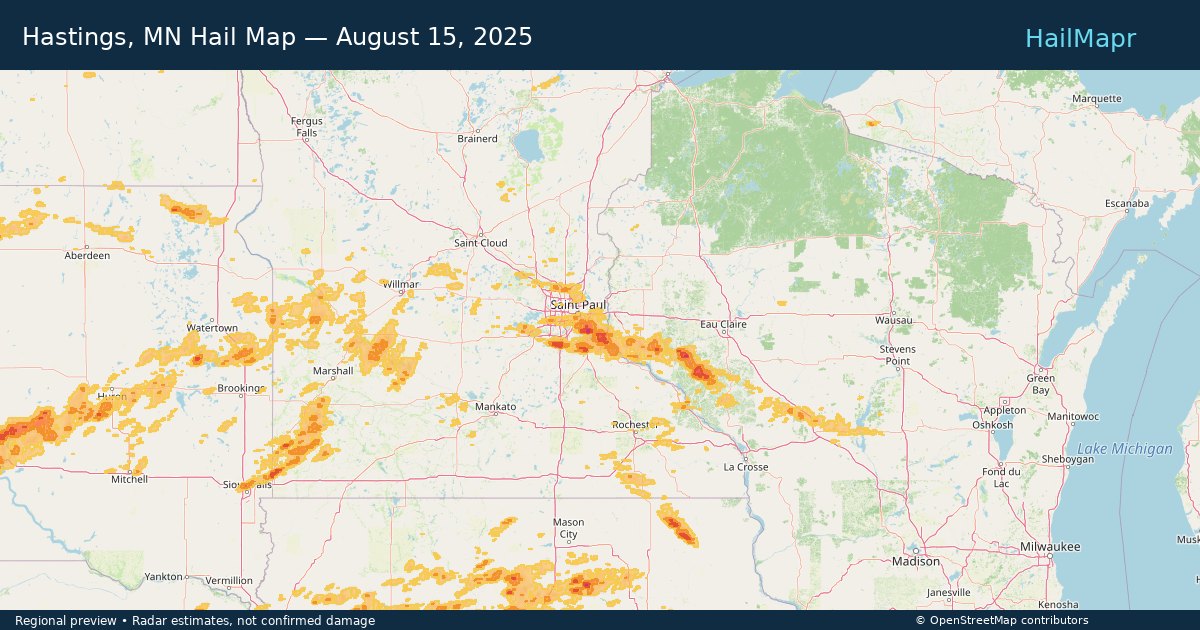
Hastings, MN — August 15, 2025 — regional hail footprint preview
Storm footprint preview

Local hail summary for the Hastings area: 11.14 square miles of estimated ground-hail footprint; highest mapped band 1.5+ inches. 0 official hail report(s) within the summary area. Exposure estimates are not confirmed property damage. Open the map to explore the full coverage included in your access. Statistics cover the mapped hail footprint inside the Census boundary of Hastings, MN, not the entire region. The place had 22,154 residents in the 2020 Census. A boundary intersection does not mean the whole community was hit. Estimated housing exposure: 5,395 units in 1-inch-or-larger bands, including 643 in 1.5-inch-or-larger bands and 0 in 2-inch-or-larger bands.

Affected states: Hastings area, MN
1.5+ inRadar size estimate 22,154Population Affected 9,390Houses Affected HailHazards FreeAccount signup
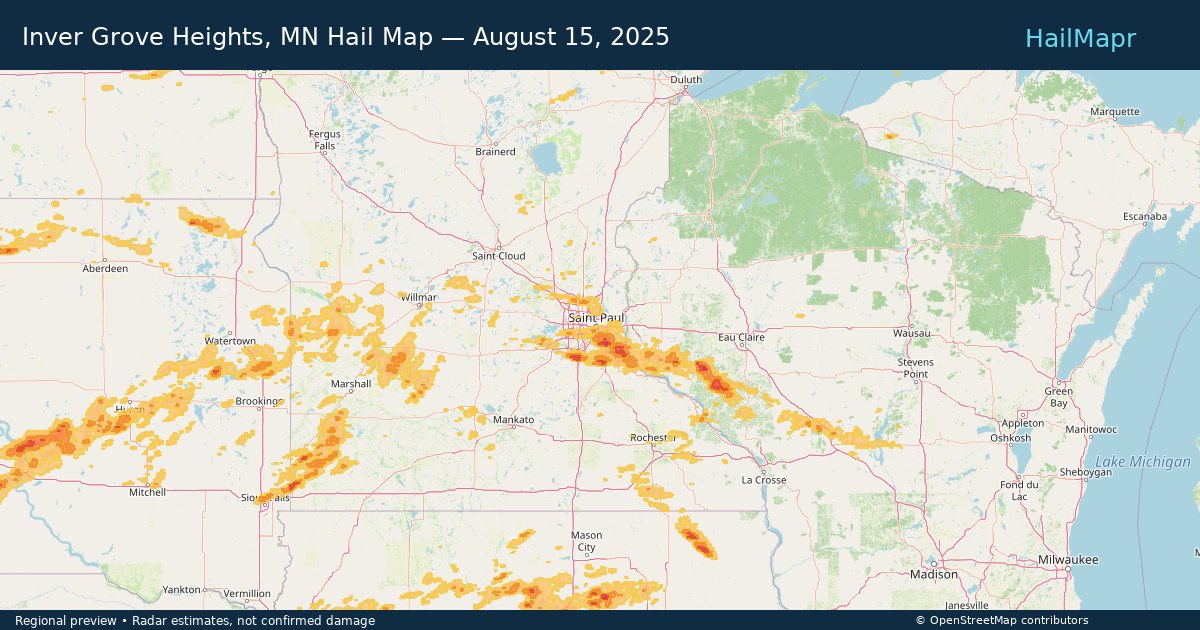
Inver Grove Heights, MN — August 15, 2025 — regional hail footprint preview
Storm footprint preview

Local hail summary for the Inver Grove Heights area: 20.56 square miles of estimated ground-hail footprint; highest mapped band 1.5+ inches. 0 official hail report(s) within the summary area. Exposure estimates are not confirmed property damage. Open the map to explore the full coverage included in your access. Statistics cover the mapped hail footprint inside the Census boundary of Inver Grove Heights, MN, not the entire region. The place had 35,801 residents in the 2020 Census. A boundary intersection does not mean the whole community was hit. Estimated housing exposure: 12,559 units in 1-inch-or-larger bands, including 3,644 in 1.5-inch-or-larger bands and 0 in 2-inch-or-larger bands.

Affected states: Inver Grove Heights area, MN
1.5+ inRadar size estimate 29,890Population Affected 12,802Houses Affected HailHazards FreeAccount signup
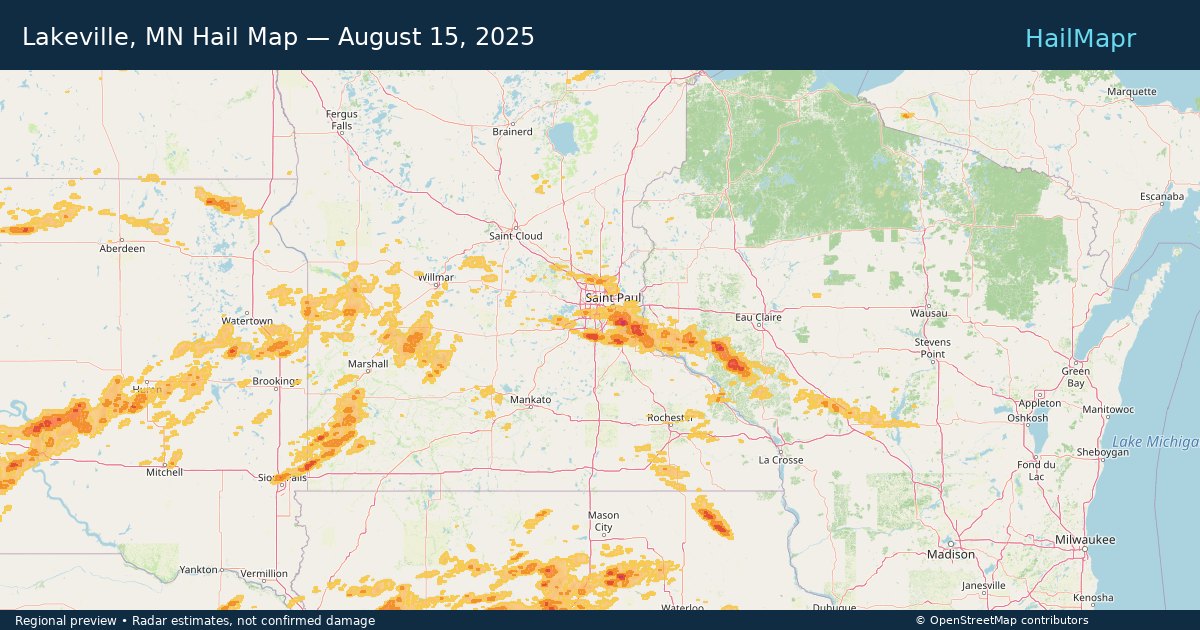
Lakeville, MN — August 15, 2025 — regional hail footprint preview
Storm footprint preview

Local hail summary for the Lakeville area: 13.95 square miles of estimated ground-hail footprint; highest mapped band 1.5+ inches. 0 official hail report(s) within the summary area. Exposure estimates are not confirmed property damage. Open the map to explore the full coverage included in your access. Statistics cover the mapped hail footprint inside the Census boundary of Lakeville, MN, not the entire region. The place had 69,490 residents in the 2020 Census. A boundary intersection does not mean the whole community was hit. Estimated housing exposure: 11,047 units in 1-inch-or-larger bands, including 3,234 in 1.5-inch-or-larger bands and 0 in 2-inch-or-larger bands.

Affected states: Lakeville area, MN
1.5+ inRadar size estimate 35,227Population Affected 12,225Houses Affected HailHazards FreeAccount signup
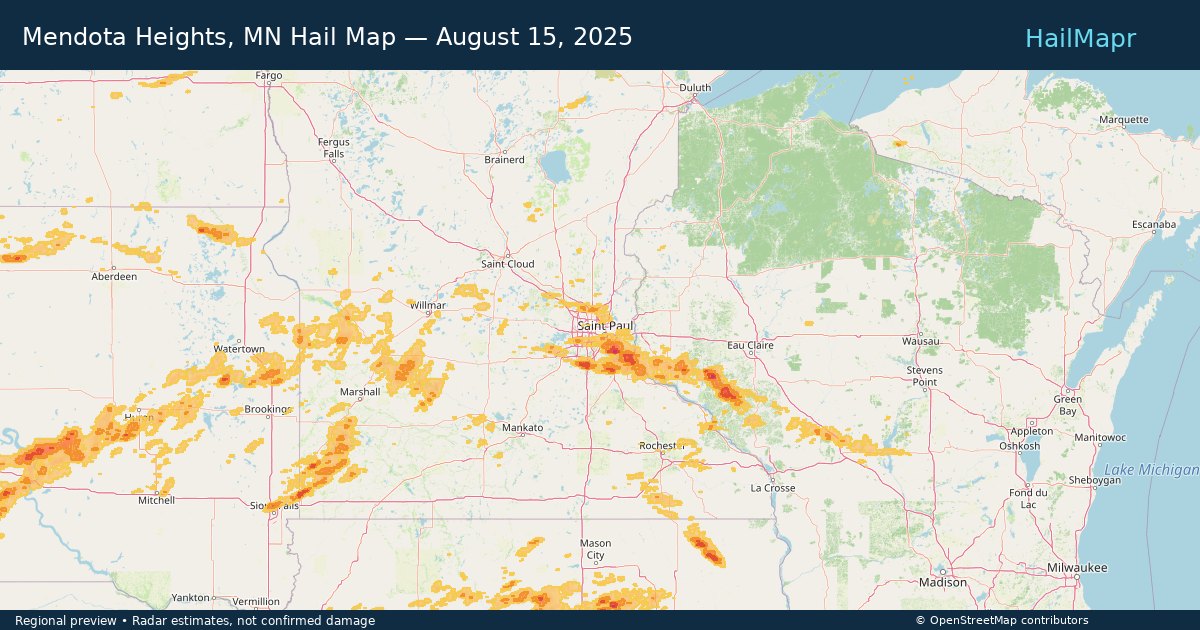
Mendota Heights, MN — August 15, 2025 — regional hail footprint preview
Storm footprint preview

Local hail summary for the Mendota Heights area: 1.28 square miles of estimated ground-hail footprint; highest mapped band 1+ inches. 0 official hail report(s) within the summary area. Exposure estimates are not confirmed property damage. Open the map to explore the full coverage included in your access. Statistics cover the mapped hail footprint inside the Census boundary of Mendota Heights, MN, not the entire region. The place had 11,744 residents in the 2020 Census. A boundary intersection does not mean the whole community was hit. Estimated housing exposure: 208 units in 1-inch-or-larger bands, including 0 in 1.5-inch-or-larger bands and 0 in 2-inch-or-larger bands.

Affected states: Mendota Heights area, MN
1+ inRadar size estimate 2,807Population Affected 1,057Houses Affected HailHazards FreeAccount signup
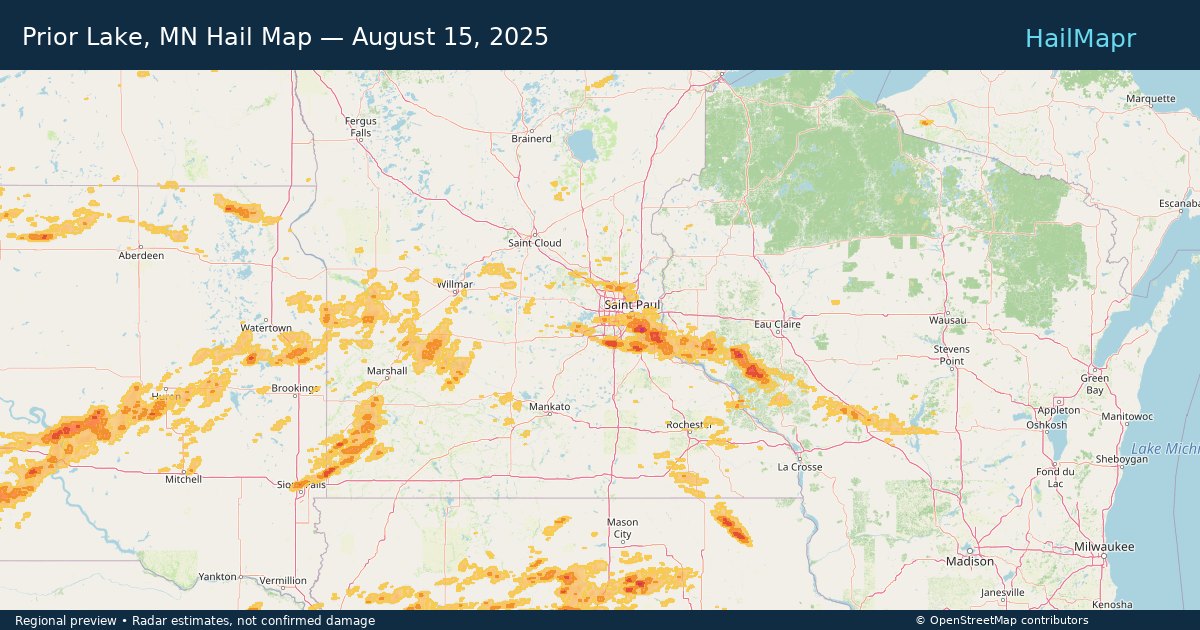
Prior Lake, MN — August 15, 2025 — regional hail footprint preview
Storm footprint preview

Local hail summary for the Prior Lake area: 2.37 square miles of estimated ground-hail footprint; highest mapped band 1+ inches. 0 official hail report(s) within the summary area. Exposure estimates are not confirmed property damage. Open the map to explore the full coverage included in your access. Statistics cover the mapped hail footprint inside the Census boundary of Prior Lake, MN, not the entire region. The place had 27,617 residents in the 2020 Census. A boundary intersection does not mean the whole community was hit. Estimated housing exposure: 474 units in 1-inch-or-larger bands, including 0 in 1.5-inch-or-larger bands and 0 in 2-inch-or-larger bands.

Affected states: Prior Lake area, MN
1+ inRadar size estimate 4,362Population Affected 1,626Houses Affected HailHazards FreeAccount signup
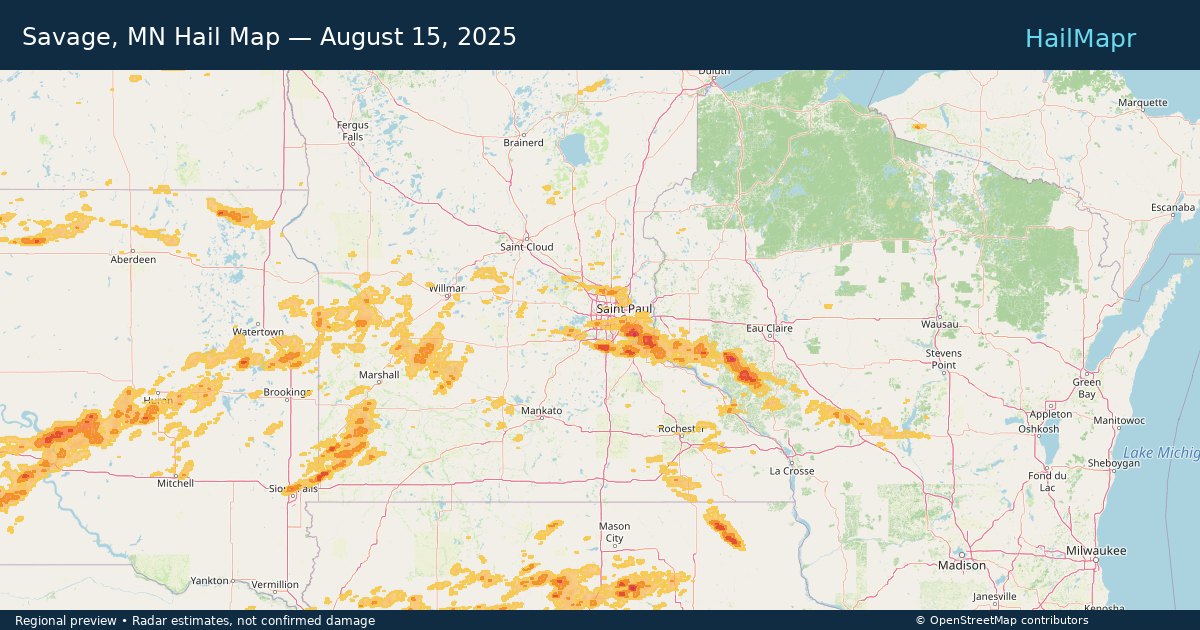
Savage, MN — August 15, 2025 — regional hail footprint preview
Storm footprint preview

Local hail summary for the Savage area: 7.33 square miles of estimated ground-hail footprint; highest mapped band 1.5+ inches. 0 official hail report(s) within the summary area. Exposure estimates are not confirmed property damage. Open the map to explore the full coverage included in your access. Statistics cover the mapped hail footprint inside the Census boundary of Savage, MN, not the entire region. The place had 32,465 residents in the 2020 Census. A boundary intersection does not mean the whole community was hit. Estimated housing exposure: 2,733 units in 1-inch-or-larger bands, including 138 in 1.5-inch-or-larger bands and 0 in 2-inch-or-larger bands.

Affected states: Savage area, MN
1.5+ inRadar size estimate 17,840Population Affected 6,288Houses Affected HailHazards FreeAccount signup
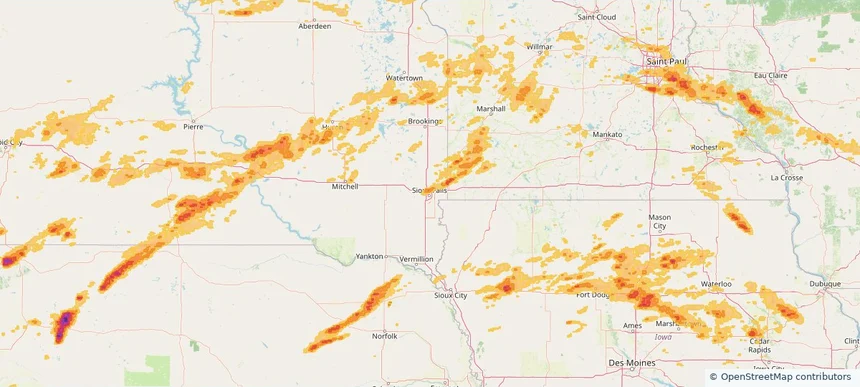
Sioux Falls, SD — August 15, 2025 — regional hail footprint preview
Storm footprint preview

Local hail summary for the Sioux Falls area: 9.38 square miles of estimated ground-hail footprint; highest mapped band 1+ inches. 0 official hail report(s) within the summary area. Exposure estimates are not confirmed property damage. Open the map to explore the full coverage included in your access. Statistics cover the mapped hail footprint inside the Census boundary of Sioux Falls, SD, not the entire region. The place had 192,517 residents in the 2020 Census. A boundary intersection does not mean the whole community was hit. Estimated housing exposure: 1,875 units in 1-inch-or-larger bands, including 0 in 1.5-inch-or-larger bands and 0 in 2-inch-or-larger bands.

Affected states: Sioux Falls area, SD
1+ inRadar size estimate 4,875Population Affected 1,875Houses Affected HailHazards FreeAccount signup
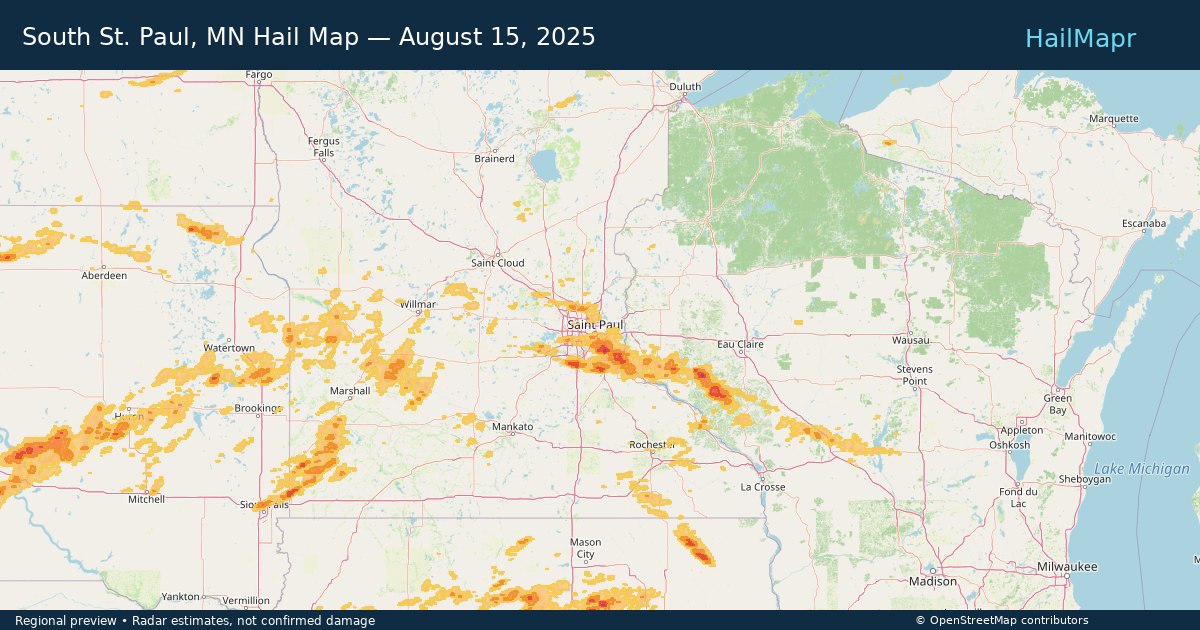
South St. Paul, MN — August 15, 2025 — regional hail footprint preview
Storm footprint preview

Local hail summary for the South St. Paul area: 5.30 square miles of estimated ground-hail footprint; highest mapped band 1+ inches. 0 official hail report(s) within the summary area. Exposure estimates are not confirmed property damage. Open the map to explore the full coverage included in your access. Statistics cover the mapped hail footprint inside the Census boundary of South St. Paul, MN, not the entire region. The place had 20,759 residents in the 2020 Census. A boundary intersection does not mean the whole community was hit. Estimated housing exposure: 7,587 units in 1-inch-or-larger bands, including 0 in 1.5-inch-or-larger bands and 0 in 2-inch-or-larger bands.

Affected states: South St. Paul area, MN
1+ inRadar size estimate 19,043Population Affected 8,069Houses Affected HailHazards FreeAccount signup
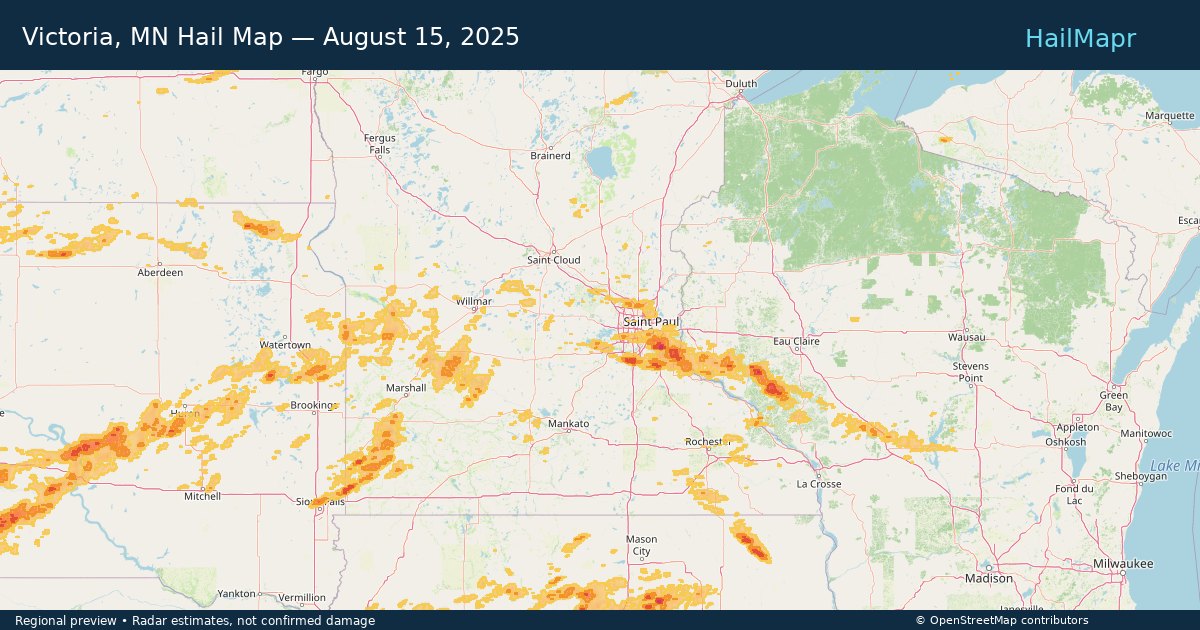
Victoria, MN — August 15, 2025 — regional hail footprint preview
Storm footprint preview

Local hail summary for the Victoria area: 0.97 square miles of estimated ground-hail footprint; highest mapped band 1+ inches. 0 official hail report(s) within the summary area. Exposure estimates are not confirmed property damage. Open the map to explore the full coverage included in your access. Statistics cover the mapped hail footprint inside the Census boundary of Victoria, MN, not the entire region. The place had 10,546 residents in the 2020 Census. A boundary intersection does not mean the whole community was hit. Estimated housing exposure: 391 units in 1-inch-or-larger bands, including 0 in 1.5-inch-or-larger bands and 0 in 2-inch-or-larger bands.

Affected states: Victoria area, MN
1+ inRadar size estimate 1,497Population Affected 418Houses Affected HailHazards FreeAccount signup
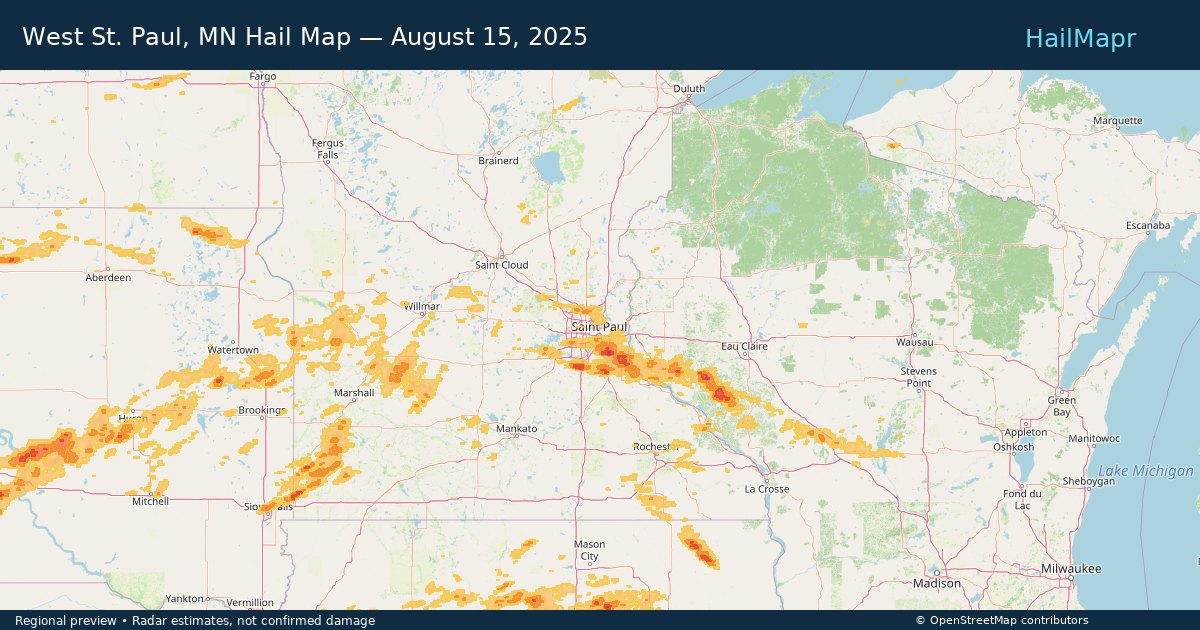
West St. Paul, MN — August 15, 2025 — regional hail footprint preview
Storm footprint preview

Local hail summary for the West St. Paul area: 1.70 square miles of estimated ground-hail footprint; highest mapped band 1+ inches. 0 official hail report(s) within the summary area. Exposure estimates are not confirmed property damage. Open the map to explore the full coverage included in your access. Statistics cover the mapped hail footprint inside the Census boundary of West St. Paul, MN, not the entire region. The place had 20,615 residents in the 2020 Census. A boundary intersection does not mean the whole community was hit. Estimated housing exposure: 1,674 units in 1-inch-or-larger bands, including 0 in 1.5-inch-or-larger bands and 0 in 2-inch-or-larger bands.

Affected states: West St. Paul area, MN
1+ inRadar size estimate 6,183Population Affected 3,063Houses Affected HailHazards FreeAccount signup
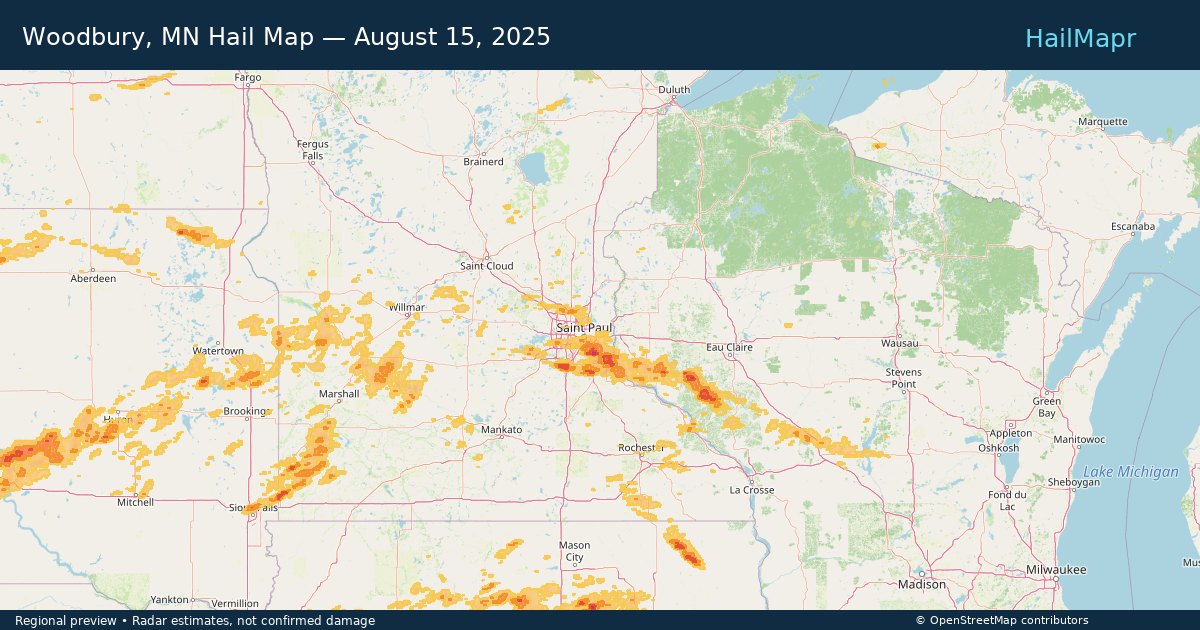
Woodbury, MN — August 15, 2025 — regional hail footprint preview
Storm footprint preview

Local hail summary for the Woodbury area: 14.46 square miles of estimated ground-hail footprint; highest mapped band 1+ inches. 1 official hail report(s) within the summary area. Exposure estimates are not confirmed property damage. Open the map to explore the full coverage included in your access. Statistics cover the mapped hail footprint inside the Census boundary of Woodbury, MN, not the entire region. The place had 75,102 residents in the 2020 Census. A boundary intersection does not mean the whole community was hit. Estimated housing exposure: 6,676 units in 1-inch-or-larger bands, including 0 in 1.5-inch-or-larger bands and 0 in 2-inch-or-larger bands.

Affected states: Woodbury area, MN
1+ inRadar size estimate 27,252Population Affected 10,537Houses Affected HailHazards FreeAccount signup
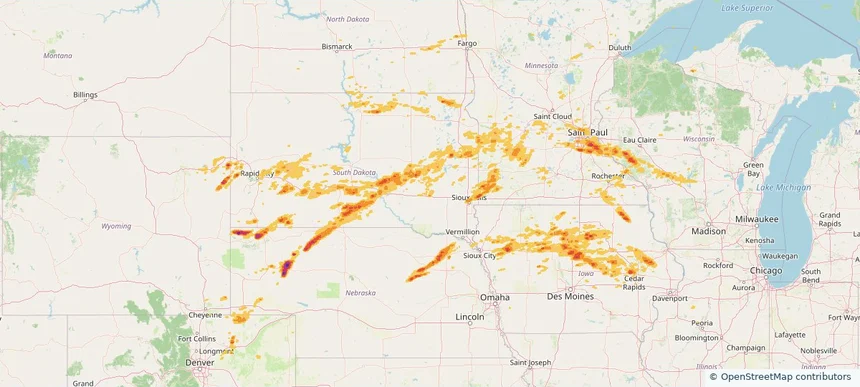
Historical Hail — 2025-08-15 — regional hail footprint preview
Storm footprint preview
Aug 15, 2025 7:00 AM to Aug 16, 2025 7:00 AM CST

Historical Hail — 2025-08-15

Hail as large as 1.75 inches was reported near Wessington Spgs, SOUTH DAKOTA. Wind up to 92 mph was reported near 4 miles west-southwest of Stone Bridge, SD. 3 tornadoes were reported, including one near Winnebago, IOWA. The storm had 13 official hail reports.

Affected states: National, CO, IL, IA, MI, MN, NE, ND, SD, WI, WY
3.0 inRadar size estimate 1,333,292Population Affected 562,396Houses Affected Hail · Wind · TornadoHazards FreeAccount signup
Abington, MA — August 14, 2025 — regional hail footprint preview
Storm footprint preview

Local hail summary for the Abington area: 2.35 square miles of estimated ground-hail footprint; highest mapped band 1+ inches. 0 official hail report(s) within the summary area. Exposure estimates are not confirmed property damage. Open the map to explore the full coverage included in your access. Statistics cover the mapped hail footprint inside the Census boundary of Abington, MA, not the entire region. The place had 17,062 residents in the 2020 Census. A boundary intersection does not mean the whole community was hit. Estimated housing exposure: 1,434 units in 1-inch-or-larger bands, including 0 in 1.5-inch-or-larger bands and 0 in 2-inch-or-larger bands.

Affected states: Abington area, MA
1+ inRadar size estimate 4,345Population Affected 1,780Houses Affected HailHazards FreeAccount signup
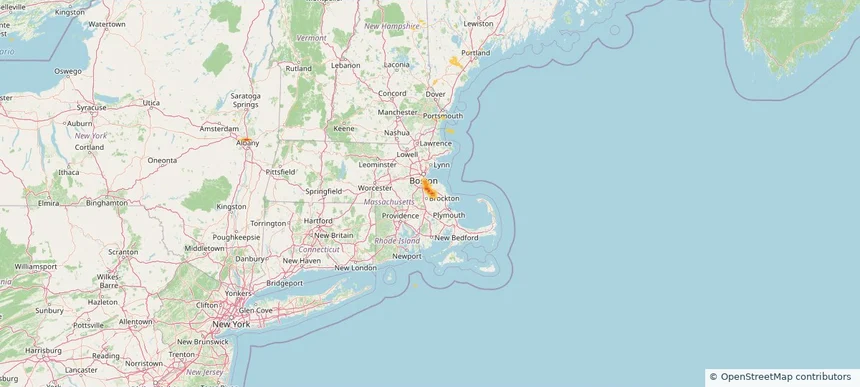
Braintree Town, MA — August 14, 2025 — regional hail footprint preview
Storm footprint preview

Local hail summary for the Braintree Town area: 9.41 square miles of estimated ground-hail footprint; highest mapped band 1.5+ inches. 0 official hail report(s) within the summary area. Exposure estimates are not confirmed property damage. Open the map to explore the full coverage included in your access. Statistics cover the mapped hail footprint inside the Census boundary of Braintree Town, MA, not the entire region. The place had 39,143 residents in the 2020 Census. A boundary intersection does not mean the whole community was hit. Estimated housing exposure: 4,986 units in 1-inch-or-larger bands, including 1,755 in 1.5-inch-or-larger bands and 0 in 2-inch-or-larger bands.

Affected states: Braintree Town area, MA
1.5+ inRadar size estimate 26,672Population Affected 10,169Houses Affected HailHazards FreeAccount signup
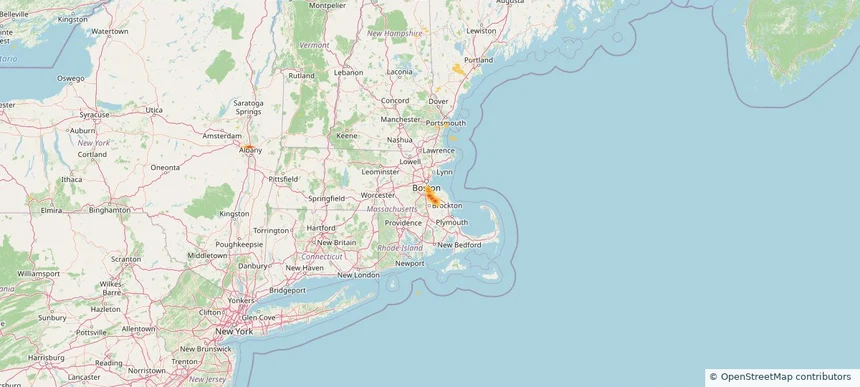
Holbrook, MA — August 14, 2025 — regional hail footprint preview
Storm footprint preview

Local hail summary for the Holbrook area: 1.65 square miles of estimated ground-hail footprint; highest mapped band 1.5+ inches. 0 official hail report(s) within the summary area. Exposure estimates are not confirmed property damage. Open the map to explore the full coverage included in your access. Statistics cover the mapped hail footprint inside the Census boundary of Holbrook, MA, not the entire region. The place had 11,405 residents in the 2020 Census. A boundary intersection does not mean the whole community was hit. Estimated housing exposure: 448 units in 1-inch-or-larger bands, including 0 in 1.5-inch-or-larger bands and 0 in 2-inch-or-larger bands.

Affected states: Holbrook area, MA
1.5+ inRadar size estimate 2,123Population Affected 848Houses Affected HailHazards FreeAccount signup
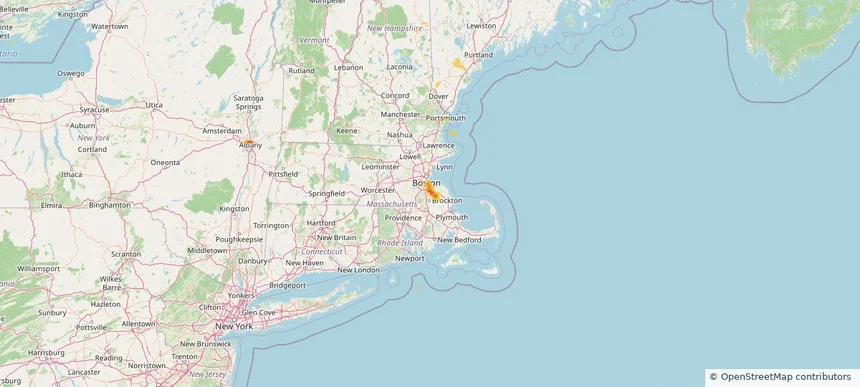
Quincy, MA — August 14, 2025 — regional hail footprint preview
Storm footprint preview

Local hail summary for the Quincy area: 1.97 square miles of estimated ground-hail footprint; highest mapped band 1+ inches. 0 official hail report(s) within the summary area. Exposure estimates are not confirmed property damage. Open the map to explore the full coverage included in your access. Statistics cover the mapped hail footprint inside the Census boundary of Quincy, MA, not the entire region. The place had 101,636 residents in the 2020 Census. A boundary intersection does not mean the whole community was hit. Estimated housing exposure: 4,053 units in 1-inch-or-larger bands, including 0 in 1.5-inch-or-larger bands and 0 in 2-inch-or-larger bands.

Affected states: Quincy area, MA
1+ inRadar size estimate 14,696Population Affected 7,049Houses Affected HailHazards FreeAccount signup
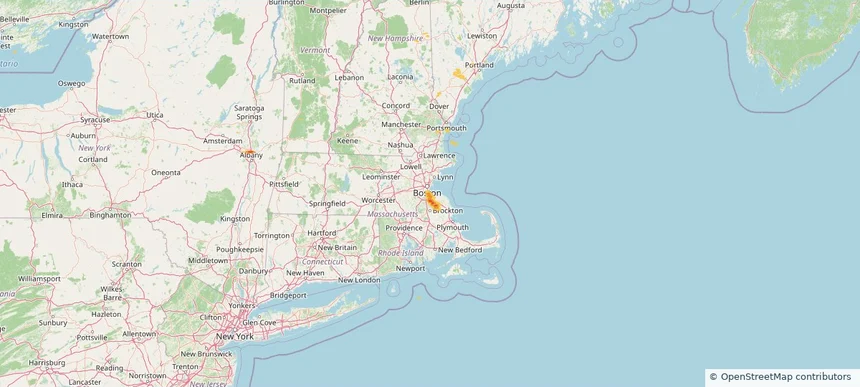
Randolph Town, MA — August 14, 2025 — regional hail footprint preview
Storm footprint preview

Local hail summary for the Randolph Town area: 0.58 square miles of estimated ground-hail footprint; highest mapped band 1.5+ inches. 0 official hail report(s) within the summary area. Exposure estimates are not confirmed property damage. Open the map to explore the full coverage included in your access. Statistics cover the mapped hail footprint inside the Census boundary of Randolph Town, MA, not the entire region. The place had 34,984 residents in the 2020 Census. A boundary intersection does not mean the whole community was hit. Estimated housing exposure: 198 units in 1-inch-or-larger bands, including 0 in 1.5-inch-or-larger bands and 0 in 2-inch-or-larger bands.

Affected states: Randolph Town area, MA
1.5+ inRadar size estimate 523Population Affected 198Houses Affected HailHazards FreeAccount signup
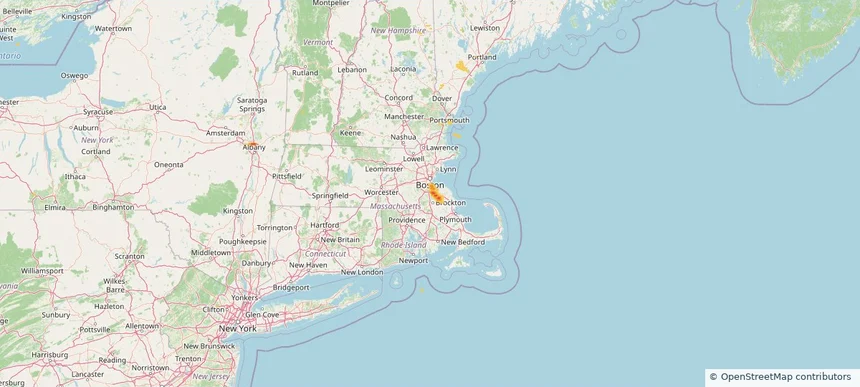
Weymouth Town, MA — August 14, 2025 — regional hail footprint preview
Storm footprint preview

Local hail summary for the Weymouth Town area: 5.19 square miles of estimated ground-hail footprint; highest mapped band 1+ inches. 0 official hail report(s) within the summary area. Exposure estimates are not confirmed property damage. Open the map to explore the full coverage included in your access. Statistics cover the mapped hail footprint inside the Census boundary of Weymouth Town, MA, not the entire region. The place had 57,437 residents in the 2020 Census. A boundary intersection does not mean the whole community was hit. Estimated housing exposure: 5,009 units in 1-inch-or-larger bands, including 0 in 1.5-inch-or-larger bands and 0 in 2-inch-or-larger bands.

Affected states: Weymouth Town area, MA
1+ inRadar size estimate 11,452Population Affected 5,262Houses Affected HailHazards FreeAccount signup
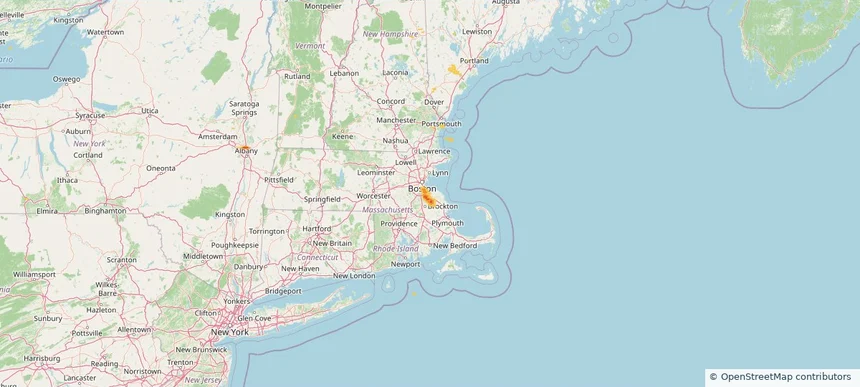
Historical Hail — 2025-08-14 — regional hail footprint preview
Storm footprint preview
Aug 14, 2025 7:00 AM to Aug 15, 2025 7:00 AM CST

Historical Hail — 2025-08-14

Hail as large as 1.50 inches was reported near Britton, SOUTH DAKOTA. Wind up to 82 mph was reported near 1 mile south of Sunset Colony, SD. 2 tornadoes were reported, including one near Vermilion, ILLINOIS. The storm had 8 official hail reports.

Affected states: National, CO, IA, ME, MD, MA, MN, NE, NH, NY, ND, SD, VA, WV, WY
1.97 inRadar size estimate 319,732Population Affected 138,249Houses Affected Hail · Wind · TornadoHazards FreeAccount signup
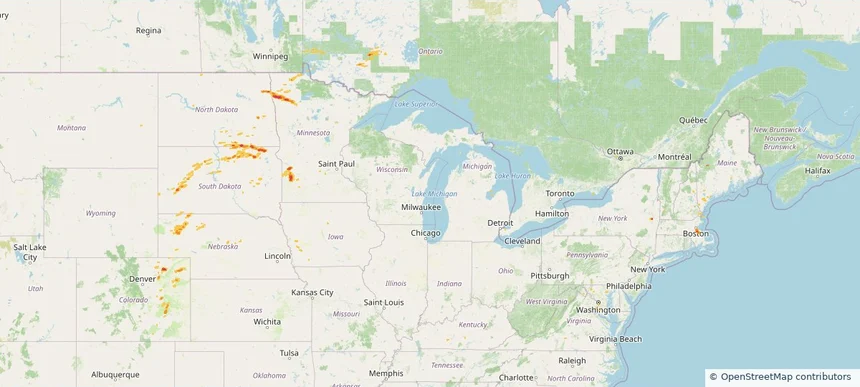
Historical Hail — 2025-08-13 — regional hail footprint preview
Storm footprint preview
Aug 13, 2025 7:00 AM to Aug 14, 2025 7:00 AM CST

Historical Hail — 2025-08-13

Hail as large as 1.25 inches was reported near Webb, NEW HAMPSHIRE. Wind up to 88 mph was reported near 3 miles north-northeast of Harrington, SD. The storm had 4 official hail reports.

Affected states: National, CT, KY, MA, MI, MO, MT, NE, NH, NJ, NY, ND, OH, PA, SD, VT, VA, WV, WY
2.5 inRadar size estimate 57,583Population Affected 25,553Houses Affected Hail · WindHazards FreeAccount signup
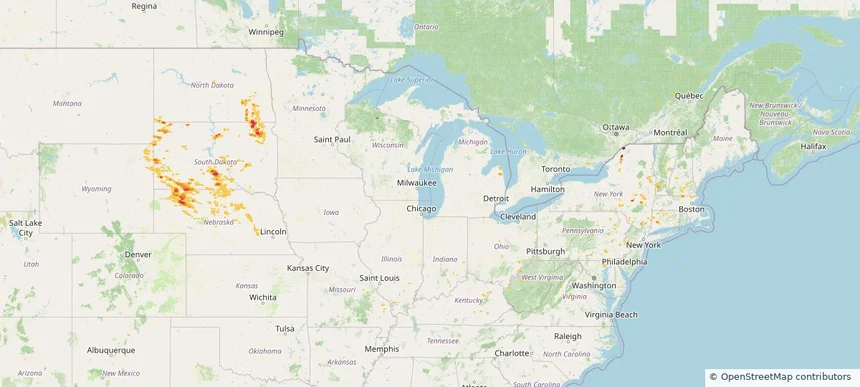
Amarillo, TX — August 11, 2025 — regional hail footprint preview
Storm footprint preview

Local hail summary for the Amarillo area: 57.15 square miles of estimated ground-hail footprint; highest mapped band 2.5+ inches. 1 official hail report(s) within the summary area. Exposure estimates are not confirmed property damage. Open the map to explore the full coverage included in your access. Statistics cover the mapped hail footprint inside the Census boundary of Amarillo, TX, not the entire region. The place had 200,393 residents in the 2020 Census. A boundary intersection does not mean the whole community was hit. Estimated housing exposure: 52,526 units in 1-inch-or-larger bands, including 40,192 in 1.5-inch-or-larger bands and 12,276 in 2-inch-or-larger bands.

Affected states: Amarillo area, TX
2.5+ inRadar size estimate 132,572Population Affected 59,490Houses Affected HailHazards FreeAccount signup
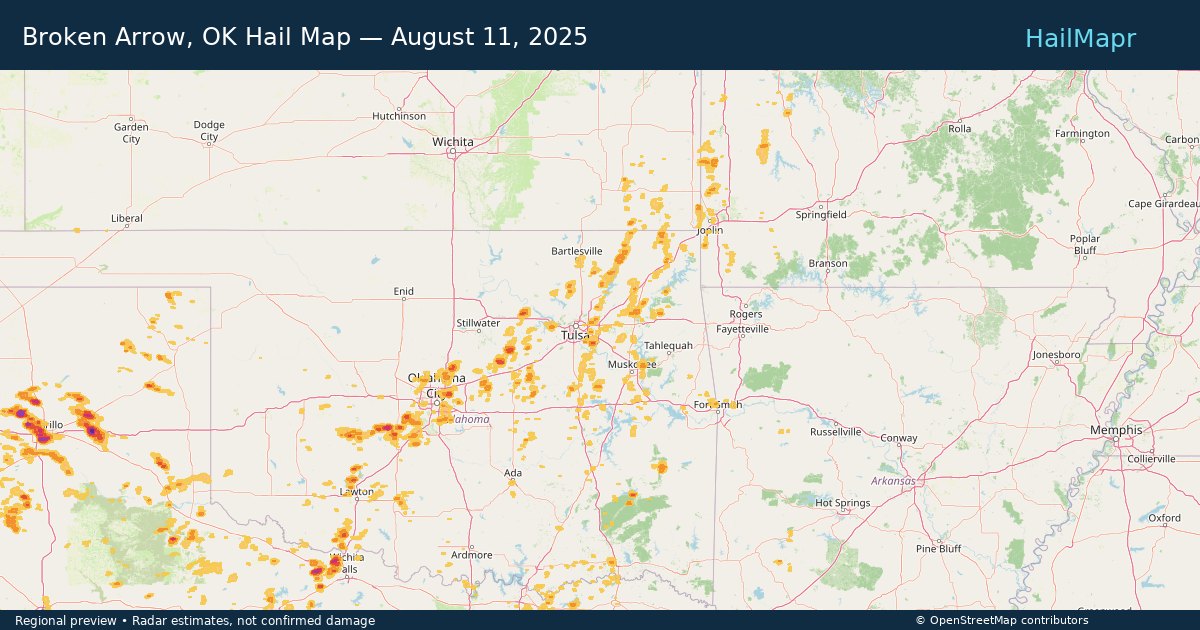
Broken Arrow, OK — August 11, 2025 — regional hail footprint preview
Storm footprint preview

Local hail summary for the Broken Arrow area: 11.62 square miles of estimated ground-hail footprint; highest mapped band 1.5+ inches. 0 official hail report(s) within the summary area. Exposure estimates are not confirmed property damage. Open the map to explore the full coverage included in your access. Statistics cover the mapped hail footprint inside the Census boundary of Broken Arrow, OK, not the entire region. The place had 113,540 residents in the 2020 Census. A boundary intersection does not mean the whole community was hit. Estimated housing exposure: 6,748 units in 1-inch-or-larger bands, including 978 in 1.5-inch-or-larger bands and 0 in 2-inch-or-larger bands.

Affected states: Broken Arrow area, OK
1.5+ inRadar size estimate 35,987Population Affected 14,563Houses Affected HailHazards FreeAccount signup
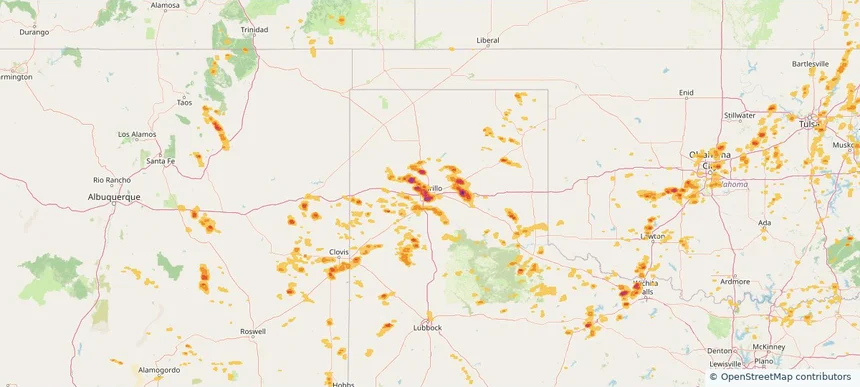
Burkburnett, TX — August 11, 2025 — regional hail footprint preview
Storm footprint preview

Local hail summary for the Burkburnett area: 3.40 square miles of estimated ground-hail footprint; highest mapped band 1.5+ inches. 1 official hail report(s) within the summary area. Exposure estimates are not confirmed property damage. Open the map to explore the full coverage included in your access. Statistics cover the mapped hail footprint inside the Census boundary of Burkburnett, TX, not the entire region. The place had 10,939 residents in the 2020 Census. A boundary intersection does not mean the whole community was hit. Estimated housing exposure: 367 units in 1-inch-or-larger bands, including 0 in 1.5-inch-or-larger bands and 0 in 2-inch-or-larger bands.

Affected states: Burkburnett area, TX
1.5+ inRadar size estimate 2,089Population Affected 739Houses Affected HailHazards FreeAccount signup
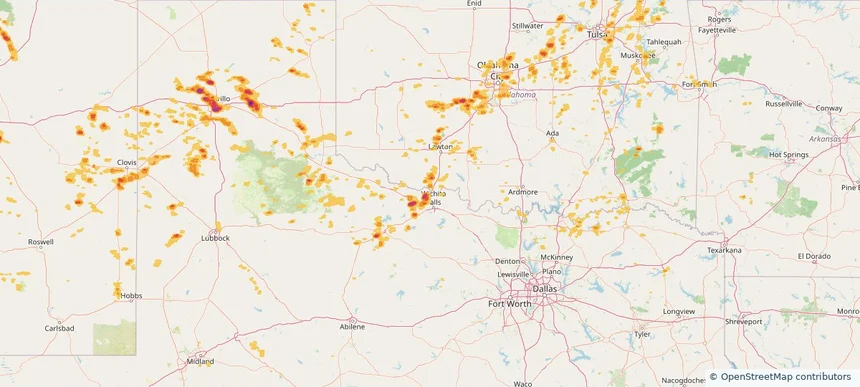
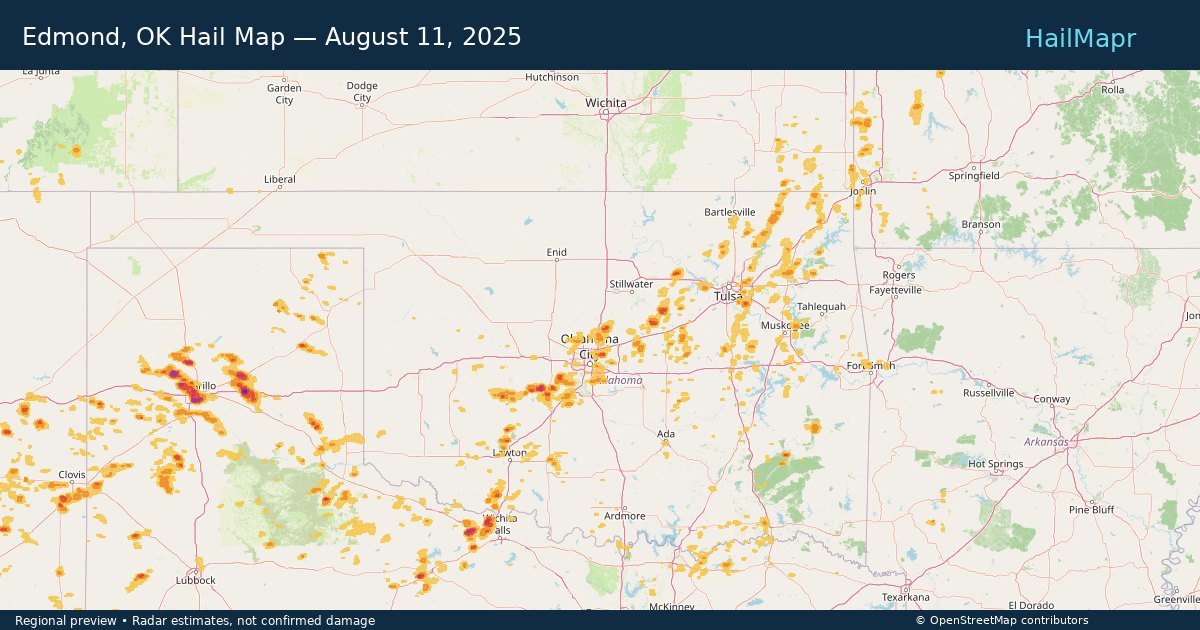
Edmond, OK — August 11, 2025 — regional hail footprint preview
Storm footprint preview

Local hail summary for the Edmond area: 9.26 square miles of estimated ground-hail footprint; highest mapped band 1+ inches. 0 official hail report(s) within the summary area. Exposure estimates are not confirmed property damage. Open the map to explore the full coverage included in your access. Statistics cover the mapped hail footprint inside the Census boundary of Edmond, OK, not the entire region. The place had 94,428 residents in the 2020 Census. A boundary intersection does not mean the whole community was hit. Estimated housing exposure: 230 units in 1-inch-or-larger bands, including 0 in 1.5-inch-or-larger bands and 0 in 2-inch-or-larger bands.

Affected states: Edmond area, OK
1+ inRadar size estimate 4,546Population Affected 1,672Houses Affected HailHazards FreeAccount signup
Page 71 of 100
‹ 1 70 71 72 100 ›

Frequently asked questions

Can I search hail maps by coverage area?

Yes. The storm library supports coverage-area filtering so you can find hail maps and hail swaths in a target service area.

What kinds of storms appear in the HailMapr library?

The library focuses on published hail events, including ready storm maps and live storms once hail has been detected and a public swath is available.

Are HailMapr storm pages useful for roofers and adjusters?

Yes. They are built to help roofers, adjusters, restoration teams, and property owners review storm footprints before purchase.