
Storm library

Browse live and recent hail maps.

Review storm footprints, hail swaths, reports, and replay access. Create a free account to save your setup and move into map access when a storm matters.

Search filters
Clear
Newest storms first by default.
Don't see your storm? Request a qualifying storm map and we'll email you when it is ready.
Showing 1177-1200 of 2395 storms · Page 50 of 100
‹ 1 49 50 51 100 ›
Request a storm map

Tell us about the storm and we'll build the map. Once it's published you'll get an email and can purchase it from the library — just like any other event.

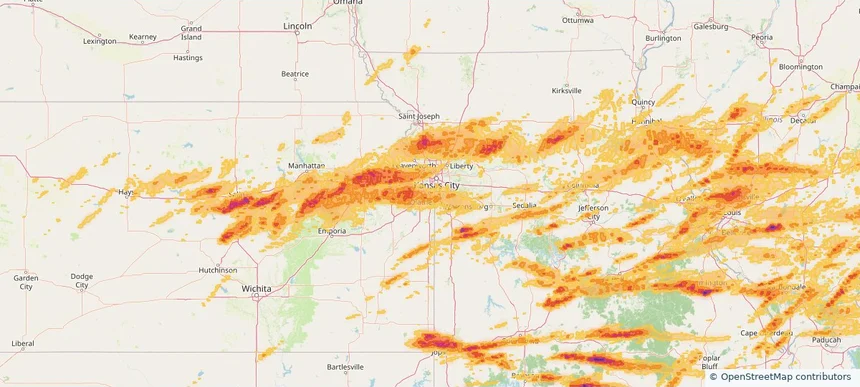
Overland Park, KS — April 27, 2026 — regional hail footprint preview
Storm footprint preview

Local hail summary for the Overland Park area: 49.50 square miles of estimated ground-hail footprint; highest mapped band 1+ inches. 0 official hail report(s) within the summary area. Exposure estimates are not confirmed property damage. Open the map to explore the full coverage included in your access. Statistics cover the mapped hail footprint inside the Census boundary of Overland Park, KS, not the entire region. The place had 197,238 residents in the 2020 Census. A boundary intersection does not mean the whole community was hit. Estimated housing exposure: 12,700 units in 1-inch-or-larger bands, including 0 in 1.5-inch-or-larger bands and 0 in 2-inch-or-larger bands.

Affected states: Overland Park area, KS
1+ inRadar size estimate 128,325Population Affected 54,394Houses Affected HailHazards FreeAccount signup
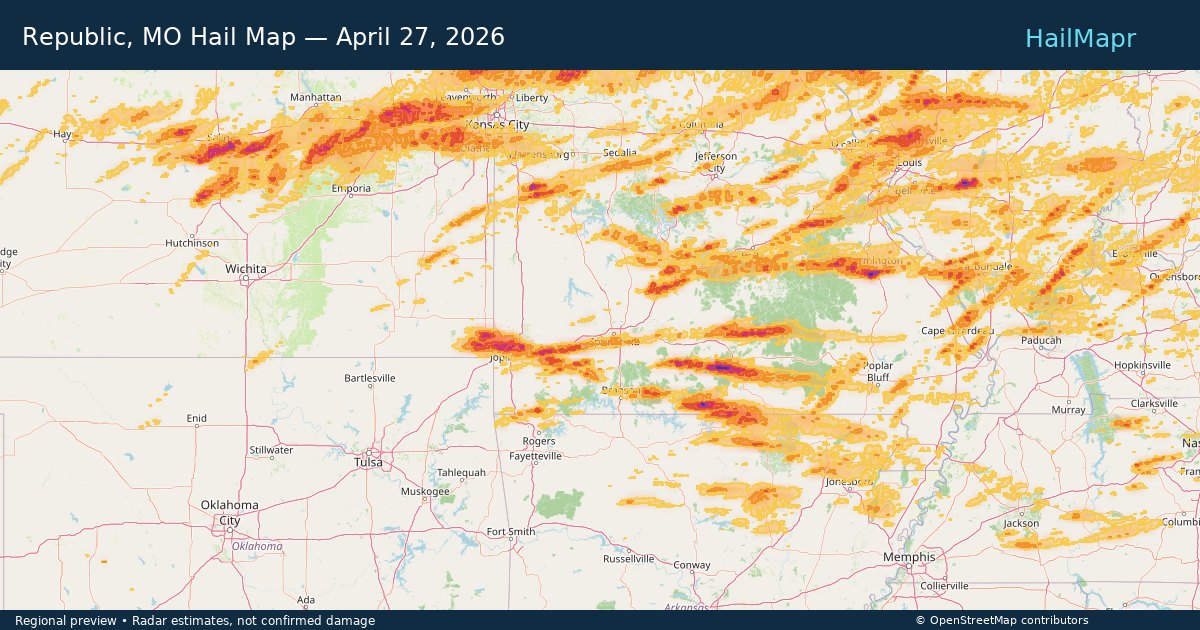
Republic, MO — April 27, 2026 — regional hail footprint preview
Storm footprint preview

Local hail summary for the Republic area: 4.39 square miles of estimated ground-hail footprint; highest mapped band 1+ inches. 0 official hail report(s) within the summary area. Exposure estimates are not confirmed property damage. Open the map to explore the full coverage included in your access. Statistics cover the mapped hail footprint inside the Census boundary of Republic, MO, not the entire region. The place had 18,750 residents in the 2020 Census. A boundary intersection does not mean the whole community was hit. Estimated housing exposure: 1,441 units in 1-inch-or-larger bands, including 0 in 1.5-inch-or-larger bands and 0 in 2-inch-or-larger bands.

Affected states: Republic area, MO
1+ inRadar size estimate 10,884Population Affected 4,149Houses Affected HailHazards FreeAccount signup
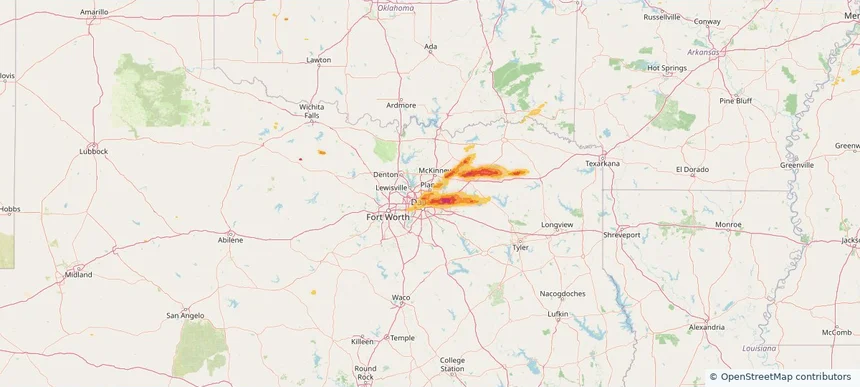
Richardson, TX — April 27, 2026 — regional hail footprint preview
Storm footprint preview

Local hail summary for the Richardson area: 12.94 square miles of estimated ground-hail footprint; highest mapped band 1.5+ inches. 0 official hail report(s) within the summary area. Exposure estimates are not confirmed property damage. Open the map to explore the full coverage included in your access. Statistics cover the mapped hail footprint inside the Census boundary of Richardson, TX, not the entire region. The place had 119,469 residents in the 2020 Census. A boundary intersection does not mean the whole community was hit. Estimated housing exposure: 14,816 units in 1-inch-or-larger bands, including 1 in 1.5-inch-or-larger bands and 0 in 2-inch-or-larger bands.

Affected states: Richardson area, TX
1.5+ inRadar size estimate 55,098Population Affected 22,287Houses Affected HailHazards FreeAccount signup
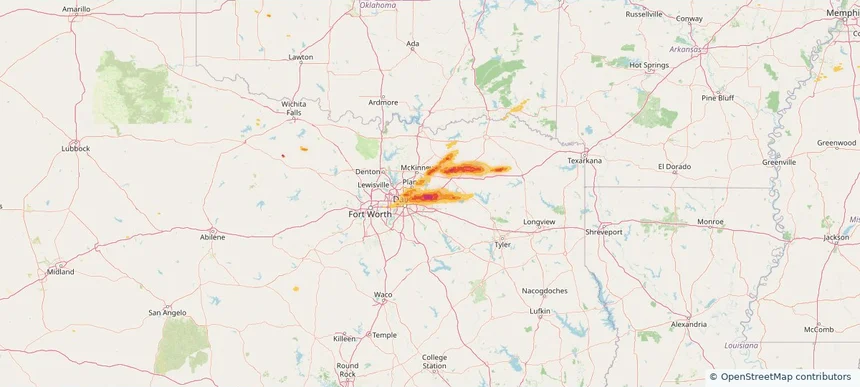
Rockwall, TX — April 27, 2026 — regional hail footprint preview
Storm footprint preview

Local hail summary for the Rockwall area: 24.20 square miles of estimated ground-hail footprint; highest mapped band 2+ inches. 1 official hail report(s) within the summary area. Exposure estimates are not confirmed property damage. Open the map to explore the full coverage included in your access. Statistics cover the mapped hail footprint inside the Census boundary of Rockwall, TX, not the entire region. The place had 47,251 residents in the 2020 Census. A boundary intersection does not mean the whole community was hit. Estimated housing exposure: 12,561 units in 1-inch-or-larger bands, including 9,933 in 1.5-inch-or-larger bands and 8,723 in 2-inch-or-larger bands.

Affected states: Rockwall area, TX
2+ inRadar size estimate 35,092Population Affected 13,753Houses Affected HailHazards FreeAccount signup
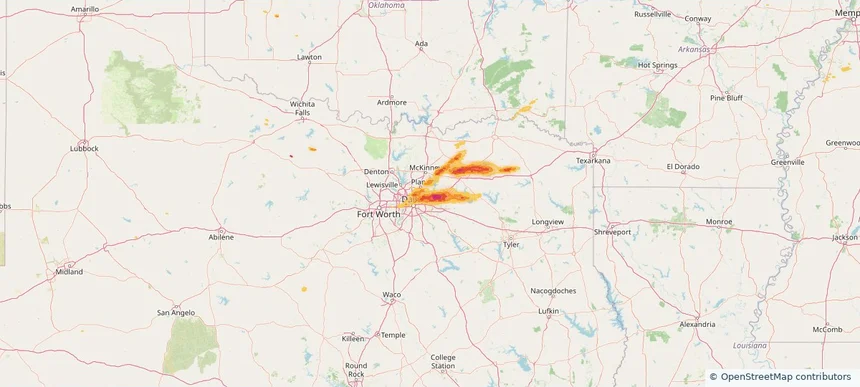
Rowlett, TX — April 27, 2026 — regional hail footprint preview
Storm footprint preview

Local hail summary for the Rowlett area: 13.55 square miles of estimated ground-hail footprint; highest mapped band 1.5+ inches. 1 official hail report(s) within the summary area. Exposure estimates are not confirmed property damage. Open the map to explore the full coverage included in your access. Statistics cover the mapped hail footprint inside the Census boundary of Rowlett, TX, not the entire region. The place had 62,535 residents in the 2020 Census. A boundary intersection does not mean the whole community was hit. Estimated housing exposure: 11,059 units in 1-inch-or-larger bands, including 4,432 in 1.5-inch-or-larger bands and 0 in 2-inch-or-larger bands.

Affected states: Rowlett area, TX
1.5+ inRadar size estimate 45,828Population Affected 16,777Houses Affected HailHazards FreeAccount signup
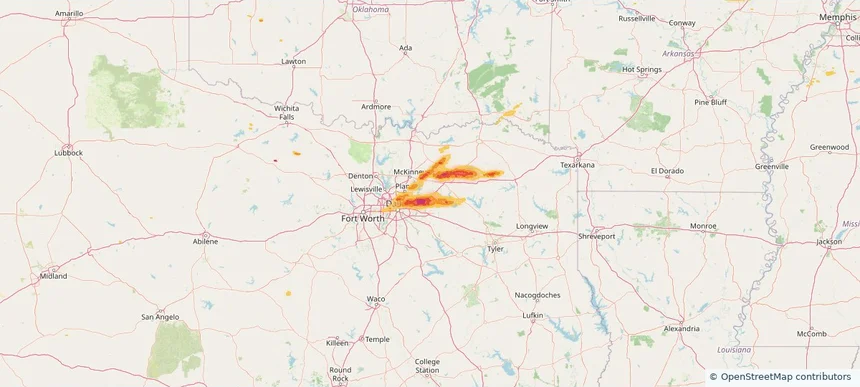
Royse City, TX — April 27, 2026 — regional hail footprint preview
Storm footprint preview

Local hail summary for the Royse City area: 4.90 square miles of estimated ground-hail footprint; highest mapped band 1.5+ inches. 0 official hail report(s) within the summary area. Exposure estimates are not confirmed property damage. Open the map to explore the full coverage included in your access. Statistics cover the mapped hail footprint inside the Census boundary of Royse City, TX, not the entire region. The place had 13,508 residents in the 2020 Census. A boundary intersection does not mean the whole community was hit. Estimated housing exposure: 168 units in 1-inch-or-larger bands, including 0 in 1.5-inch-or-larger bands and 0 in 2-inch-or-larger bands.

Affected states: Royse City area, TX
1.5+ inRadar size estimate 4,902Population Affected 1,541Houses Affected HailHazards FreeAccount signup
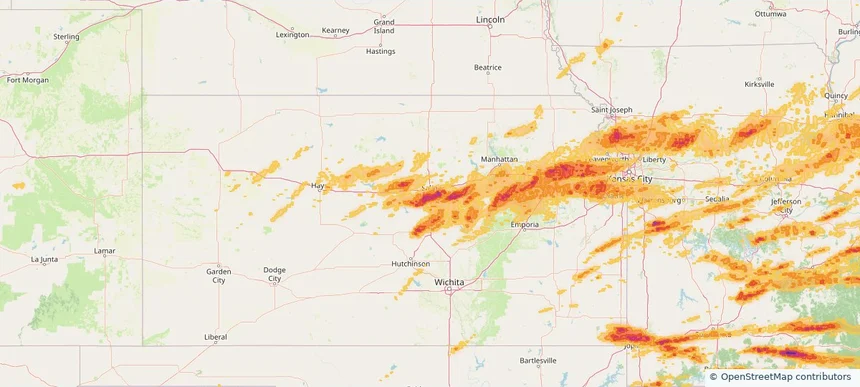
Salina, KS — April 27, 2026 — regional hail footprint preview
Storm footprint preview

Local hail summary for the Salina area: 25.79 square miles of estimated ground-hail footprint; highest mapped band 2+ inches. 1 official hail report(s) within the summary area. Exposure estimates are not confirmed property damage. Open the map to explore the full coverage included in your access. Statistics cover the mapped hail footprint inside the Census boundary of Salina, KS, not the entire region. The place had 46,889 residents in the 2020 Census. A boundary intersection does not mean the whole community was hit. Estimated housing exposure: 20,880 units in 1-inch-or-larger bands, including 17,641 in 1.5-inch-or-larger bands and 2,066 in 2-inch-or-larger bands.

Affected states: Salina area, KS
2+ inRadar size estimate 46,889Population Affected 20,885Houses Affected HailHazards FreeAccount signup
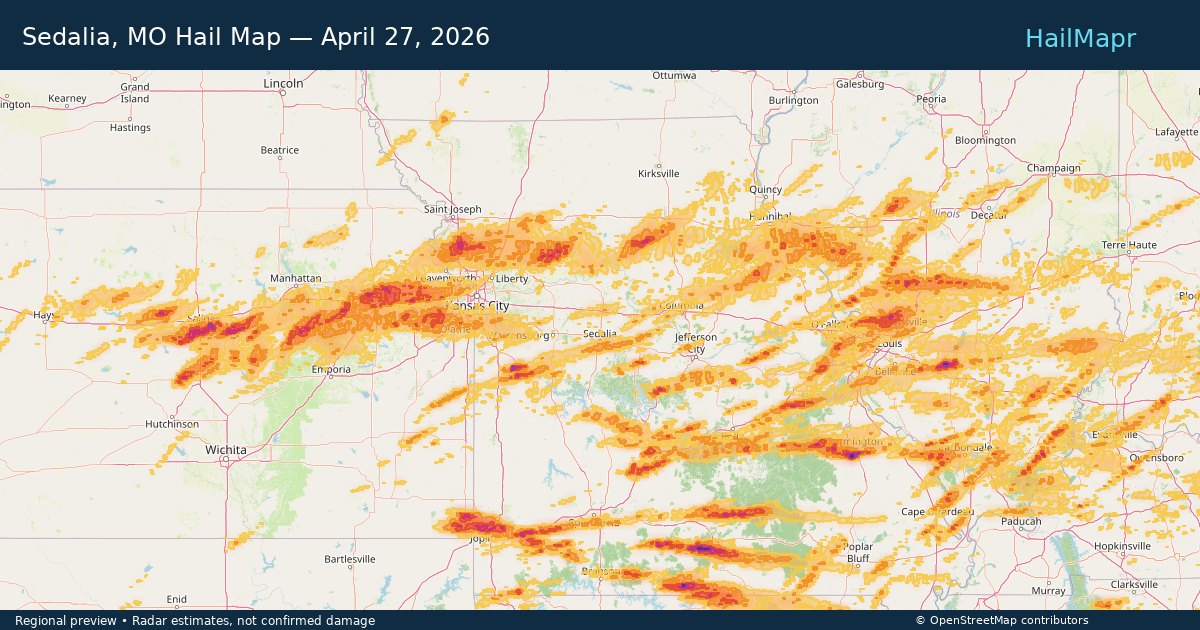
Sedalia, MO — April 27, 2026 — regional hail footprint preview
Storm footprint preview

Local hail summary for the Sedalia area: 4.83 square miles of estimated ground-hail footprint; highest mapped band 1+ inches. 0 official hail report(s) within the summary area. Exposure estimates are not confirmed property damage. Open the map to explore the full coverage included in your access. Statistics cover the mapped hail footprint inside the Census boundary of Sedalia, MO, not the entire region. The place had 21,725 residents in the 2020 Census. A boundary intersection does not mean the whole community was hit. Estimated housing exposure: 277 units in 1-inch-or-larger bands, including 0 in 1.5-inch-or-larger bands and 0 in 2-inch-or-larger bands.

Affected states: Sedalia area, MO
1+ inRadar size estimate 9,607Population Affected 4,389Houses Affected HailHazards FreeAccount signup
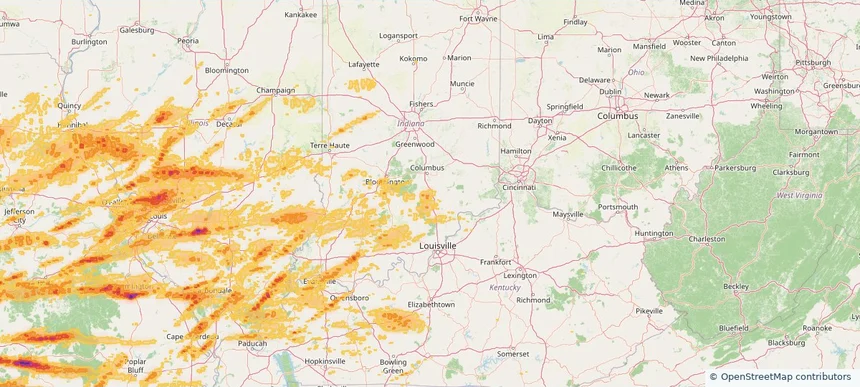
Seymour, IN — April 27, 2026 — regional hail footprint preview
Storm footprint preview

Local hail summary for the Seymour area: 8.40 square miles of estimated ground-hail footprint; highest mapped band 1+ inches. 0 official hail report(s) within the summary area. Exposure estimates are not confirmed property damage. Open the map to explore the full coverage included in your access. Statistics cover the mapped hail footprint inside the Census boundary of Seymour, IN, not the entire region. The place had 21,569 residents in the 2020 Census. A boundary intersection does not mean the whole community was hit. Estimated housing exposure: 186 units in 1-inch-or-larger bands, including 0 in 1.5-inch-or-larger bands and 0 in 2-inch-or-larger bands.

Affected states: Seymour area, IN
1+ inRadar size estimate 17,450Population Affected 6,948Houses Affected HailHazards FreeAccount signup
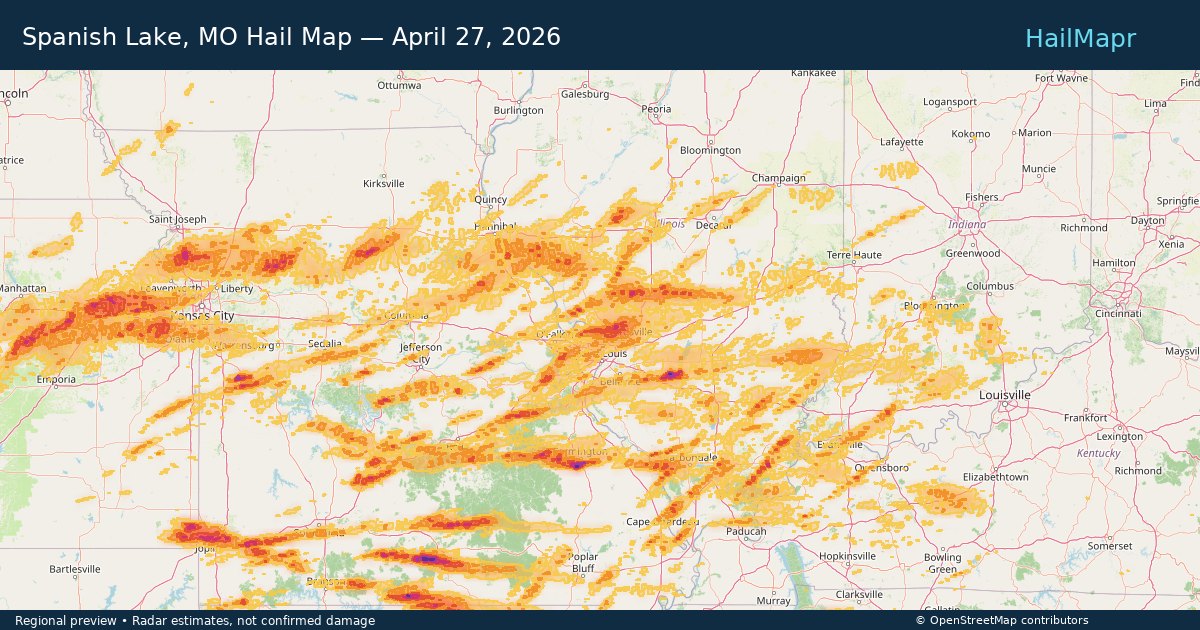
Spanish Lake, MO — April 27, 2026 — regional hail footprint preview
Storm footprint preview

Local hail summary for the Spanish Lake area: 7.49 square miles of estimated ground-hail footprint; highest mapped band 1+ inches. 0 official hail report(s) within the summary area. Exposure estimates are not confirmed property damage. Open the map to explore the full coverage included in your access. Statistics cover the mapped hail footprint inside the Census boundary of Spanish Lake, MO, not the entire region. The place had 18,413 residents in the 2020 Census. A boundary intersection does not mean the whole community was hit. Estimated housing exposure: 7,083 units in 1-inch-or-larger bands, including 0 in 1.5-inch-or-larger bands and 0 in 2-inch-or-larger bands.

Affected states: Spanish Lake area, MO
1+ inRadar size estimate 18,413Population Affected 8,862Houses Affected HailHazards FreeAccount signup
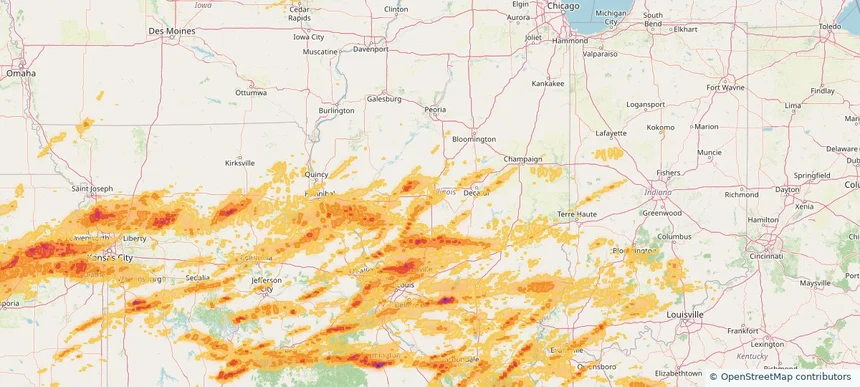
Springfield, IL — April 27, 2026 — regional hail footprint preview
Storm footprint preview

Local hail summary for the Springfield area: 10.46 square miles of estimated ground-hail footprint; highest mapped band 1+ inches. 0 official hail report(s) within the summary area. Exposure estimates are not confirmed property damage. Open the map to explore the full coverage included in your access. Statistics cover the mapped hail footprint inside the Census boundary of Springfield, IL, not the entire region. The place had 114,394 residents in the 2020 Census. A boundary intersection does not mean the whole community was hit. Estimated housing exposure: 310 units in 1-inch-or-larger bands, including 0 in 1.5-inch-or-larger bands and 0 in 2-inch-or-larger bands.

Affected states: Springfield area, IL
1+ inRadar size estimate 9,160Population Affected 3,981Houses Affected HailHazards FreeAccount signup
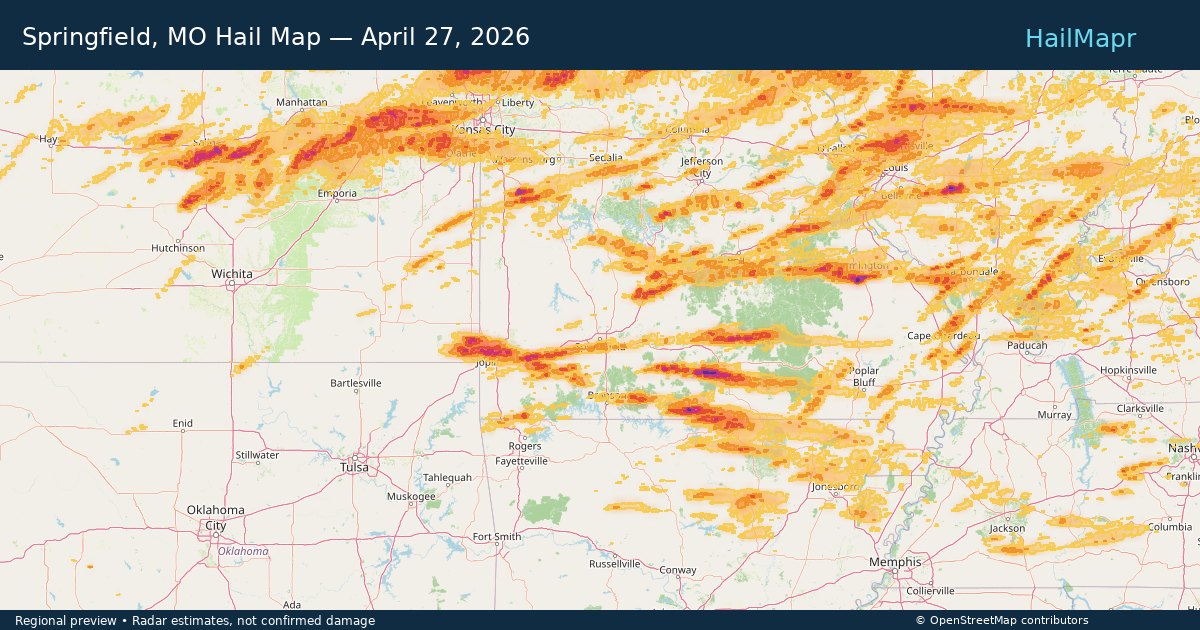
Springfield, MO — April 27, 2026 — regional hail footprint preview
Storm footprint preview

Local hail summary for the Springfield area: 22.36 square miles of estimated ground-hail footprint; highest mapped band 1+ inches. 1 official hail report(s) within the summary area. Exposure estimates are not confirmed property damage. Open the map to explore the full coverage included in your access. Statistics cover the mapped hail footprint inside the Census boundary of Springfield, MO, not the entire region. The place had 169,176 residents in the 2020 Census. A boundary intersection does not mean the whole community was hit. Estimated housing exposure: 18,407 units in 1-inch-or-larger bands, including 0 in 1.5-inch-or-larger bands and 0 in 2-inch-or-larger bands.

Affected states: Springfield area, MO
1+ inRadar size estimate 46,426Population Affected 23,678Houses Affected HailHazards FreeAccount signup
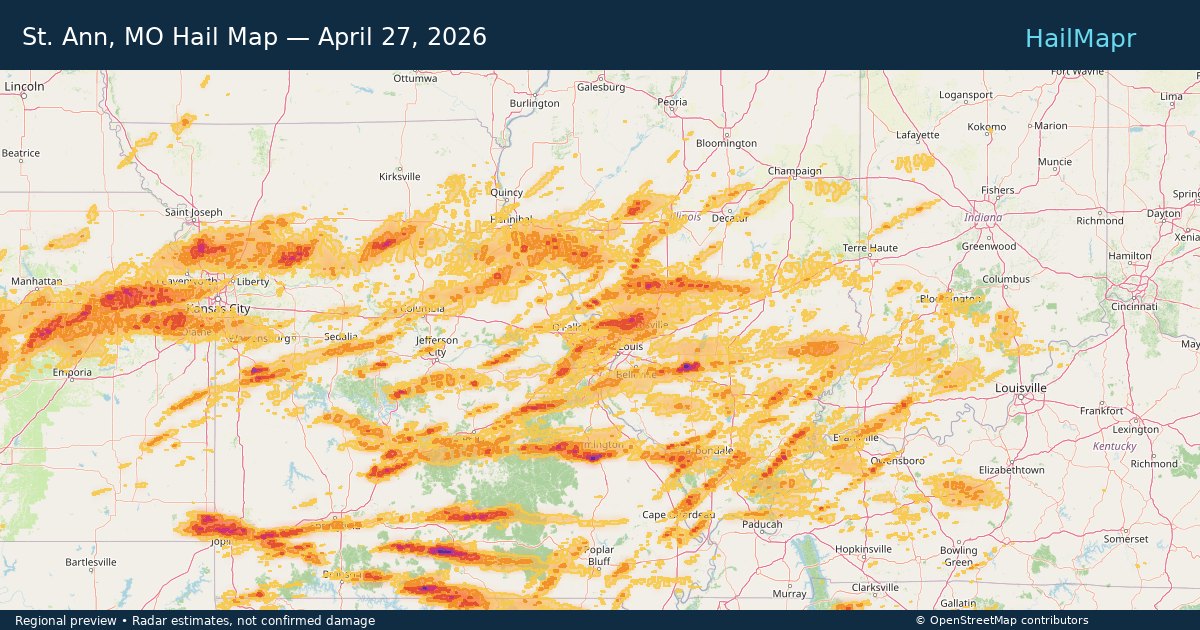
St. Ann, MO — April 27, 2026 — regional hail footprint preview
Storm footprint preview

Local hail summary for the St. Ann area: 1.31 square miles of estimated ground-hail footprint; highest mapped band 1+ inches. 0 official hail report(s) within the summary area. Exposure estimates are not confirmed property damage. Open the map to explore the full coverage included in your access. Statistics cover the mapped hail footprint inside the Census boundary of St. Ann, MO, not the entire region. The place had 13,019 residents in the 2020 Census. A boundary intersection does not mean the whole community was hit. Estimated housing exposure: 1,951 units in 1-inch-or-larger bands, including 0 in 1.5-inch-or-larger bands and 0 in 2-inch-or-larger bands.

Affected states: St. Ann area, MO
1+ inRadar size estimate 5,409Population Affected 2,595Houses Affected HailHazards FreeAccount signup
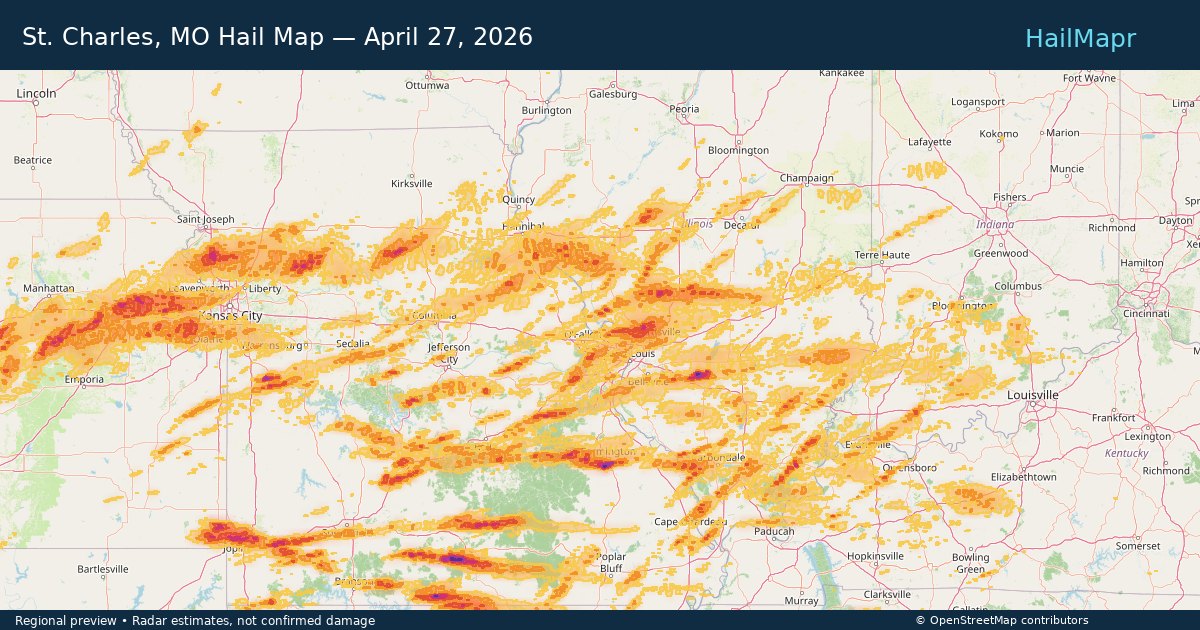
St. Charles, MO — April 27, 2026 — regional hail footprint preview
Storm footprint preview

Local hail summary for the St. Charles area: 6.21 square miles of estimated ground-hail footprint; highest mapped band 1+ inches. 0 official hail report(s) within the summary area. Exposure estimates are not confirmed property damage. Open the map to explore the full coverage included in your access. Statistics cover the mapped hail footprint inside the Census boundary of St. Charles, MO, not the entire region. The place had 70,493 residents in the 2020 Census. A boundary intersection does not mean the whole community was hit. Estimated housing exposure: 5,194 units in 1-inch-or-larger bands, including 0 in 1.5-inch-or-larger bands and 0 in 2-inch-or-larger bands.

Affected states: St. Charles area, MO
1+ inRadar size estimate 19,270Population Affected 9,367Houses Affected HailHazards FreeAccount signup
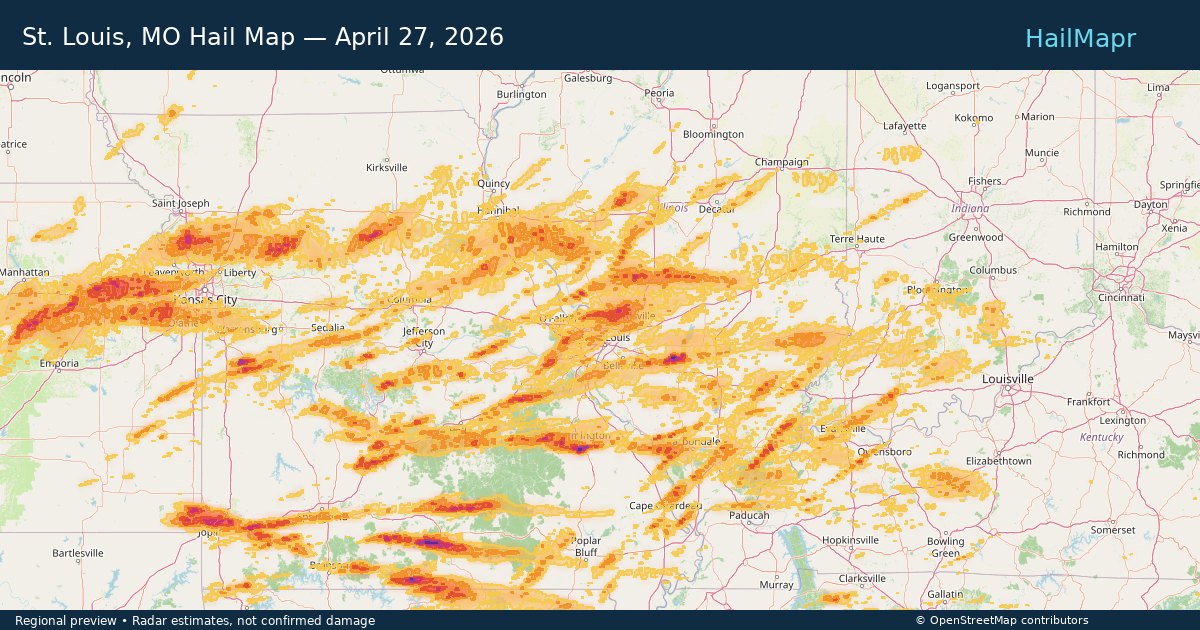
St. Louis, MO — April 27, 2026 — regional hail footprint preview
Storm footprint preview

Local hail summary for the St. Louis area: 20.35 square miles of estimated ground-hail footprint; highest mapped band 1+ inches. 2 official hail report(s) within the summary area. Exposure estimates are not confirmed property damage. Open the map to explore the full coverage included in your access. Statistics cover the mapped hail footprint inside the Census boundary of St. Louis, MO, not the entire region. The place had 301,578 residents in the 2020 Census. A boundary intersection does not mean the whole community was hit. Estimated housing exposure: 2,657 units in 1-inch-or-larger bands, including 0 in 1.5-inch-or-larger bands and 0 in 2-inch-or-larger bands.

Affected states: St. Louis area, MO
1+ inRadar size estimate 80,434Population Affected 46,679Houses Affected HailHazards FreeAccount signup
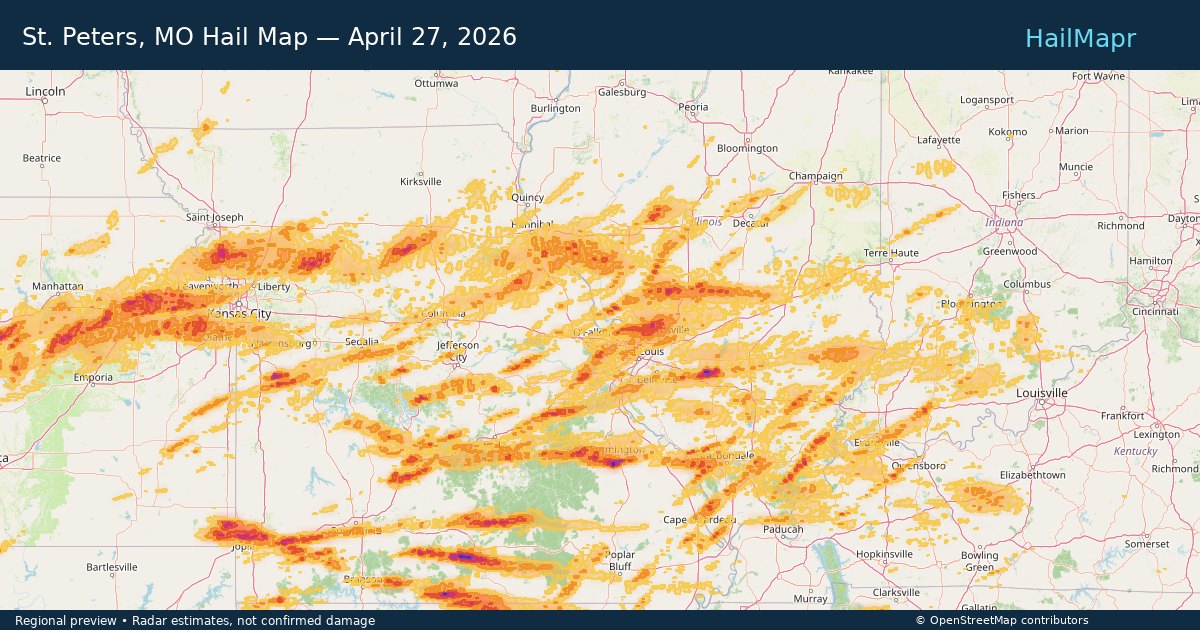
St. Peters, MO — April 27, 2026 — regional hail footprint preview
Storm footprint preview

Local hail summary for the St. Peters area: 0.51 square miles of estimated ground-hail footprint; highest mapped band 1+ inches. 0 official hail report(s) within the summary area. Exposure estimates are not confirmed property damage. Open the map to explore the full coverage included in your access. Statistics cover the mapped hail footprint inside the Census boundary of St. Peters, MO, not the entire region. The place had 57,732 residents in the 2020 Census. A boundary intersection does not mean the whole community was hit. Estimated housing exposure: 557 units in 1-inch-or-larger bands, including 0 in 1.5-inch-or-larger bands and 0 in 2-inch-or-larger bands.

Affected states: St. Peters area, MO
1+ inRadar size estimate 2,091Population Affected 940Houses Affected HailHazards FreeAccount signup
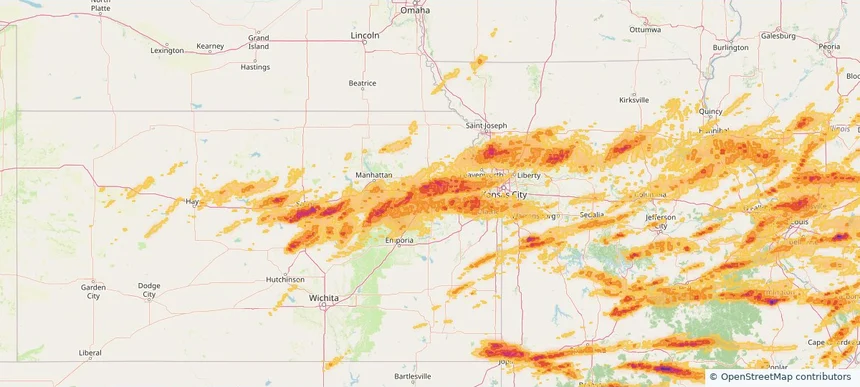
Topeka, KS — April 27, 2026 — regional hail footprint preview
Storm footprint preview

Local hail summary for the Topeka area: 62.75 square miles of estimated ground-hail footprint; highest mapped band 1.5+ inches. 2 official hail report(s) within the summary area. Exposure estimates are not confirmed property damage. Open the map to explore the full coverage included in your access. Statistics cover the mapped hail footprint inside the Census boundary of Topeka, KS, not the entire region. The place had 126,587 residents in the 2020 Census. A boundary intersection does not mean the whole community was hit. Estimated housing exposure: 57,410 units in 1-inch-or-larger bands, including 17,184 in 1.5-inch-or-larger bands and 0 in 2-inch-or-larger bands.

Affected states: Topeka area, KS
1.5+ inRadar size estimate 126,677Population Affected 60,081Houses Affected HailHazards FreeAccount signup
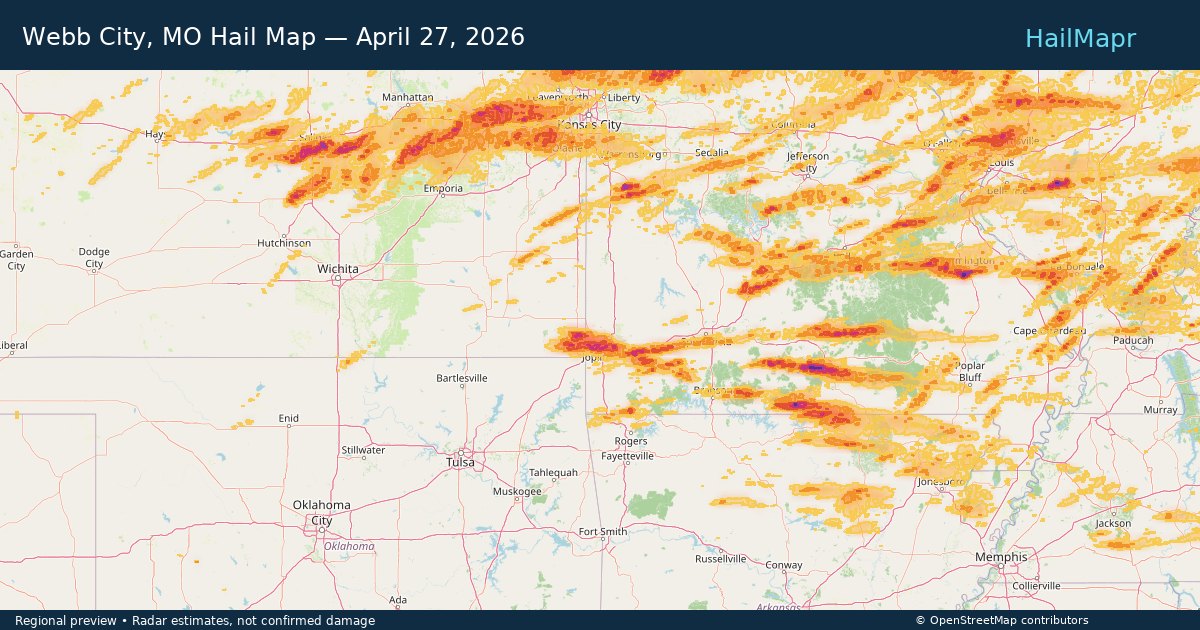
Webb City, MO — April 27, 2026 — regional hail footprint preview
Storm footprint preview

Local hail summary for the Webb City area: 8.64 square miles of estimated ground-hail footprint; highest mapped band 2+ inches. 0 official hail report(s) within the summary area. Exposure estimates are not confirmed property damage. Open the map to explore the full coverage included in your access. Statistics cover the mapped hail footprint inside the Census boundary of Webb City, MO, not the entire region. The place had 13,031 residents in the 2020 Census. A boundary intersection does not mean the whole community was hit. Estimated housing exposure: 5,582 units in 1-inch-or-larger bands, including 2,597 in 1.5-inch-or-larger bands and 8 in 2-inch-or-larger bands.

Affected states: Webb City area, MO
2+ inRadar size estimate 13,031Population Affected 5,582Houses Affected HailHazards FreeAccount signup
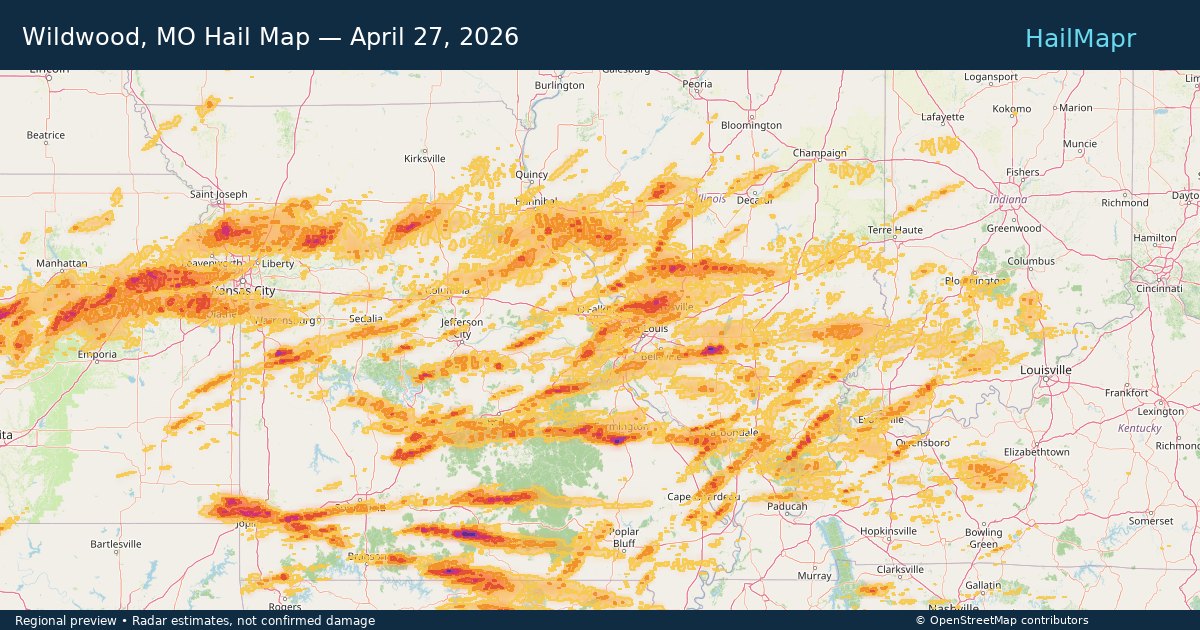
Wildwood, MO — April 27, 2026 — regional hail footprint preview
Storm footprint preview

Local hail summary for the Wildwood area: 41.79 square miles of estimated ground-hail footprint; highest mapped band 1.5+ inches. 0 official hail report(s) within the summary area. Exposure estimates are not confirmed property damage. Open the map to explore the full coverage included in your access. Statistics cover the mapped hail footprint inside the Census boundary of Wildwood, MO, not the entire region. The place had 35,417 residents in the 2020 Census. A boundary intersection does not mean the whole community was hit. Estimated housing exposure: 4,843 units in 1-inch-or-larger bands, including 1 in 1.5-inch-or-larger bands and 0 in 2-inch-or-larger bands.

Affected states: Wildwood area, MO
1.5+ inRadar size estimate 29,630Population Affected 10,827Houses Affected HailHazards FreeAccount signup
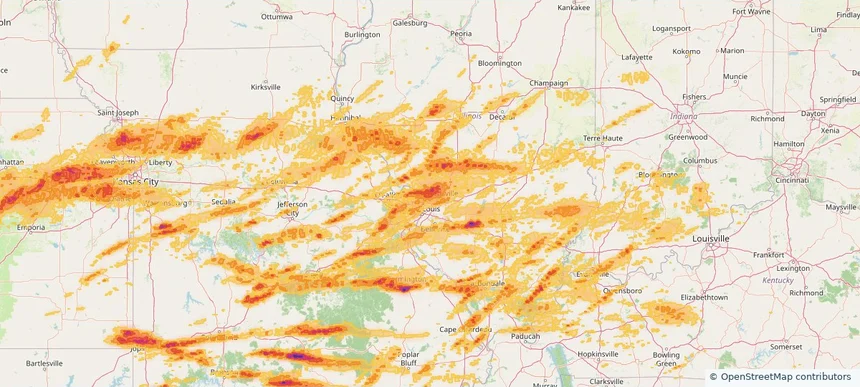
Wood River, IL — April 27, 2026 — regional hail footprint preview
Storm footprint preview

Local hail summary for the Wood River area: 7.23 square miles of estimated ground-hail footprint; highest mapped band 1.5+ inches. 0 official hail report(s) within the summary area. Exposure estimates are not confirmed property damage. Open the map to explore the full coverage included in your access. Statistics cover the mapped hail footprint inside the Census boundary of Wood River, IL, not the entire region. The place had 10,464 residents in the 2020 Census. A boundary intersection does not mean the whole community was hit. Estimated housing exposure: 4,933 units in 1-inch-or-larger bands, including 4,933 in 1.5-inch-or-larger bands and 0 in 2-inch-or-larger bands.

Affected states: Wood River area, IL
1.5+ inRadar size estimate 10,464Population Affected 4,933Houses Affected HailHazards FreeAccount signup
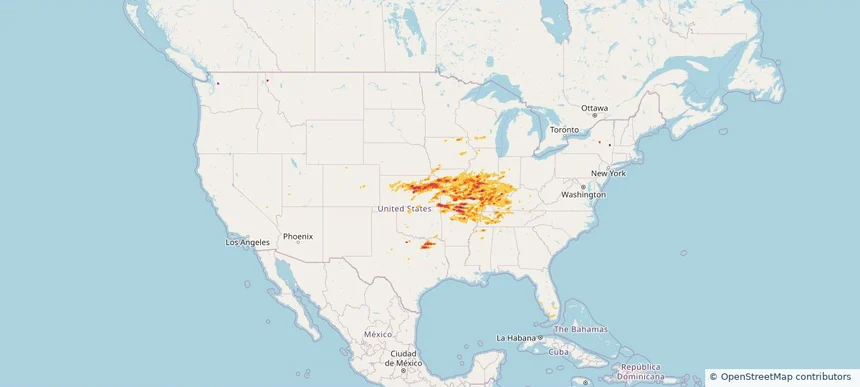
Nationwide Daily Hail, Wind & Tornado Map - April 27, 2026 — regional hail footprint preview
Storm footprint preview
Apr 26, 2026 10:00 PM to Apr 28, 2026 2:00 AM CST

Nationwide Daily Hail, Wind & Tornado Map - April 27, 2026

Hail as large as 4.00 inches was reported near 8 miles south-southwest of Piney Park, MO. Wind up to 92 mph was reported near Latham, IL. 33 tornadoes were reported, including one near Hallowell, KS. The storm had 117 official hail reports.

Affected states: National, AR, CO, FL, IL, IN, IA, KS, KY, MS, MO, MT, NE, NV, NY, OH, OK, TN, TX, WA, WI
3.0 inRadar size estimate 6,151,962Population Affected 2,684,634Houses Affected Hail · Wind · TornadoHazards FreeAccount signup
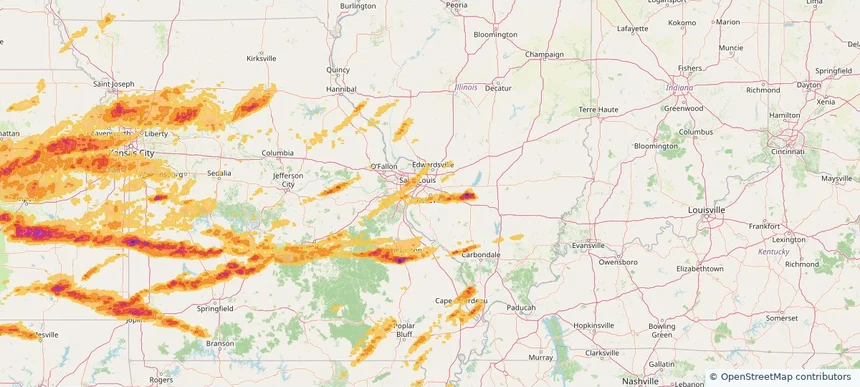
Belleville, IL — April 26, 2026 — regional hail footprint preview
Storm footprint preview

Local hail summary for the Belleville area: 6.97 square miles of estimated ground-hail footprint; highest mapped band 1+ inches. 1 official hail report(s) within the summary area. Exposure estimates are not confirmed property damage. Open the map to explore the full coverage included in your access. Statistics cover the mapped hail footprint inside the Census boundary of Belleville, IL, not the entire region. The place had 42,404 residents in the 2020 Census. A boundary intersection does not mean the whole community was hit. Estimated housing exposure: 1,218 units in 1-inch-or-larger bands, including 0 in 1.5-inch-or-larger bands and 0 in 2-inch-or-larger bands.

Affected states: Belleville area, IL
1+ inRadar size estimate 6,075Population Affected 2,345Houses Affected HailHazards FreeAccount signup
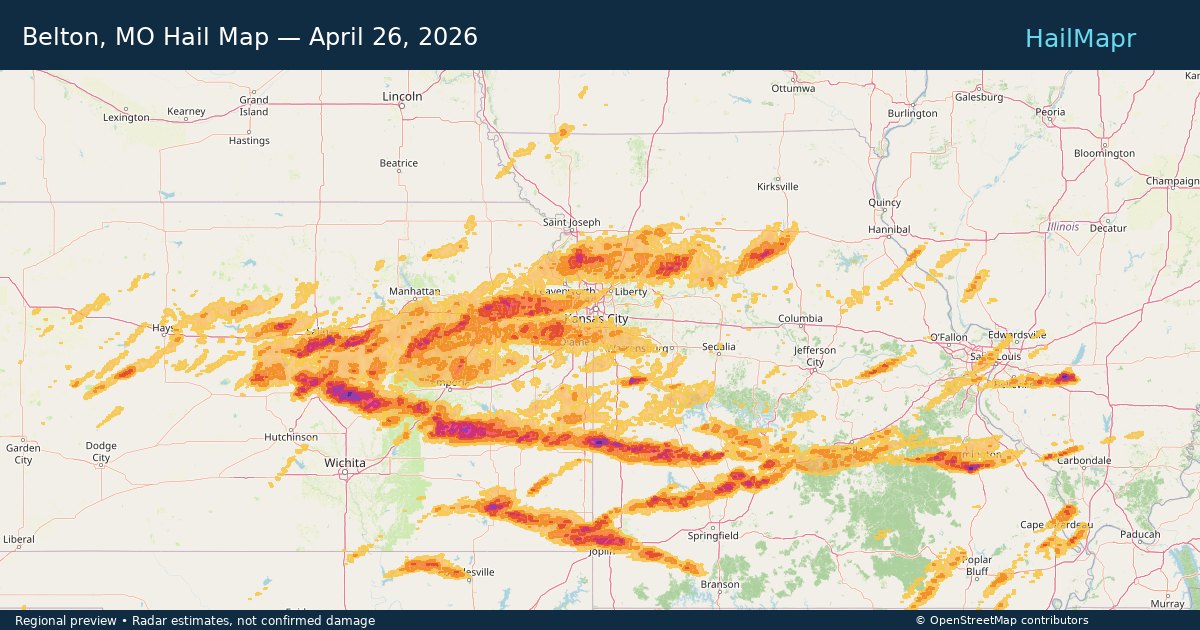
Belton, MO — April 26, 2026 — regional hail footprint preview
Storm footprint preview

Local hail summary for the Belton area: 9.25 square miles of estimated ground-hail footprint; highest mapped band 1+ inches. 0 official hail report(s) within the summary area. Exposure estimates are not confirmed property damage. Open the map to explore the full coverage included in your access. Statistics cover the mapped hail footprint inside the Census boundary of Belton, MO, not the entire region. The place had 23,953 residents in the 2020 Census. A boundary intersection does not mean the whole community was hit. Estimated housing exposure: 861 units in 1-inch-or-larger bands, including 0 in 1.5-inch-or-larger bands and 0 in 2-inch-or-larger bands.

Affected states: Belton area, MO
1+ inRadar size estimate 12,794Population Affected 5,227Houses Affected HailHazards FreeAccount signup
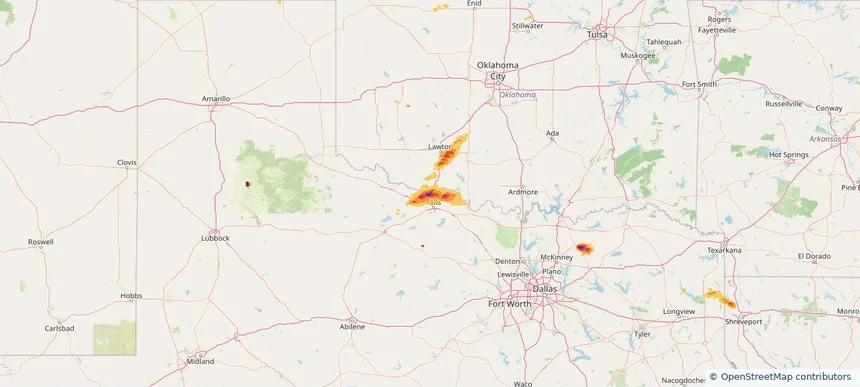
Burkburnett, TX — April 26, 2026 — regional hail footprint preview
Storm footprint preview

Local hail summary for the Burkburnett area: 11.57 square miles of estimated ground-hail footprint; highest mapped band 2.5+ inches. 1 official hail report(s) within the summary area. Exposure estimates are not confirmed property damage. Open the map to explore the full coverage included in your access. Statistics cover the mapped hail footprint inside the Census boundary of Burkburnett, TX, not the entire region. The place had 10,939 residents in the 2020 Census. A boundary intersection does not mean the whole community was hit. Estimated housing exposure: 4,638 units in 1-inch-or-larger bands, including 4,625 in 1.5-inch-or-larger bands and 3,476 in 2-inch-or-larger bands.

Affected states: Burkburnett area, TX
2.5+ inRadar size estimate 10,630Population Affected 4,638Houses Affected HailHazards FreeAccount signup
Page 50 of 100
‹ 1 49 50 51 100 ›

Frequently asked questions

Can I search hail maps by coverage area?

Yes. The storm library supports coverage-area filtering so you can find hail maps and hail swaths in a target service area.

What kinds of storms appear in the HailMapr library?

The library focuses on published hail events, including ready storm maps and live storms once hail has been detected and a public swath is available.

Are HailMapr storm pages useful for roofers and adjusters?

Yes. They are built to help roofers, adjusters, restoration teams, and property owners review storm footprints before purchase.