Storm library

Browse live and recent hail maps.

Review storm footprints, hail swaths, reports, and replay access. Create a free account to save your setup and move into map access when a storm matters.

Search filters
Clear
Newest storms first by default.
Don't see your storm? Request a qualifying storm map and we'll email you when it is ready.
Showing 73-96 of 2367 storms · Page 4 of 99
‹ 1 3 4 5 99 ›
Request a storm map

Tell us about the storm and we'll build the map. Once it's published you'll get an email and can purchase it from the library — just like any other event.

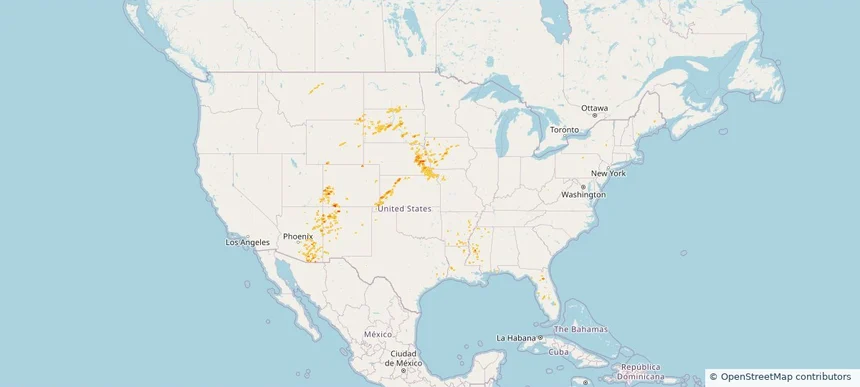
Nationwide Daily Hail & Wind Map - September 15, 2026 — regional hail footprint preview
Storm footprint preview
Sep 14, 2026 10:00 PM to Sep 16, 2026 1:50 AM CST

Nationwide Daily Hail & Wind Map - September 15, 2026

Hail as large as 2.00 inches was reported near Edgerton, KS. Wind up to 96 mph was reported near 1 mile south-southeast of Bear Lake, IN. The storm had 2 official hail reports.

Affected states: National, AZ, AR, CO, IL, IN, IA, KS, MI, MO, NE, NV, NM, OK, TX, UT, WY
2.5 inRadar size estimate 193,352Population Affected 87,654Houses Affected Hail · WindHazards FreeAccount signup
Tucson, AZ — September 14, 2026 — regional hail footprint preview
Storm footprint preview

Local hail summary for the Tucson area: 2.32 square miles of estimated ground-hail footprint; highest mapped band 1+ inches. 0 official hail report(s) within the summary area. Exposure estimates are not confirmed property damage. Open the map to explore the full coverage included in your access. Statistics cover the mapped hail footprint inside the Census boundary of Tucson, AZ, not the entire region. The place had 542,629 residents in the 2020 Census. A boundary intersection does not mean the whole community was hit. Estimated housing exposure: 1,604 units in 1-inch-or-larger bands, including 0 in 1.5-inch-or-larger bands and 0 in 2-inch-or-larger bands.

Affected states: Tucson area, AZ
1+ inRadar size estimate 13,706Population Affected 5,770Houses Affected HailHazards FreeAccount signup
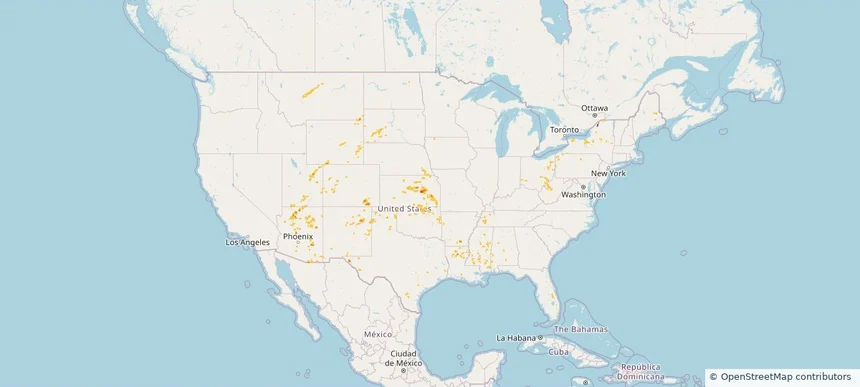
Nationwide Daily Hail, Wind & Tornado Map - September 14, 2026 — regional hail footprint preview
Storm footprint preview
Sep 13, 2026 10:00 PM to Sep 15, 2026 1:50 AM CST

Nationwide Daily Hail, Wind & Tornado Map - September 14, 2026

Hail as large as 1.00 inches was reported near 4 miles north of Monarch, MT. Wind up to 100 mph was reported near 3 miles northeast of Guide Rock, NE. 2 tornadoes were reported, including one near 3 miles southwest of Avoca, NE. The storm had 5 official hail reports.

Affected states: National, AZ, AR, CO, FL, IA, KS, LA, MS, MO, MT, NE, NM, ND, SD, TX, UT, WY
1.46 inRadar size estimate 193,221Population Affected 85,836Houses Affected Hail · Wind · TornadoHazards FreeAccount signup
Nationwide Daily Hail & Wind Map - September 13, 2026 — regional hail footprint preview
Storm footprint preview
Sep 12, 2026 10:00 PM to Sep 14, 2026 1:50 AM CST

Nationwide Daily Hail & Wind Map - September 13, 2026

Hail as large as 1.50 inches was reported near 5 miles southwest of Dunlap, KS. Wind up to 97 mph was reported near Chanute Martin Johnson, KS. The storm had 5 official hail reports.

Affected states: National, AL, AZ, AR, CO, IA, KS, LA, MS, MT, NE, NM, NY, OH, OK, PA, SD, TN, TX, UT, WV, WY
1.99 inRadar size estimate 49,292Population Affected 23,194Houses Affected Hail · WindHazards FreeAccount signup
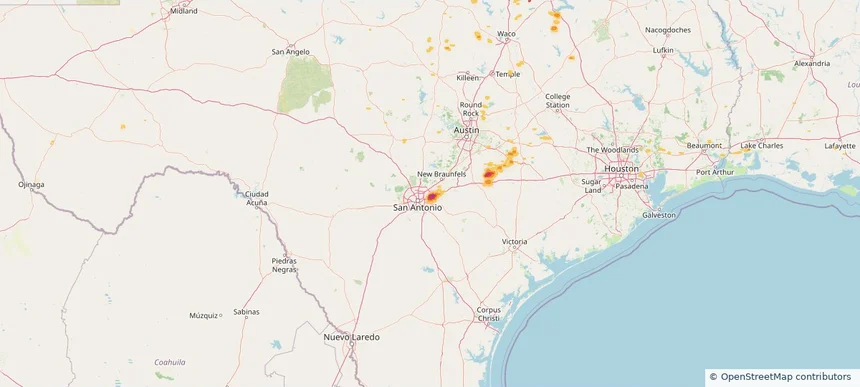
Converse, TX — September 12, 2026 — regional hail footprint preview
Storm footprint preview

Local hail summary for the Converse area: 2.87 square miles of estimated ground-hail footprint; highest mapped band 2+ inches. 0 official hail report(s) within the summary area. Exposure estimates are not confirmed property damage. Open the map to explore the full coverage included in your access. Statistics cover the mapped hail footprint inside the Census boundary of Converse, TX, not the entire region. The place had 27,466 residents in the 2020 Census. A boundary intersection does not mean the whole community was hit. Estimated housing exposure: 2,011 units in 1-inch-or-larger bands, including 434 in 1.5-inch-or-larger bands and 205 in 2-inch-or-larger bands.

Affected states: Converse area, TX
2+ inRadar size estimate 7,141Population Affected 2,294Houses Affected HailHazards FreeAccount signup
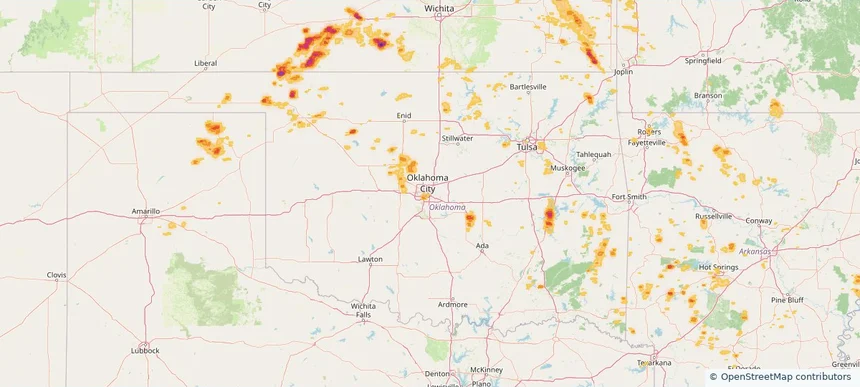
Oklahoma City, OK — September 12, 2026 — regional hail footprint preview
Storm footprint preview

Local hail summary for the Oklahoma City area: 0.51 square miles of estimated ground-hail footprint; highest mapped band 1+ inches. 1 official hail report(s) within the summary area. Exposure estimates are not confirmed property damage. Open the map to explore the full coverage included in your access. Statistics cover the mapped hail footprint inside the Census boundary of Oklahoma City, OK, not the entire region. The place had 681,054 residents in the 2020 Census. A boundary intersection does not mean the whole community was hit. Estimated housing exposure: 281 units in 1-inch-or-larger bands, including 0 in 1.5-inch-or-larger bands and 0 in 2-inch-or-larger bands.

Affected states: Oklahoma City area, OK
1+ inRadar size estimate 704Population Affected 281Houses Affected HailHazards FreeAccount signup
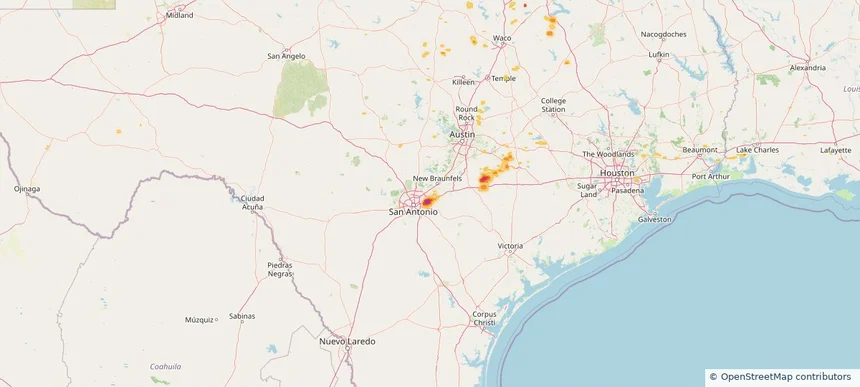
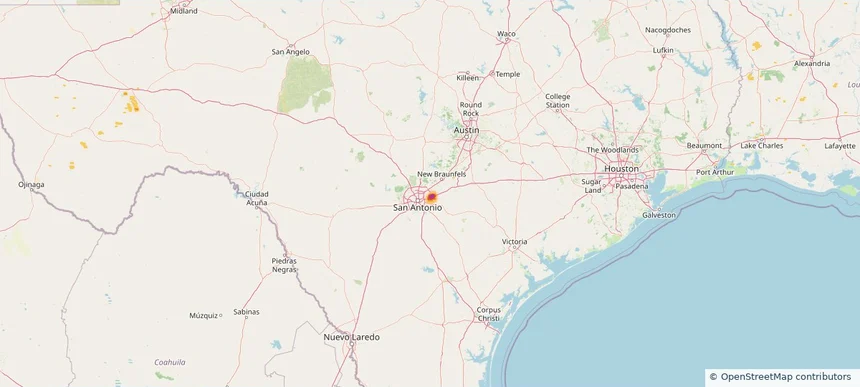
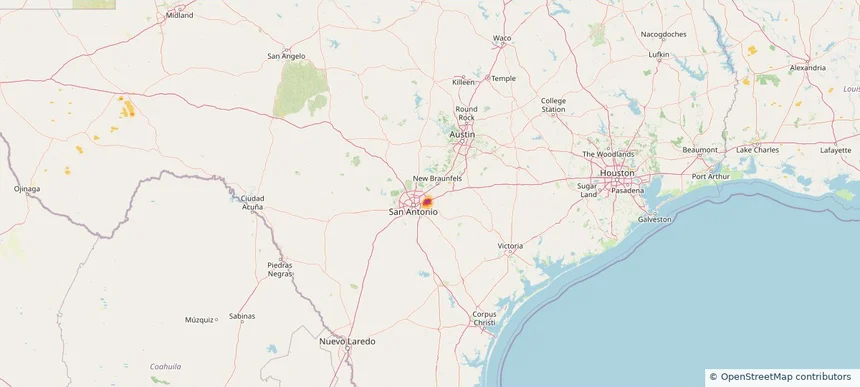
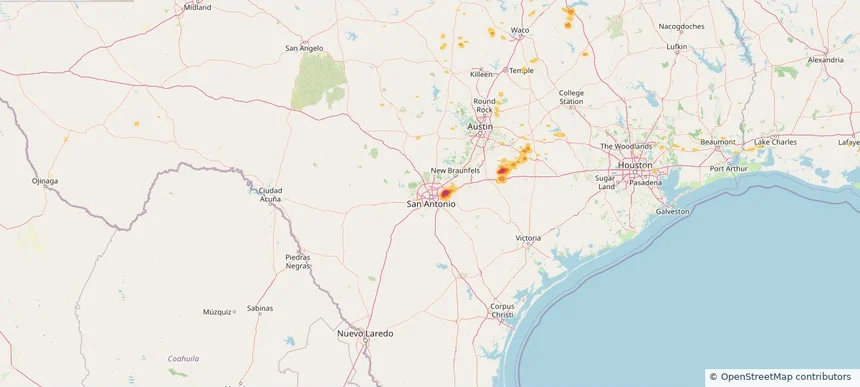
San Antonio, TX — September 12, 2026 — regional hail footprint preview
Storm footprint preview

Local hail summary for the San Antonio area: 8.68 square miles of estimated ground-hail footprint; highest mapped band 2.5+ inches. 1 official hail report(s) within the summary area. Exposure estimates are not confirmed property damage. Open the map to explore the full coverage included in your access. Statistics cover the mapped hail footprint inside the Census boundary of San Antonio, TX, not the entire region. The place had 1,434,625 residents in the 2020 Census. A boundary intersection does not mean the whole community was hit. Estimated housing exposure: 915 units in 1-inch-or-larger bands, including 830 in 1.5-inch-or-larger bands and 818 in 2-inch-or-larger bands.

Affected states: San Antonio area, TX
2.5+ inRadar size estimate 2,416Population Affected 916Houses Affected HailHazards FreeAccount signup
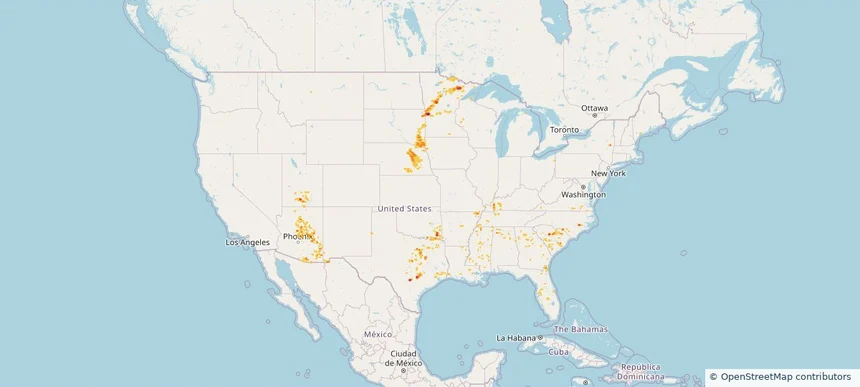
Schertz, TX — September 12, 2026 — regional hail footprint preview
Storm footprint preview

Local hail summary for the Schertz area: 7.21 square miles of estimated ground-hail footprint; highest mapped band 2.5+ inches. 0 official hail report(s) within the summary area. Exposure estimates are not confirmed property damage. Open the map to explore the full coverage included in your access. Statistics cover the mapped hail footprint inside the Census boundary of Schertz, TX, not the entire region. The place had 42,002 residents in the 2020 Census. A boundary intersection does not mean the whole community was hit. Estimated housing exposure: 684 units in 1-inch-or-larger bands, including 480 in 1.5-inch-or-larger bands and 464 in 2-inch-or-larger bands.

Affected states: Schertz area, TX
2.5+ inRadar size estimate 1,913Population Affected 684Houses Affected HailHazards FreeAccount signup
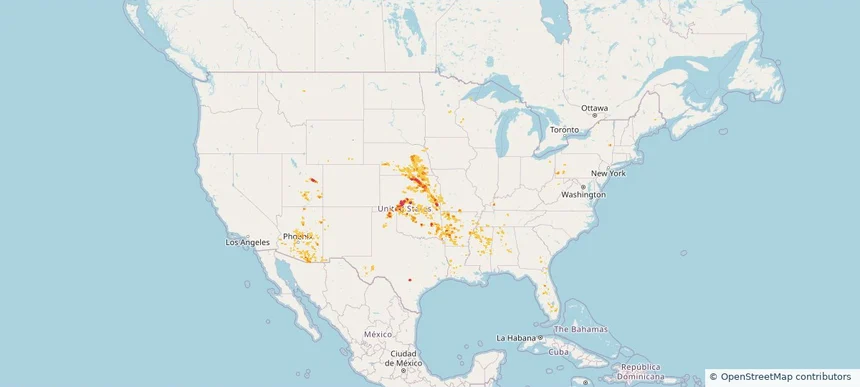
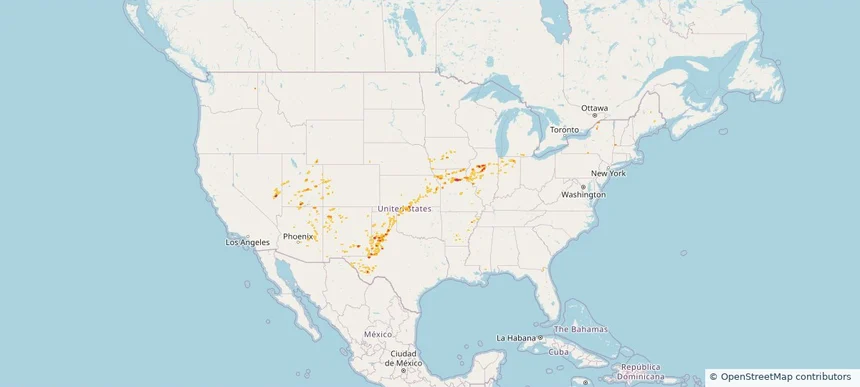
Nationwide Daily Hail, Wind & Tornado Map - September 12, 2026 — regional hail footprint preview
Storm footprint preview
Sep 11, 2026 10:00 PM to Sep 13, 2026 1:58 AM CST

Nationwide Daily Hail, Wind & Tornado Map - September 12, 2026

Hail as large as 2.50 inches was reported near San Antonio 8.6 Sw, TX. Wind up to 97 mph was reported near Chanute Martin Johnson, KS. 2 tornadoes were reported, including one near 1 mile east-southeast of Spring Grove, VA. The storm had 17 official hail reports.

Affected states: National, AL, AZ, AR, FL, GA, IN, IA, KS, KY, LA, MS, MO, NE, NM, NY, OK, PA, TN, TX, UT, VA, WI
3.0 inRadar size estimate 418,798Population Affected 177,078Houses Affected Hail · Wind · TornadoHazards FreeAccount signup
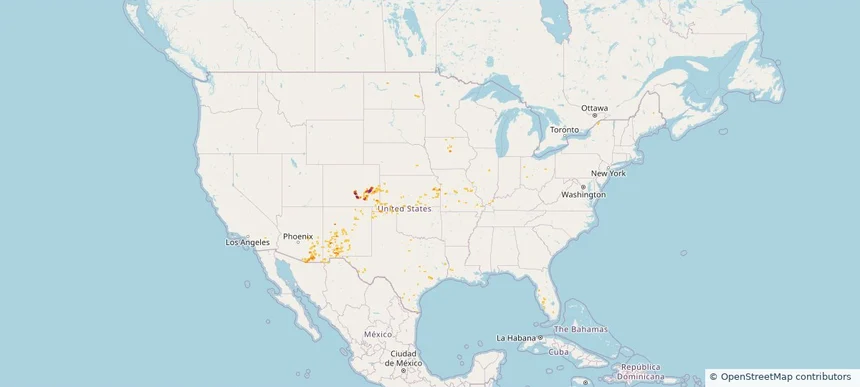
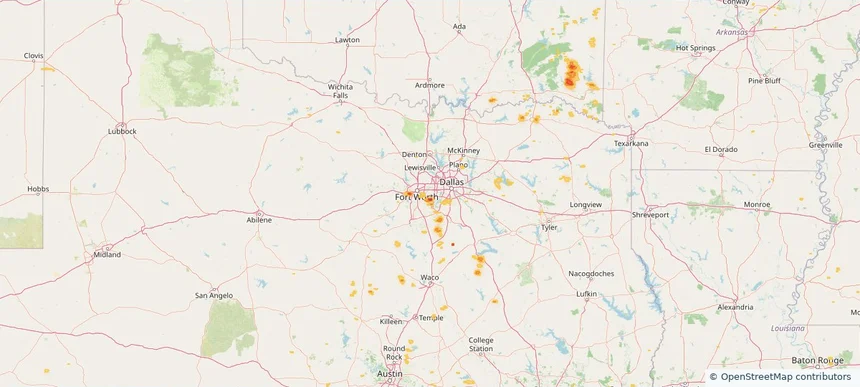
Arlington, TX — September 11, 2026 — regional hail footprint preview
Storm footprint preview

Local hail summary for the Arlington area: 5.40 square miles of estimated ground-hail footprint; highest mapped band 2+ inches. 1 official hail report(s) within the summary area. Exposure estimates are not confirmed property damage. Open the map to explore the full coverage included in your access. Statistics cover the mapped hail footprint inside the Census boundary of Arlington, TX, not the entire region. The place had 394,266 residents in the 2020 Census. A boundary intersection does not mean the whole community was hit. Estimated housing exposure: 6,102 units in 1-inch-or-larger bands, including 2,286 in 1.5-inch-or-larger bands and 1,081 in 2-inch-or-larger bands.

Affected states: Arlington area, TX
2+ inRadar size estimate 23,370Population Affected 7,305Houses Affected HailHazards FreeAccount signup
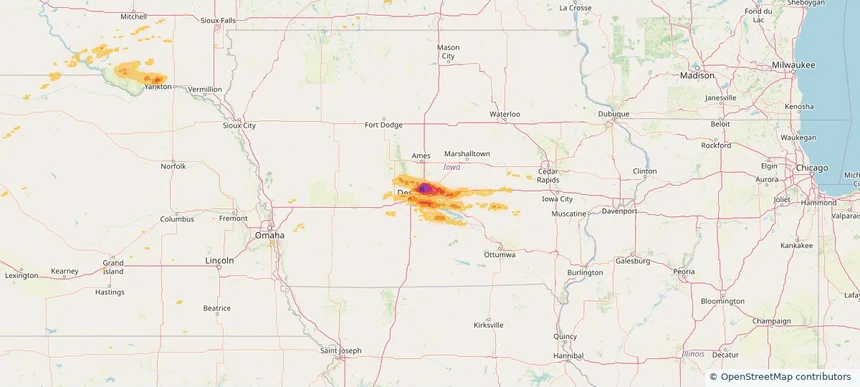
Benbrook, TX — September 11, 2026 — regional hail footprint preview
Storm footprint preview

Local hail summary for the Benbrook area: 1.65 square miles of estimated ground-hail footprint; highest mapped band 1.5+ inches. 0 official hail report(s) within the summary area. Exposure estimates are not confirmed property damage. Open the map to explore the full coverage included in your access. Statistics cover the mapped hail footprint inside the Census boundary of Benbrook, TX, not the entire region. The place had 24,520 residents in the 2020 Census. A boundary intersection does not mean the whole community was hit. Estimated housing exposure: 1,173 units in 1-inch-or-larger bands, including 0 in 1.5-inch-or-larger bands and 0 in 2-inch-or-larger bands.

Affected states: Benbrook area, TX
1.5+ inRadar size estimate 2,758Population Affected 1,173Houses Affected HailHazards FreeAccount signup
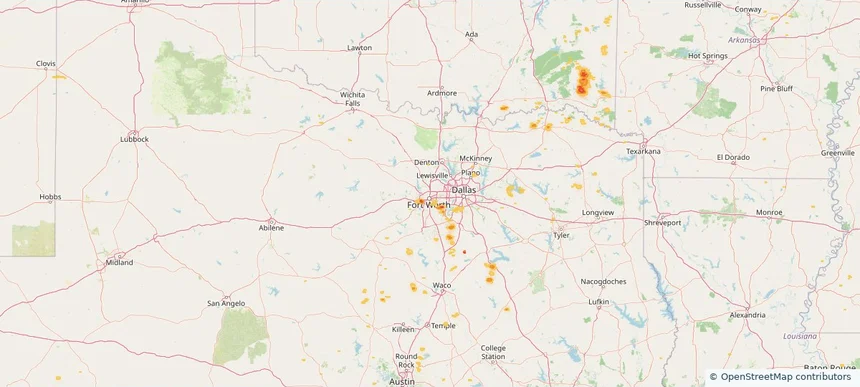
Converse, TX — September 11, 2026 — regional hail footprint preview
Storm footprint preview

Local hail summary for the Converse area: 2.86 square miles of estimated ground-hail footprint; highest mapped band 2+ inches. 0 official hail report(s) within the summary area. Exposure estimates are not confirmed property damage. Open the map to explore the full coverage included in your access. Statistics cover the mapped hail footprint inside the Census boundary of Converse, TX, not the entire region. The place had 27,466 residents in the 2020 Census. A boundary intersection does not mean the whole community was hit. Estimated housing exposure: 2,011 units in 1-inch-or-larger bands, including 434 in 1.5-inch-or-larger bands and 195 in 2-inch-or-larger bands.

Affected states: Converse area, TX
2+ inRadar size estimate 7,064Population Affected 2,291Houses Affected HailHazards FreeAccount signup
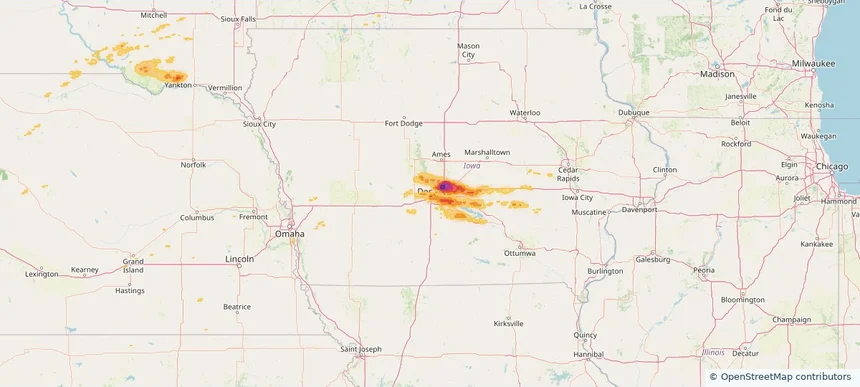
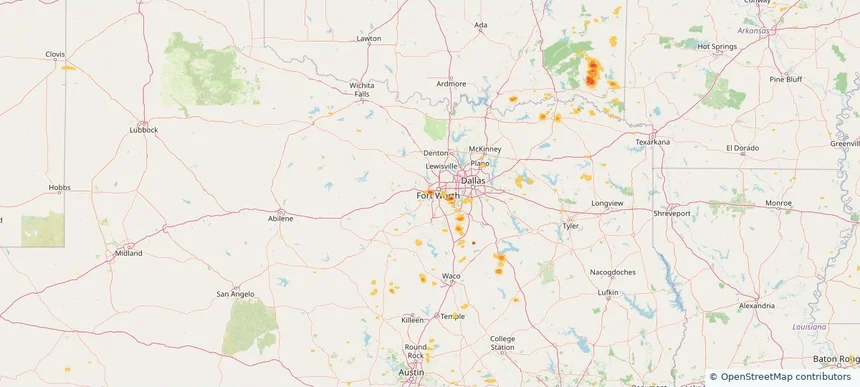
Fort Worth, TX — September 11, 2026 — regional hail footprint preview
Storm footprint preview

Local hail summary for the Fort Worth area: 3.64 square miles of estimated ground-hail footprint; highest mapped band 1.5+ inches. 0 official hail report(s) within the summary area. Exposure estimates are not confirmed property damage. Open the map to explore the full coverage included in your access. Statistics cover the mapped hail footprint inside the Census boundary of Fort Worth, TX, not the entire region. The place had 918,915 residents in the 2020 Census. A boundary intersection does not mean the whole community was hit. Estimated housing exposure: 4,803 units in 1-inch-or-larger bands, including 1,077 in 1.5-inch-or-larger bands and 0 in 2-inch-or-larger bands.

Affected states: Fort Worth area, TX
1.5+ inRadar size estimate 17,016Population Affected 8,500Houses Affected HailHazards FreeAccount signup
San Antonio, TX — September 11, 2026 — regional hail footprint preview
Storm footprint preview

Local hail summary for the San Antonio area: 8.73 square miles of estimated ground-hail footprint; highest mapped band 2.5+ inches. 0 official hail report(s) within the summary area. Exposure estimates are not confirmed property damage. Open the map to explore the full coverage included in your access. Statistics cover the mapped hail footprint inside the Census boundary of San Antonio, TX, not the entire region. The place had 1,434,625 residents in the 2020 Census. A boundary intersection does not mean the whole community was hit. Estimated housing exposure: 916 units in 1-inch-or-larger bands, including 838 in 1.5-inch-or-larger bands and 818 in 2-inch-or-larger bands.

Affected states: San Antonio area, TX
2.5+ inRadar size estimate 2,416Population Affected 916Houses Affected HailHazards FreeAccount signup
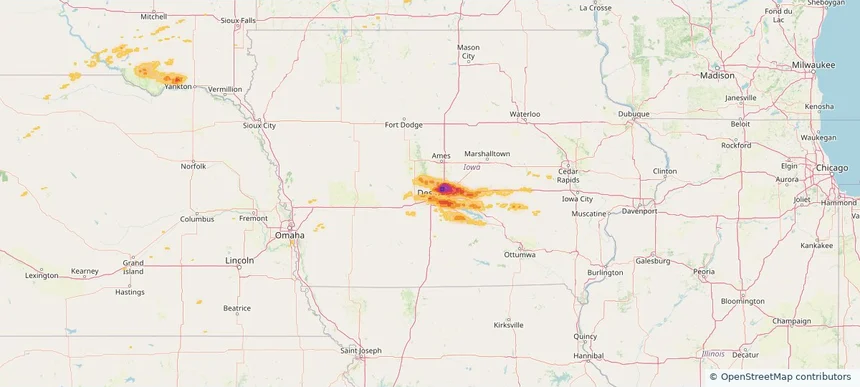
Schertz, TX — September 11, 2026 — regional hail footprint preview
Storm footprint preview

Local hail summary for the Schertz area: 8.97 square miles of estimated ground-hail footprint; highest mapped band 2.5+ inches. 0 official hail report(s) within the summary area. Exposure estimates are not confirmed property damage. Open the map to explore the full coverage included in your access. Statistics cover the mapped hail footprint inside the Census boundary of Schertz, TX, not the entire region. The place had 42,002 residents in the 2020 Census. A boundary intersection does not mean the whole community was hit. Estimated housing exposure: 720 units in 1-inch-or-larger bands, including 548 in 1.5-inch-or-larger bands and 309 in 2-inch-or-larger bands.

Affected states: Schertz area, TX
2.5+ inRadar size estimate 2,410Population Affected 864Houses Affected HailHazards FreeAccount signup
Nationwide Daily Hail, Wind & Tornado Map - September 11, 2026 — regional hail footprint preview
Storm footprint preview
Sep 10, 2026 10:00 PM to Sep 12, 2026 1:50 AM CST

Nationwide Daily Hail, Wind & Tornado Map - September 11, 2026

Hail as large as 2.50 inches was reported near 3 miles southeast of Converse, TX. Wind up to 78 mph was reported near 2 miles east of Deming, NM. 3 tornadoes were reported, including one near 4 miles northeast of Artichoke, MN. The storm had 17 official hail reports.

Affected states: National, AL, AZ, AR, FL, GA, ID, IN, IA, KY, LA, MN, MS, MO, NE, NM, NC, OK, SC, SD, TN, TX, UT, VA, WI
3.0 inRadar size estimate 379,853Population Affected 158,519Houses Affected Hail · Wind · TornadoHazards FreeAccount signup
Nationwide Daily Hail, Wind & Tornado Map - September 10, 2026 — regional hail footprint preview
Storm footprint preview
Sep 9, 2026 10:00 PM to Sep 11, 2026 1:50 AM CST

Nationwide Daily Hail, Wind & Tornado Map - September 10, 2026

Hail as large as 2.25 inches was reported near 1 mile south-southeast of Lake Tanglewood, TX. Wind up to 100 mph was reported near 1 mile southeast of Colby, KS. A tornado was reported near 3 miles southeast of Toluca, IL. The storm had 5 official hail reports.

Affected states: National, AL, AZ, AR, CO, FL, GA, ID, IL, KS, KY, LA, MO, NM, OH, OK, TX
3.65 inRadar size estimate 124,697Population Affected 57,829Houses Affected Hail · Wind · TornadoHazards FreeAccount signup
Nationwide Daily Hail, Wind & Tornado Map - September 9, 2026 — regional hail footprint preview
Storm footprint preview
Sep 8, 2026 10:00 PM to Sep 10, 2026 1:50 AM CST

Nationwide Daily Hail, Wind & Tornado Map - September 9, 2026

Hail as large as 2.00 inches was reported near 2 miles east-northeast of Colorado City, CO. Wind up to 90 mph was reported near 11 miles east-northeast of Patagonia, AZ. 2 tornadoes were reported, including one near 2 miles west-southwest of Cyclone, PA. The storm had 2 official hail reports.

Affected states: National, AZ, CO, FL, IA, KS, KY, MO, NM, ND, OH, OK, PA, TX, WV
3.0 inRadar size estimate 125,993Population Affected 51,787Houses Affected Hail · Wind · TornadoHazards FreeAccount signup
Altoona, IA — September 08, 2026 — regional hail footprint preview
Storm footprint preview

Local hail summary for the Altoona area: 10.45 square miles of estimated ground-hail footprint; highest mapped band 2+ inches. 0 official hail report(s) within the summary area. Exposure estimates are not confirmed property damage. Open the map to explore the full coverage included in your access. Statistics cover the mapped hail footprint inside the Census boundary of Altoona, IA, not the entire region. The place had 19,565 residents in the 2020 Census. A boundary intersection does not mean the whole community was hit. Estimated housing exposure: 5,938 units in 1-inch-or-larger bands, including 1,318 in 1.5-inch-or-larger bands and 0 in 2-inch-or-larger bands.

Affected states: Altoona area, IA
2+ inRadar size estimate 18,138Population Affected 7,554Houses Affected HailHazards FreeAccount signup
Ankeny, IA — September 08, 2026 — regional hail footprint preview
Storm footprint preview

Local hail summary for the Ankeny area: 26.34 square miles of estimated ground-hail footprint; highest mapped band 2.5+ inches. 1 official hail report(s) within the summary area. Exposure estimates are not confirmed property damage. Open the map to explore the full coverage included in your access. Statistics cover the mapped hail footprint inside the Census boundary of Ankeny, IA, not the entire region. The place had 67,887 residents in the 2020 Census. A boundary intersection does not mean the whole community was hit. Estimated housing exposure: 24,993 units in 1-inch-or-larger bands, including 21,117 in 1.5-inch-or-larger bands and 14,266 in 2-inch-or-larger bands.

Affected states: Ankeny area, IA
2.5+ inRadar size estimate 63,015Population Affected 26,362Houses Affected HailHazards FreeAccount signup
Clive, IA — September 08, 2026 — regional hail footprint preview
Storm footprint preview

Local hail summary for the Clive area: 1.08 square miles of estimated ground-hail footprint; highest mapped band 1+ inches. 0 official hail report(s) within the summary area. Exposure estimates are not confirmed property damage. Open the map to explore the full coverage included in your access. Statistics cover the mapped hail footprint inside the Census boundary of Clive, IA, not the entire region. The place had 18,601 residents in the 2020 Census. A boundary intersection does not mean the whole community was hit. Estimated housing exposure: 961 units in 1-inch-or-larger bands, including 0 in 1.5-inch-or-larger bands and 0 in 2-inch-or-larger bands.

Affected states: Clive area, IA
1+ inRadar size estimate 2,399Population Affected 961Houses Affected HailHazards FreeAccount signup
Des Moines, IA — September 08, 2026 — regional hail footprint preview
Storm footprint preview

Local hail summary for the Des Moines area: 37.92 square miles of estimated ground-hail footprint; highest mapped band 1.5+ inches. 0 official hail report(s) within the summary area. Exposure estimates are not confirmed property damage. Open the map to explore the full coverage included in your access. Statistics cover the mapped hail footprint inside the Census boundary of Des Moines, IA, not the entire region. The place had 214,133 residents in the 2020 Census. A boundary intersection does not mean the whole community was hit. Estimated housing exposure: 24,584 units in 1-inch-or-larger bands, including 6,024 in 1.5-inch-or-larger bands and 0 in 2-inch-or-larger bands.

Affected states: Des Moines area, IA
1.5+ inRadar size estimate 71,014Population Affected 32,625Houses Affected HailHazards FreeAccount signup
Urbandale, IA — September 08, 2026 — regional hail footprint preview
Storm footprint preview

Local hail summary for the Urbandale area: 1.48 square miles of estimated ground-hail footprint; highest mapped band 1+ inches. 0 official hail report(s) within the summary area. Exposure estimates are not confirmed property damage. Open the map to explore the full coverage included in your access. Statistics cover the mapped hail footprint inside the Census boundary of Urbandale, IA, not the entire region. The place had 45,580 residents in the 2020 Census. A boundary intersection does not mean the whole community was hit. Estimated housing exposure: 1,032 units in 1-inch-or-larger bands, including 0 in 1.5-inch-or-larger bands and 0 in 2-inch-or-larger bands.

Affected states: Urbandale area, IA
1+ inRadar size estimate 6,625Population Affected 2,996Houses Affected HailHazards FreeAccount signup
West Des Moines, IA — September 08, 2026 — regional hail footprint preview
Storm footprint preview

Local hail summary for the West Des Moines area: 3.30 square miles of estimated ground-hail footprint; highest mapped band 1+ inches. 0 official hail report(s) within the summary area. Exposure estimates are not confirmed property damage. Open the map to explore the full coverage included in your access. Statistics cover the mapped hail footprint inside the Census boundary of West Des Moines, IA, not the entire region. The place had 68,723 residents in the 2020 Census. A boundary intersection does not mean the whole community was hit. Estimated housing exposure: 4,597 units in 1-inch-or-larger bands, including 0 in 1.5-inch-or-larger bands and 0 in 2-inch-or-larger bands.

Affected states: West Des Moines area, IA
1+ inRadar size estimate 10,424Population Affected 4,964Houses Affected HailHazards FreeAccount signup
Page 4 of 99
‹ 1 3 4 5 99 ›

Frequently asked questions

Can I search hail maps by coverage area?

Yes. The storm library supports coverage-area filtering so you can find hail maps and hail swaths in a target service area.

What kinds of storms appear in the HailMapr library?

The library focuses on published hail events, including ready storm maps and live storms once hail has been detected and a public swath is available.

Are HailMapr storm pages useful for roofers and adjusters?

Yes. They are built to help roofers, adjusters, restoration teams, and property owners review storm footprints before purchase.