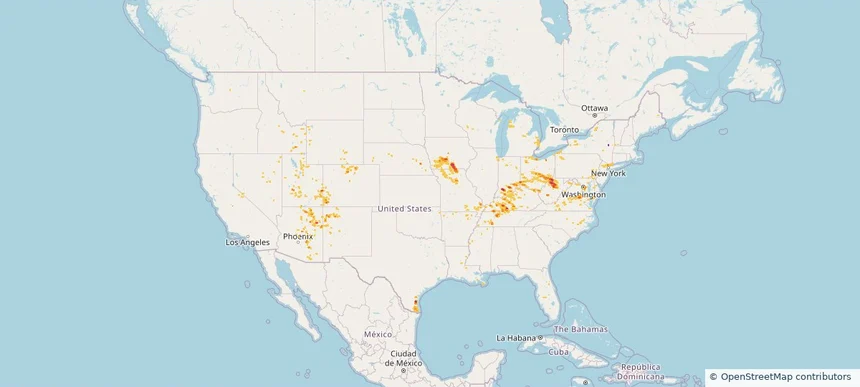
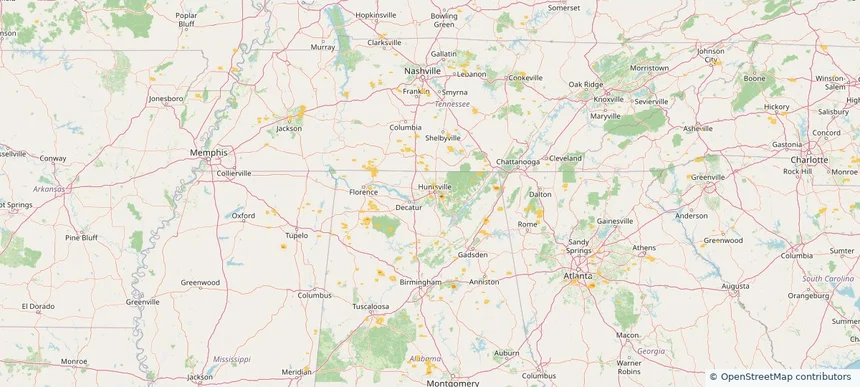
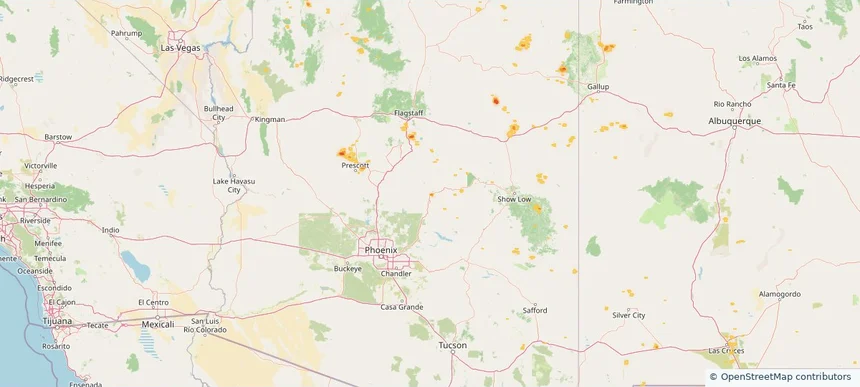
Nationwide Daily Hail & Wind Map - July 23, 2026
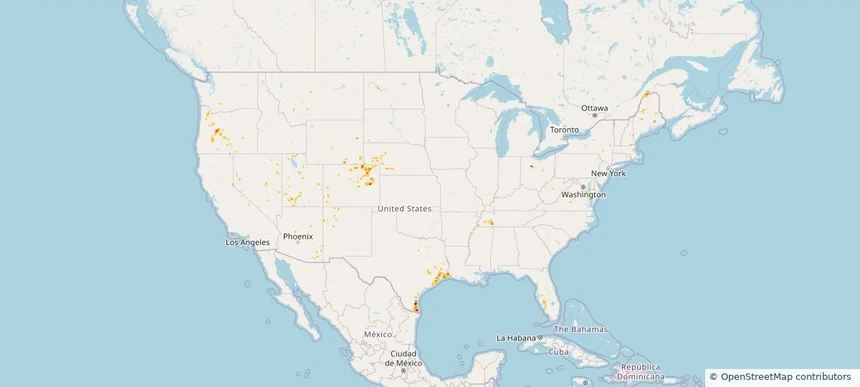
Hail as large as 1.75 inches was reported near Towner, CO. Wind up to 86 mph was reported near 12 miles southwest of Plymell, KS. The storm had 4 official hail reports.
Review storm footprints, hail swaths, reports, and replay access. Create a free account to save your setup and move into map access when a storm matters.

Hail as large as 1.75 inches was reported near Towner, CO. Wind up to 86 mph was reported near 12 miles southwest of Plymell, KS. The storm had 4 official hail reports.

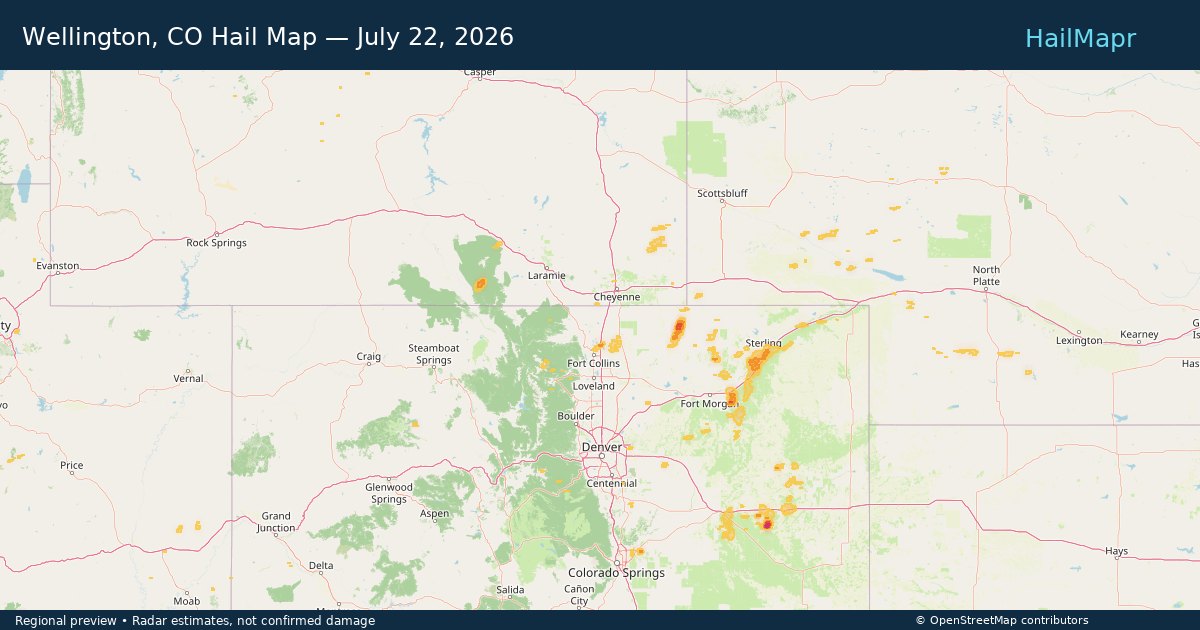
Local hail summary for the Wellington area: 0.23 square miles of estimated ground-hail footprint; highest mapped band 1+ inches. 0 official hail report(s) within the summary area. Exposure estimates are not confirmed property damage. Open the map to explore the full coverage included in your access. Statistics cover the mapped hail footprint inside the Census boundary of Wellington, CO, not the entire region. The place had 11,047 residents in the 2020 Census. A boundary intersection does not mean the whole community was hit. Estimated housing exposure: 153 units in 1-inch-or-larger bands, including 0 in 1.5-inch-or-larger bands and 0 in 2-inch-or-larger bands.

Radar estimates hail around 2.00 inches near Los Fresnos-Laureles, TX.

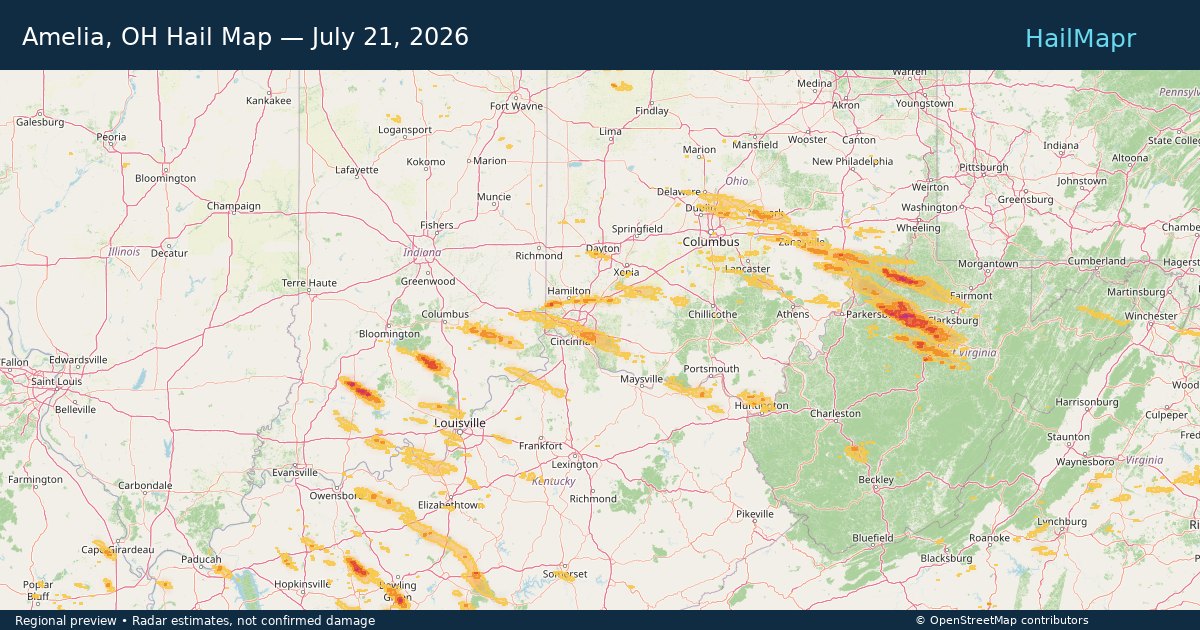
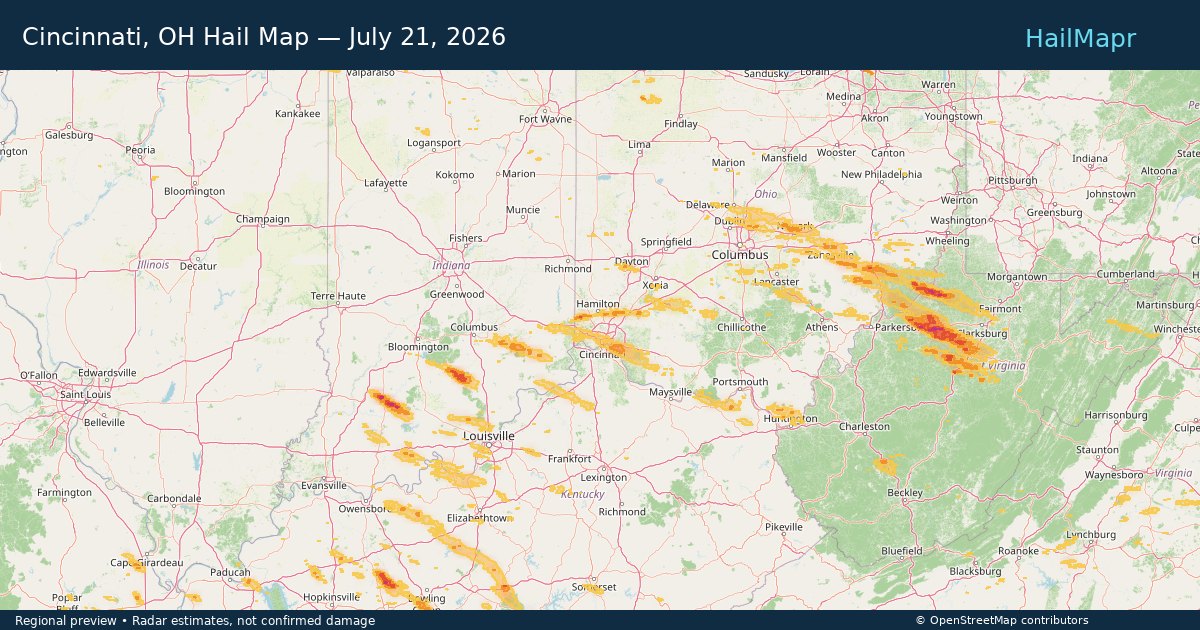
Local hail summary for the Amelia area: 4.24 square miles of estimated ground-hail footprint; highest mapped band 1+ inches. 0 official hail report(s) within the summary area. Exposure estimates are not confirmed property damage. Open the map to explore the full coverage included in your access. Statistics cover the mapped hail footprint inside the Census boundary of Amelia, OH, not the entire region. The place had 12,575 residents in the 2020 Census. A boundary intersection does not mean the whole community was hit. Estimated housing exposure: 160 units in 1-inch-or-larger bands, including 0 in 1.5-inch-or-larger bands and 0 in 2-inch-or-larger bands.

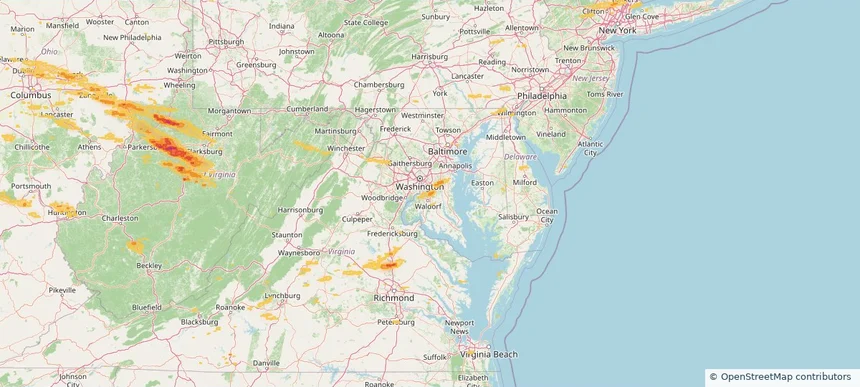
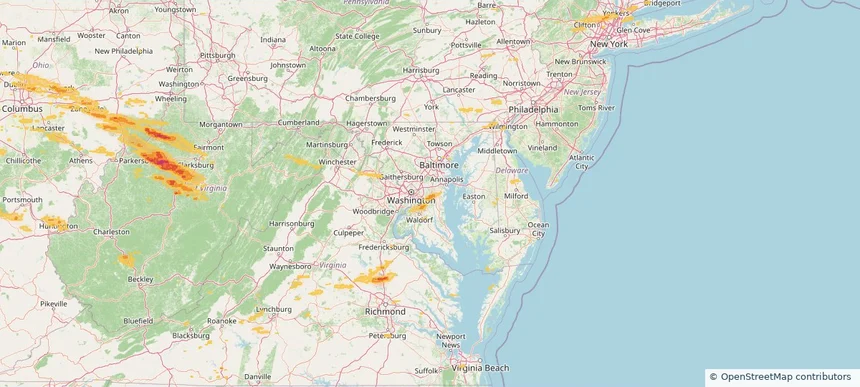
Local hail summary for the Brandywine area: 5.02 square miles of estimated ground-hail footprint; highest mapped band 1+ inches. 0 official hail report(s) within the summary area. Exposure estimates are not confirmed property damage. Open the map to explore the full coverage included in your access. Statistics cover the mapped hail footprint inside the Census boundary of Brandywine, MD, not the entire region. The place had 10,550 residents in the 2020 Census. A boundary intersection does not mean the whole community was hit. Estimated housing exposure: 671 units in 1-inch-or-larger bands, including 0 in 1.5-inch-or-larger bands and 0 in 2-inch-or-larger bands.

Local hail summary for the Brock Hall area: 2.08 square miles of estimated ground-hail footprint; highest mapped band 1+ inches. 0 official hail report(s) within the summary area. Exposure estimates are not confirmed property damage. Open the map to explore the full coverage included in your access. Statistics cover the mapped hail footprint inside the Census boundary of Brock Hall, MD, not the entire region. The place had 13,181 residents in the 2020 Census. A boundary intersection does not mean the whole community was hit. Estimated housing exposure: 1,047 units in 1-inch-or-larger bands, including 0 in 1.5-inch-or-larger bands and 0 in 2-inch-or-larger bands.

Local hail summary for the Cincinnati area: 4.47 square miles of estimated ground-hail footprint; highest mapped band 1+ inches. 0 official hail report(s) within the summary area. Exposure estimates are not confirmed property damage. Open the map to explore the full coverage included in your access. Statistics cover the mapped hail footprint inside the Census boundary of Cincinnati, OH, not the entire region. The place had 309,317 residents in the 2020 Census. A boundary intersection does not mean the whole community was hit. Estimated housing exposure: 5,029 units in 1-inch-or-larger bands, including 0 in 1.5-inch-or-larger bands and 0 in 2-inch-or-larger bands.

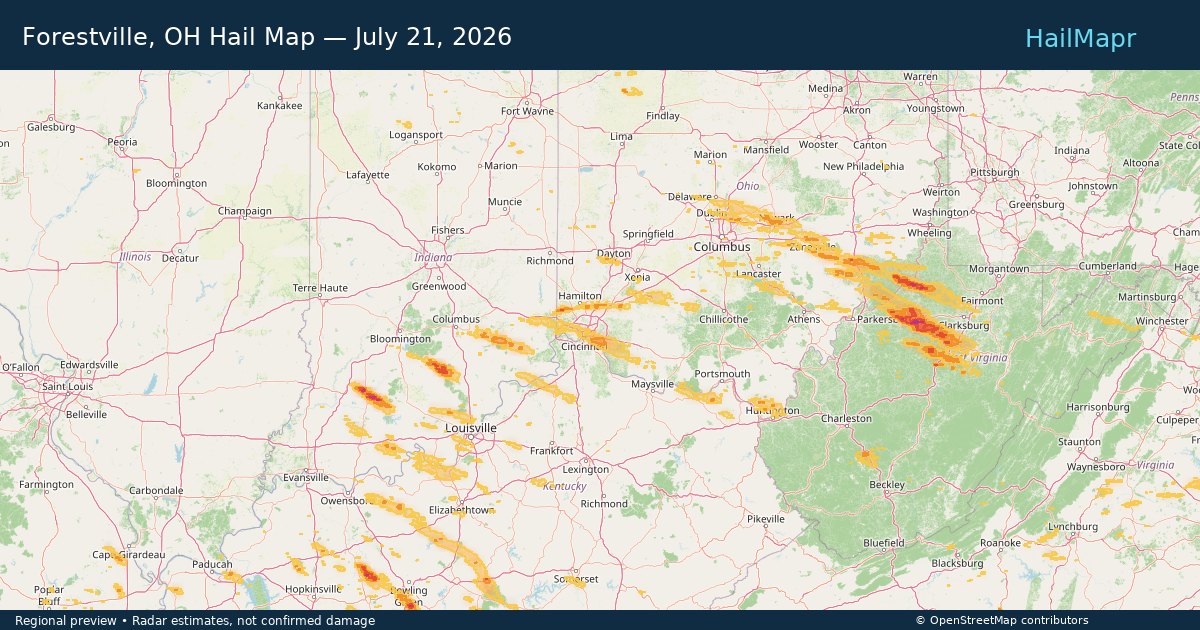
Local hail summary for the Forestville area: 3.70 square miles of estimated ground-hail footprint; highest mapped band 1+ inches. 0 official hail report(s) within the summary area. Exposure estimates are not confirmed property damage. Open the map to explore the full coverage included in your access. Statistics cover the mapped hail footprint inside the Census boundary of Forestville, OH, not the entire region. The place had 10,615 residents in the 2020 Census. A boundary intersection does not mean the whole community was hit. Estimated housing exposure: 4,315 units in 1-inch-or-larger bands, including 0 in 1.5-inch-or-larger bands and 0 in 2-inch-or-larger bands.

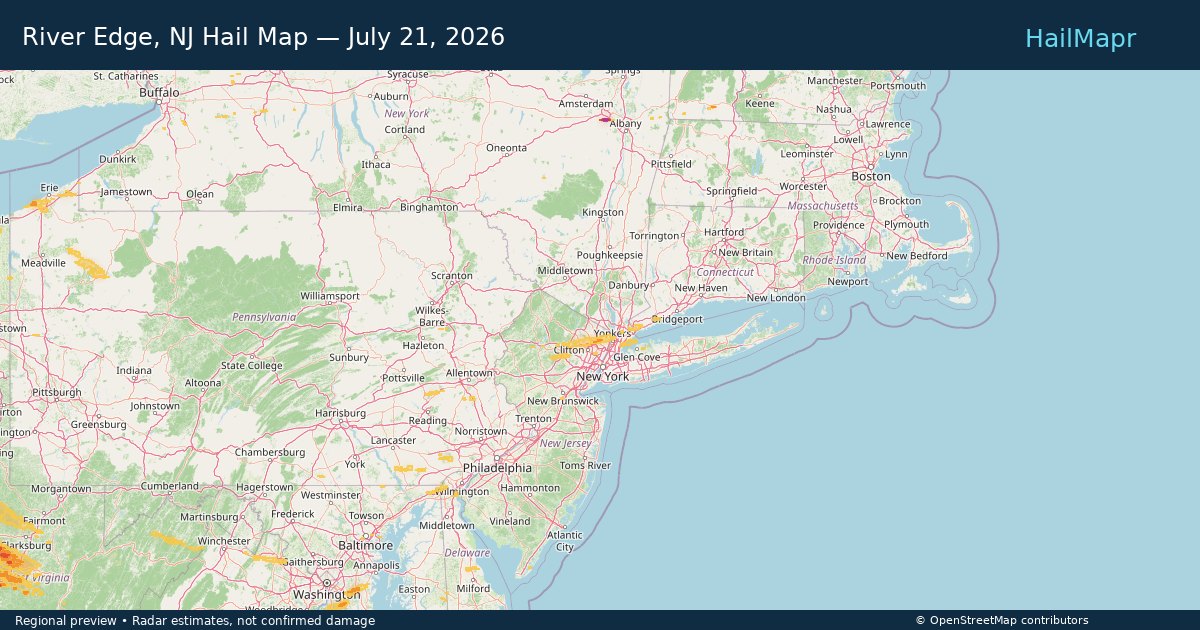
Local hail summary for the River Edge area: 0.63 square miles of estimated ground-hail footprint; highest mapped band 1+ inches. 0 official hail report(s) within the summary area. Exposure estimates are not confirmed property damage. Open the map to explore the full coverage included in your access. Statistics cover the mapped hail footprint inside the Census boundary of River Edge, NJ, not the entire region. The place had 12,049 residents in the 2020 Census. A boundary intersection does not mean the whole community was hit. Estimated housing exposure: 321 units in 1-inch-or-larger bands, including 0 in 1.5-inch-or-larger bands and 0 in 2-inch-or-larger bands.

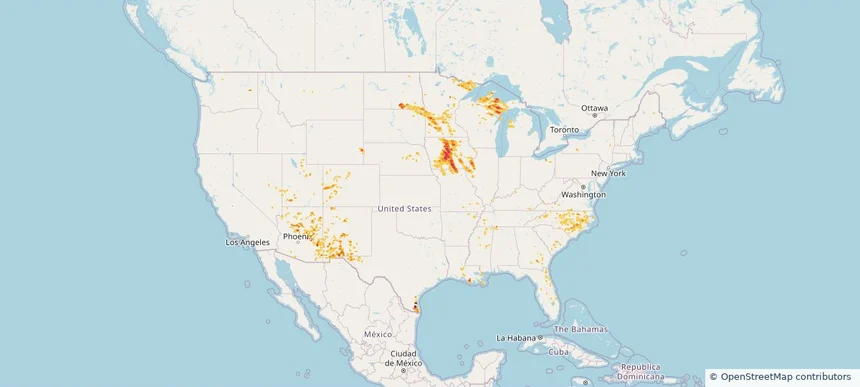
Hail as large as 2.25 inches was reported near Doswell, VA. Wind up to 92 mph was reported near Centerville, IA. 44 tornadoes were reported, including one near 7 miles north of Grantsville, WV. The storm had 5 official hail reports.

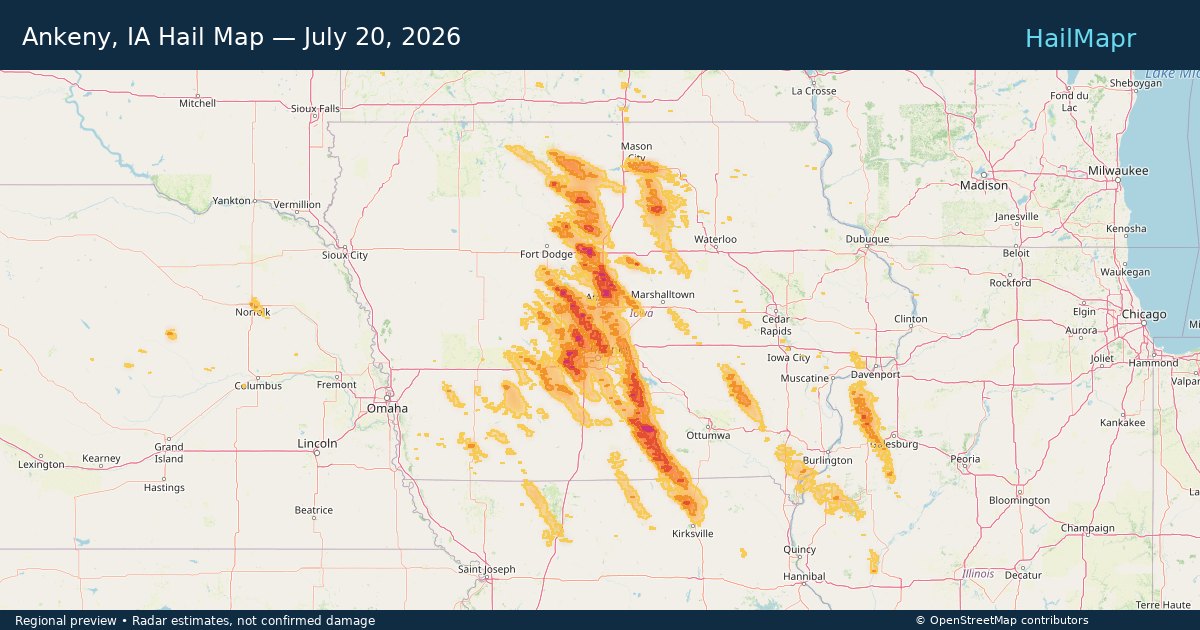
Local hail summary for the Ankeny area: 30.26 square miles of estimated ground-hail footprint; highest mapped band 1.5+ inches. 1 official hail report(s) within the summary area. Exposure estimates are not confirmed property damage. Open the map to explore the full coverage included in your access. Statistics cover the mapped hail footprint inside the Census boundary of Ankeny, IA, not the entire region. The place had 67,887 residents in the 2020 Census. A boundary intersection does not mean the whole community was hit. Estimated housing exposure: 27,777 units in 1-inch-or-larger bands, including 14,245 in 1.5-inch-or-larger bands and 0 in 2-inch-or-larger bands.

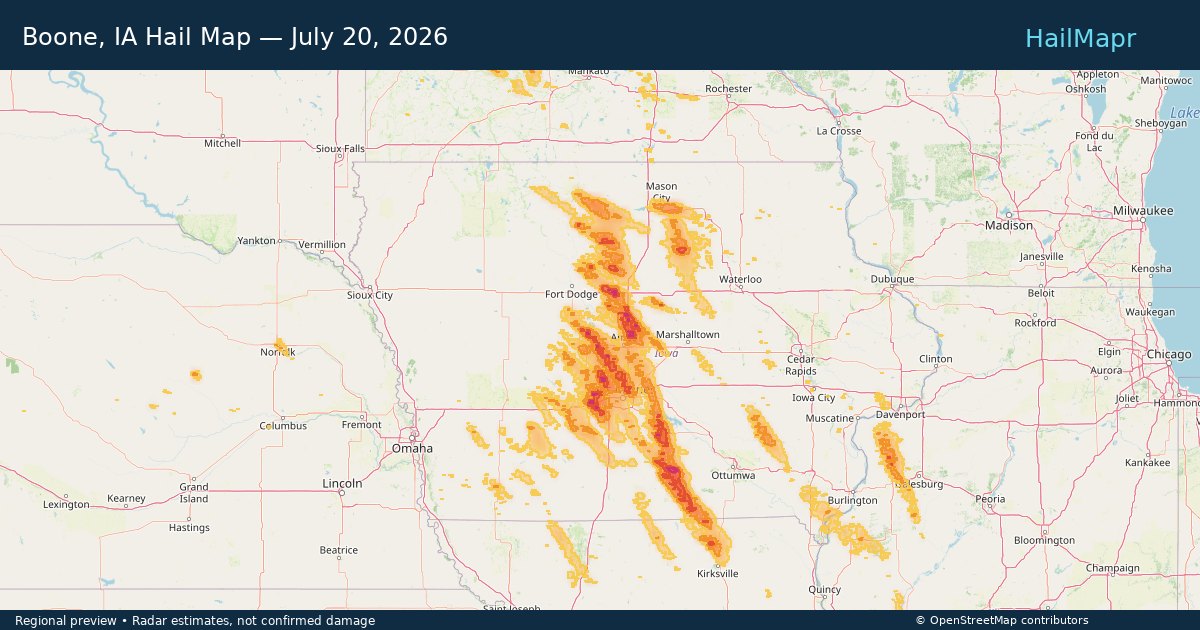
Local hail summary for the Boone area: 9.09 square miles of estimated ground-hail footprint; highest mapped band 1.5+ inches. 0 official hail report(s) within the summary area. Exposure estimates are not confirmed property damage. Open the map to explore the full coverage included in your access. Statistics cover the mapped hail footprint inside the Census boundary of Boone, IA, not the entire region. The place had 12,460 residents in the 2020 Census. A boundary intersection does not mean the whole community was hit. Estimated housing exposure: 4,945 units in 1-inch-or-larger bands, including 80 in 1.5-inch-or-larger bands and 0 in 2-inch-or-larger bands.

Local hail summary for the Clive area: 4.91 square miles of estimated ground-hail footprint; highest mapped band 1+ inches. 0 official hail report(s) within the summary area. Exposure estimates are not confirmed property damage. Open the map to explore the full coverage included in your access. Statistics cover the mapped hail footprint inside the Census boundary of Clive, IA, not the entire region. The place had 18,601 residents in the 2020 Census. A boundary intersection does not mean the whole community was hit. Estimated housing exposure: 2,113 units in 1-inch-or-larger bands, including 0 in 1.5-inch-or-larger bands and 0 in 2-inch-or-larger bands.

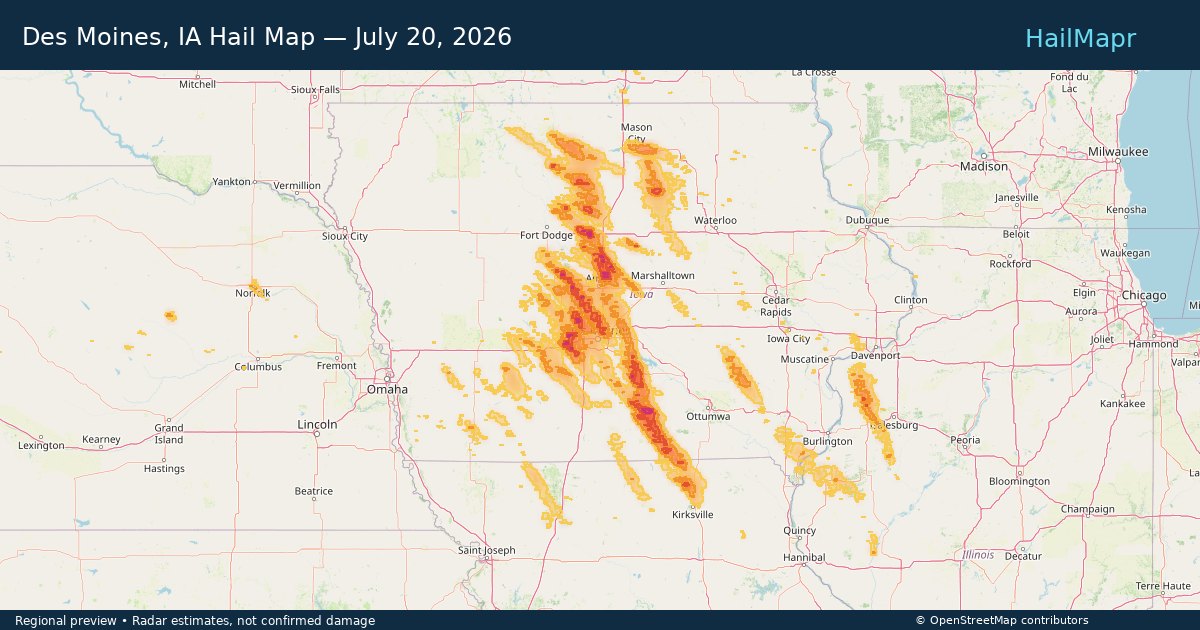
Local hail summary for the Des Moines area: 25.24 square miles of estimated ground-hail footprint; highest mapped band 1.5+ inches. 0 official hail report(s) within the summary area. Exposure estimates are not confirmed property damage. Open the map to explore the full coverage included in your access. Statistics cover the mapped hail footprint inside the Census boundary of Des Moines, IA, not the entire region. The place had 214,133 residents in the 2020 Census. A boundary intersection does not mean the whole community was hit. Estimated housing exposure: 13,101 units in 1-inch-or-larger bands, including 1,292 in 1.5-inch-or-larger bands and 0 in 2-inch-or-larger bands.

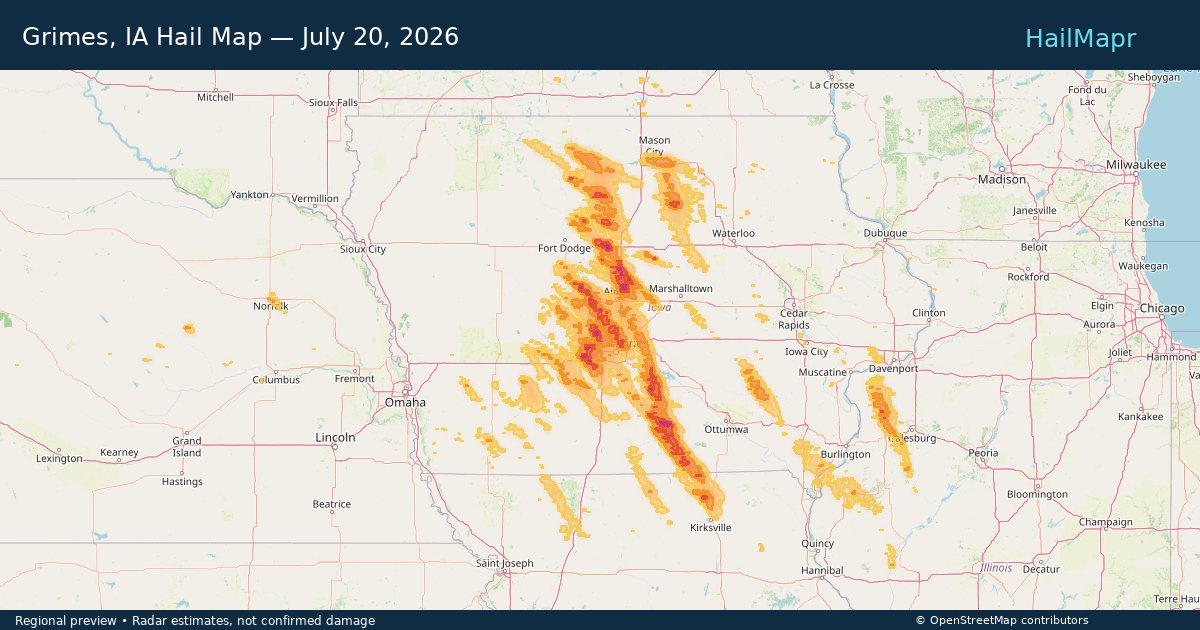
Local hail summary for the Grimes area: 11.82 square miles of estimated ground-hail footprint; highest mapped band 2+ inches. 0 official hail report(s) within the summary area. Exposure estimates are not confirmed property damage. Open the map to explore the full coverage included in your access. Statistics cover the mapped hail footprint inside the Census boundary of Grimes, IA, not the entire region. The place had 15,392 residents in the 2020 Census. A boundary intersection does not mean the whole community was hit. Estimated housing exposure: 6,019 units in 1-inch-or-larger bands, including 4,012 in 1.5-inch-or-larger bands and 15 in 2-inch-or-larger bands.

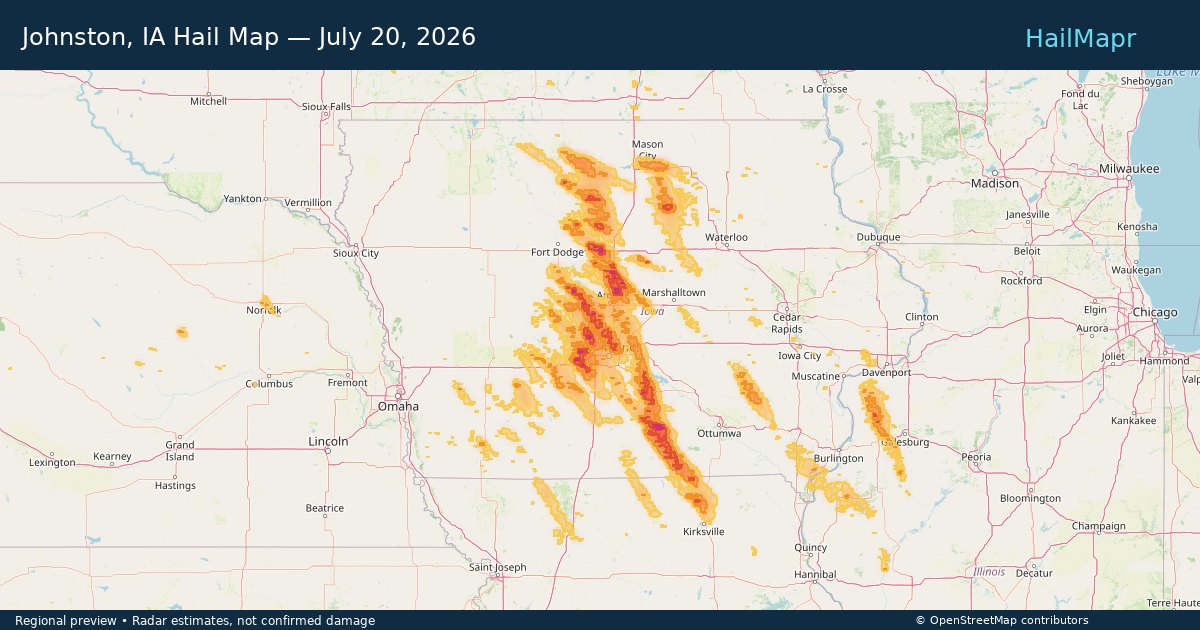
Local hail summary for the Johnston area: 20.88 square miles of estimated ground-hail footprint; highest mapped band 1+ inches. 0 official hail report(s) within the summary area. Exposure estimates are not confirmed property damage. Open the map to explore the full coverage included in your access. Statistics cover the mapped hail footprint inside the Census boundary of Johnston, IA, not the entire region. The place had 24,064 residents in the 2020 Census. A boundary intersection does not mean the whole community was hit. Estimated housing exposure: 8,871 units in 1-inch-or-larger bands, including 0 in 1.5-inch-or-larger bands and 0 in 2-inch-or-larger bands.

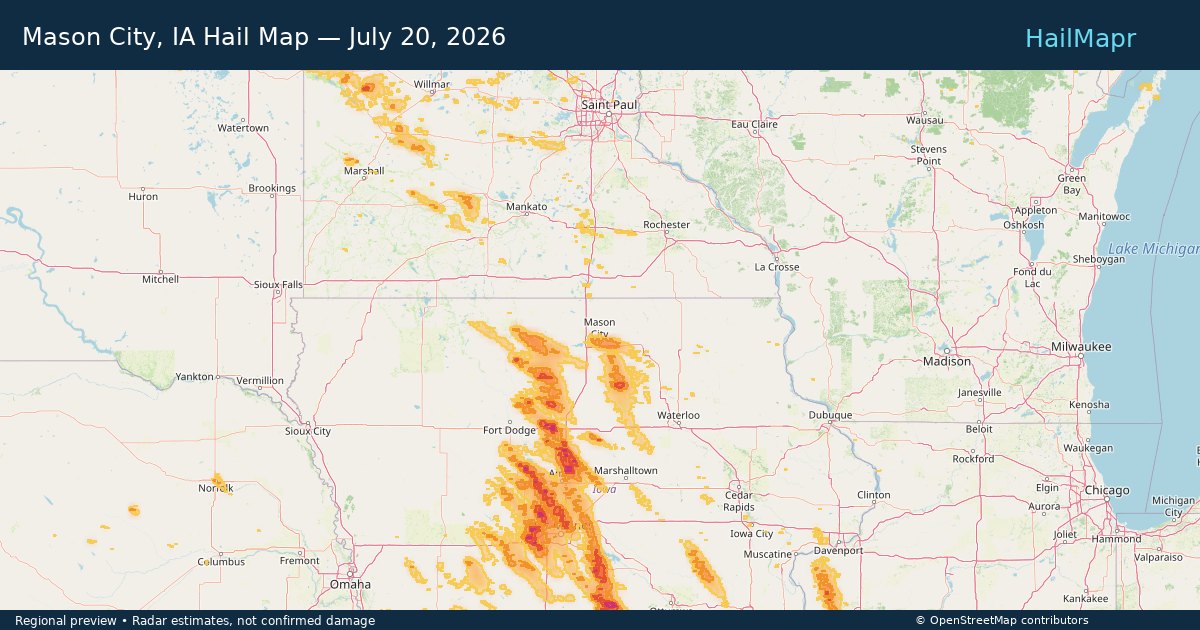
Local hail summary for the Mason City area: 15.61 square miles of estimated ground-hail footprint; highest mapped band 1+ inches. 0 official hail report(s) within the summary area. Exposure estimates are not confirmed property damage. Open the map to explore the full coverage included in your access. Statistics cover the mapped hail footprint inside the Census boundary of Mason City, IA, not the entire region. The place had 27,338 residents in the 2020 Census. A boundary intersection does not mean the whole community was hit. Estimated housing exposure: 3,990 units in 1-inch-or-larger bands, including 0 in 1.5-inch-or-larger bands and 0 in 2-inch-or-larger bands.

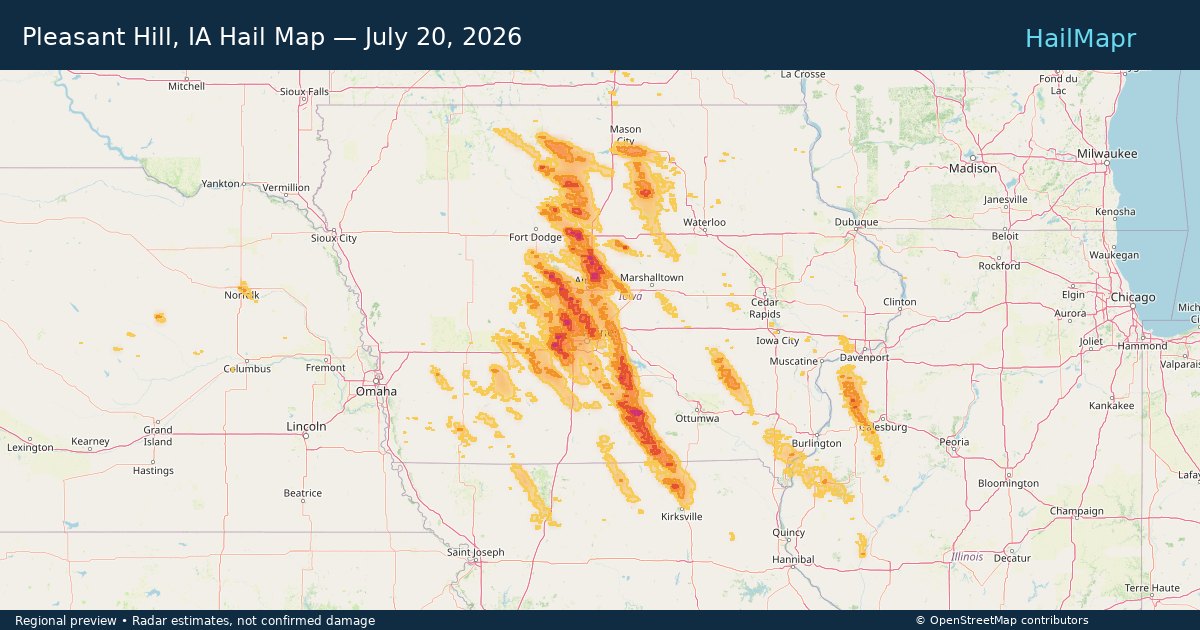
Local hail summary for the Pleasant Hill area: 4.15 square miles of estimated ground-hail footprint; highest mapped band 1+ inches. 0 official hail report(s) within the summary area. Exposure estimates are not confirmed property damage. Open the map to explore the full coverage included in your access. Statistics cover the mapped hail footprint inside the Census boundary of Pleasant Hill, IA, not the entire region. The place had 10,147 residents in the 2020 Census. A boundary intersection does not mean the whole community was hit. Estimated housing exposure: 862 units in 1-inch-or-larger bands, including 0 in 1.5-inch-or-larger bands and 0 in 2-inch-or-larger bands.

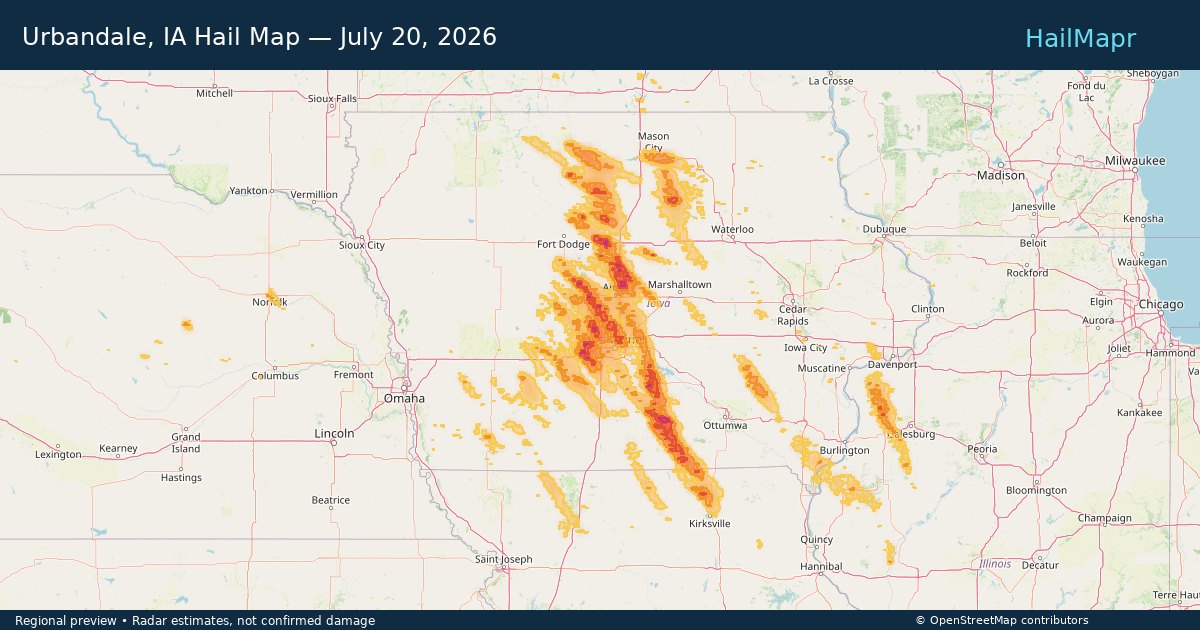
Local hail summary for the Urbandale area: 17.83 square miles of estimated ground-hail footprint; highest mapped band 1+ inches. 0 official hail report(s) within the summary area. Exposure estimates are not confirmed property damage. Open the map to explore the full coverage included in your access. Statistics cover the mapped hail footprint inside the Census boundary of Urbandale, IA, not the entire region. The place had 45,580 residents in the 2020 Census. A boundary intersection does not mean the whole community was hit. Estimated housing exposure: 12,609 units in 1-inch-or-larger bands, including 0 in 1.5-inch-or-larger bands and 0 in 2-inch-or-larger bands.

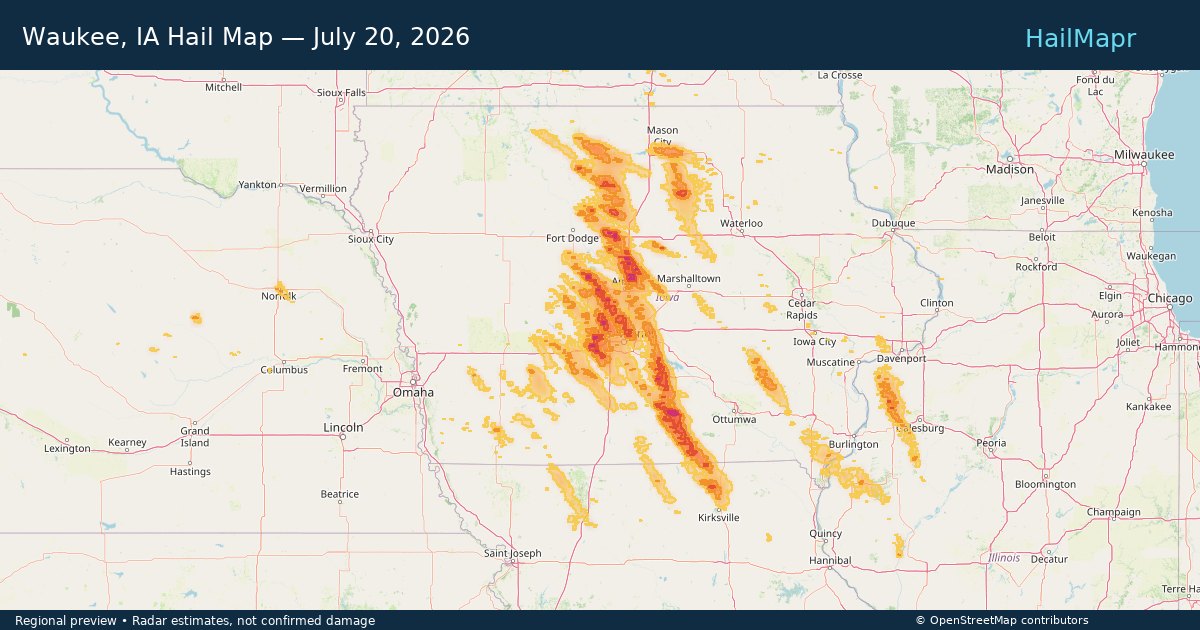
Local hail summary for the Waukee area: 20.82 square miles of estimated ground-hail footprint; highest mapped band 2+ inches. 0 official hail report(s) within the summary area. Exposure estimates are not confirmed property damage. Open the map to explore the full coverage included in your access. Statistics cover the mapped hail footprint inside the Census boundary of Waukee, IA, not the entire region. The place had 23,940 residents in the 2020 Census. A boundary intersection does not mean the whole community was hit. Estimated housing exposure: 9,729 units in 1-inch-or-larger bands, including 535 in 1.5-inch-or-larger bands and 1 in 2-inch-or-larger bands.

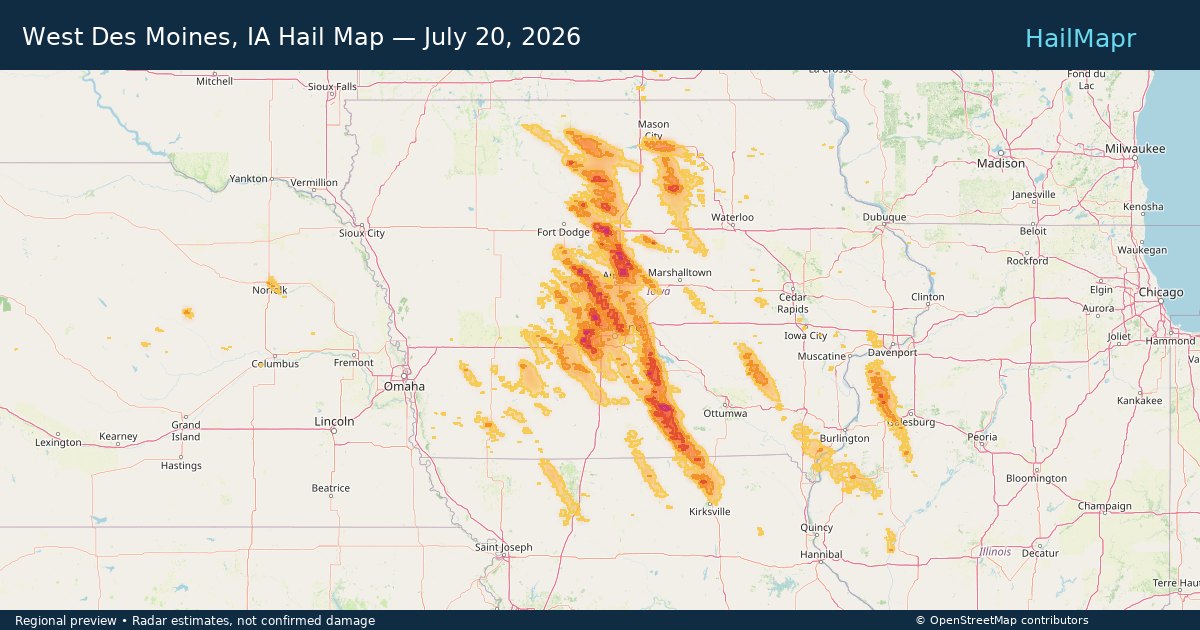
Local hail summary for the West Des Moines area: 31.52 square miles of estimated ground-hail footprint; highest mapped band 1.5+ inches. 1 official hail report(s) within the summary area. Exposure estimates are not confirmed property damage. Open the map to explore the full coverage included in your access. Statistics cover the mapped hail footprint inside the Census boundary of West Des Moines, IA, not the entire region. The place had 68,723 residents in the 2020 Census. A boundary intersection does not mean the whole community was hit. Estimated housing exposure: 10,000 units in 1-inch-or-larger bands, including 1 in 1.5-inch-or-larger bands and 0 in 2-inch-or-larger bands.

Hail as large as 3.25 inches was reported near 5 miles northeast of Watson, MI. Wind up to 92 mph was reported near 4 miles south of Sheffield, IA. 10 tornadoes were reported, including one near 1 mile south-southeast of Webster City, IA. The storm had 14 official hail reports.

Local hail summary for the Huntsville area: 1.78 square miles of estimated ground-hail footprint; highest mapped band 1+ inches. 0 official hail report(s) within the summary area. Exposure estimates are not confirmed property damage. Open the map to explore the full coverage included in your access. Statistics cover the mapped hail footprint inside the Census boundary of Huntsville, AL, not the entire region. The place had 215,006 residents in the 2020 Census. A boundary intersection does not mean the whole community was hit. Estimated housing exposure: 552 units in 1-inch-or-larger bands, including 0 in 1.5-inch-or-larger bands and 0 in 2-inch-or-larger bands.

Local hail summary for the Payson area: 3.29 square miles of estimated ground-hail footprint; highest mapped band 1+ inches. 0 official hail report(s) within the summary area. Exposure estimates are not confirmed property damage. Open the map to explore the full coverage included in your access. Statistics cover the mapped hail footprint inside the Census boundary of Payson, AZ, not the entire region. The place had 16,351 residents in the 2020 Census. A boundary intersection does not mean the whole community was hit. Estimated housing exposure: 454 units in 1-inch-or-larger bands, including 0 in 1.5-inch-or-larger bands and 0 in 2-inch-or-larger bands.
Yes. The storm library supports coverage-area filtering so you can find hail maps and hail swaths in a target service area.
The library focuses on published hail events, including ready storm maps and live storms once hail has been detected and a public swath is available.
Yes. They are built to help roofers, adjusters, restoration teams, and property owners review storm footprints before purchase.