
Storm library

Browse live and recent hail maps.

Review storm footprints, hail swaths, reports, and replay access. Create a free account to save your setup and move into map access when a storm matters.

Search filters
Clear
Newest storms first by default.
Don't see your storm? Request a qualifying storm map and we'll email you when it is ready.
Showing 2017-2040 of 2371 storms · Page 85 of 99
‹ 1 84 85 86 99 ›
Request a storm map

Tell us about the storm and we'll build the map. Once it's published you'll get an email and can purchase it from the library — just like any other event.

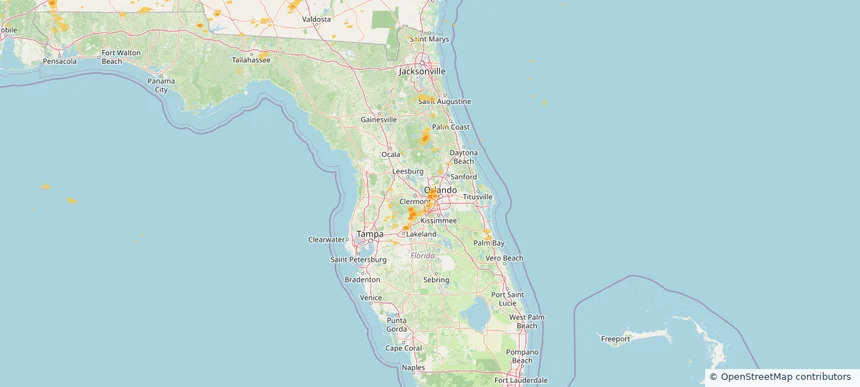
Ocoee, FL — June 10, 2025 — regional hail footprint preview
Storm footprint preview

Local hail summary for the Ocoee area: 6.12 square miles of estimated ground-hail footprint; highest mapped band 1+ inches. 0 official hail report(s) within the summary area. Exposure estimates are not confirmed property damage. Open the map to explore the full coverage included in your access. Statistics cover the mapped hail footprint inside the Census boundary of Ocoee, FL, not the entire region. The place had 47,295 residents in the 2020 Census. A boundary intersection does not mean the whole community was hit. Estimated housing exposure: 4,584 units in 1-inch-or-larger bands, including 0 in 1.5-inch-or-larger bands and 0 in 2-inch-or-larger bands.

Affected states: Ocoee area, FL
1+ inRadar size estimate 21,582Population Affected 7,971Houses Affected HailHazards FreeAccount signup
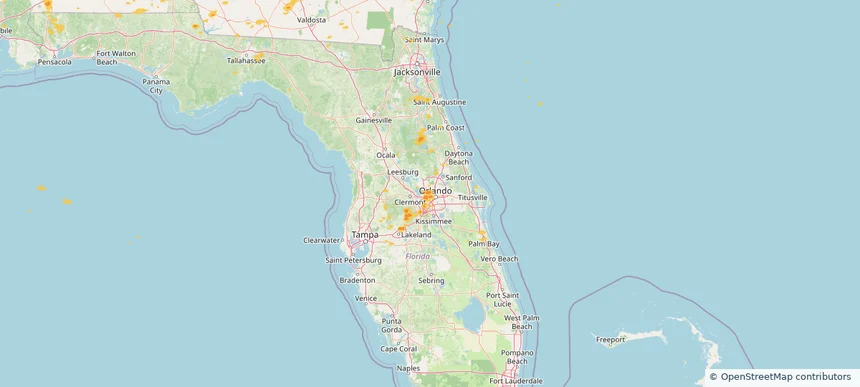
Pine Hills, FL — June 10, 2025 — regional hail footprint preview
Storm footprint preview

Local hail summary for the Pine Hills area: 3.29 square miles of estimated ground-hail footprint; highest mapped band 1+ inches. 0 official hail report(s) within the summary area. Exposure estimates are not confirmed property damage. Open the map to explore the full coverage included in your access. Statistics cover the mapped hail footprint inside the Census boundary of Pine Hills, FL, not the entire region. The place had 66,111 residents in the 2020 Census. A boundary intersection does not mean the whole community was hit. Estimated housing exposure: 1,881 units in 1-inch-or-larger bands, including 0 in 1.5-inch-or-larger bands and 0 in 2-inch-or-larger bands.

Affected states: Pine Hills area, FL
1+ inRadar size estimate 13,700Population Affected 4,439Houses Affected HailHazards FreeAccount signup
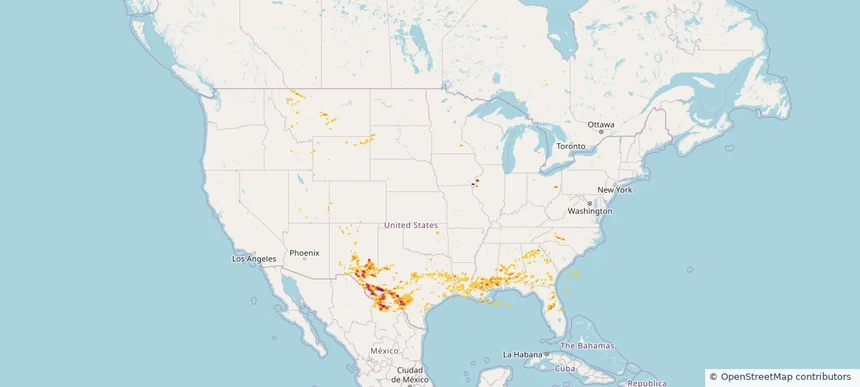
Historical Hail — 2025-06-10 — regional hail footprint preview
Storm footprint preview
Jun 10, 2025 7:00 AM to Jun 11, 2025 7:00 AM CST

Historical Hail — 2025-06-10

Hail as large as 1.25 inches was reported near Andrews Co Arpt, TEXAS. Wind up to 107 mph was reported near 6 miles west of Dryden, TX. 20 tornadoes were reported, including one near Vermilion, LOUISIANA. The storm had 4 official hail reports.

Affected states: National, AL, FL, GA, ID, IL, IA, LA, MN, MS, MT, NM, NC, OK, SC, SD, TX, UT, WY
5.91 inRadar size estimate 734,260Population Affected 300,184Houses Affected Hail · Wind · TornadoHazards FreeAccount signup
Odessa, TX — June 09, 2025 — regional hail footprint preview
Storm footprint preview

Local hail summary for the Odessa area: 26.11 square miles of estimated ground-hail footprint; highest mapped band 2+ inches. 1 official hail report(s) within the summary area. Exposure estimates are not confirmed property damage. Open the map to explore the full coverage included in your access. Statistics cover the mapped hail footprint inside the Census boundary of Odessa, TX, not the entire region. The place had 114,428 residents in the 2020 Census. A boundary intersection does not mean the whole community was hit. Estimated housing exposure: 23,621 units in 1-inch-or-larger bands, including 16,126 in 1.5-inch-or-larger bands and 3,933 in 2-inch-or-larger bands.

Affected states: Odessa area, TX
2+ inRadar size estimate 75,229Population Affected 29,589Houses Affected HailHazards FreeAccount signup
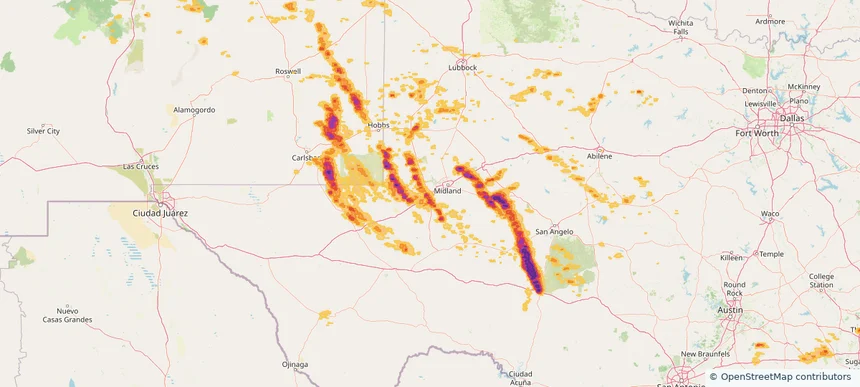
The Woodlands, TX — June 09, 2025 — regional hail footprint preview
Storm footprint preview

Local hail summary for the The Woodlands area: 20.95 square miles of estimated ground-hail footprint; highest mapped band 1+ inches. 2 official hail report(s) within the summary area. Exposure estimates are not confirmed property damage. Open the map to explore the full coverage included in your access. Statistics cover the mapped hail footprint inside the Census boundary of The Woodlands, TX, not the entire region. The place had 114,436 residents in the 2020 Census. A boundary intersection does not mean the whole community was hit. Estimated housing exposure: 18,190 units in 1-inch-or-larger bands, including 0 in 1.5-inch-or-larger bands and 0 in 2-inch-or-larger bands.

Affected states: The Woodlands area, TX
1+ inRadar size estimate 50,196Population Affected 20,748Houses Affected HailHazards FreeAccount signup
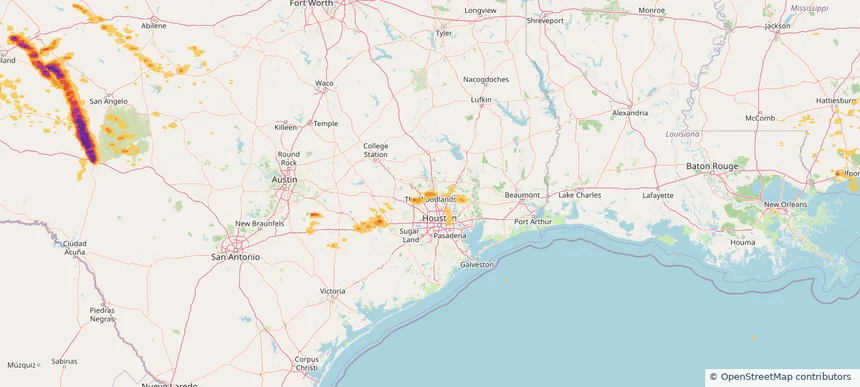
West Odessa, TX — June 09, 2025 — regional hail footprint preview
Storm footprint preview

Local hail summary for the West Odessa area: 31.51 square miles of estimated ground-hail footprint; highest mapped band 2+ inches. 0 official hail report(s) within the summary area. Exposure estimates are not confirmed property damage. Open the map to explore the full coverage included in your access. Statistics cover the mapped hail footprint inside the Census boundary of West Odessa, TX, not the entire region. The place had 33,340 residents in the 2020 Census. A boundary intersection does not mean the whole community was hit. Estimated housing exposure: 1,331 units in 1-inch-or-larger bands, including 248 in 1.5-inch-or-larger bands and 0 in 2-inch-or-larger bands.

Affected states: West Odessa area, TX
2+ inRadar size estimate 16,260Population Affected 5,889Houses Affected HailHazards FreeAccount signup
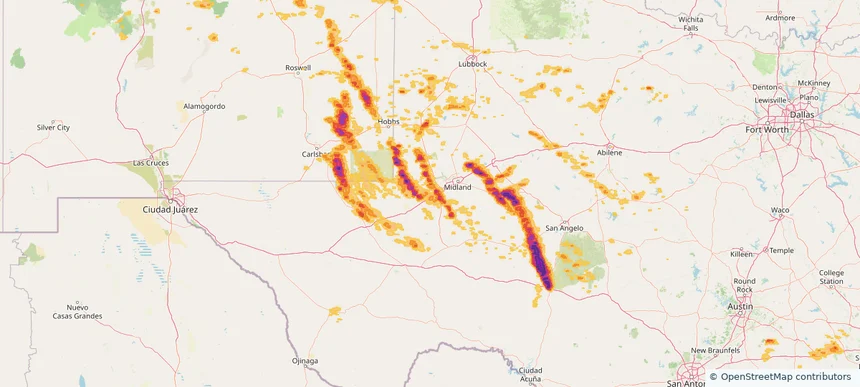
Historical Hail — 2025-06-09 — regional hail footprint preview
Storm footprint preview
Jun 9, 2025 7:00 AM to Jun 10, 2025 7:00 AM CST

Historical Hail — 2025-06-09

Hail as large as 3.25 inches was reported near Mertzon, TEXAS. Wind up to 96 mph was reported near Pa, PA. 33 tornadoes were reported, including one near Vermilion, LOUISIANA. The storm had 17 official hail reports.

Affected states: National, AL, AR, CO, FL, GA, KY, MI, MS, NM, NY, NC, OH, OK, PA, SC, TN, TX, VA, WV
4.16 inRadar size estimate 508,957Population Affected 200,245Houses Affected Hail · Wind · TornadoHazards FreeAccount signup
Abilene, TX — June 08, 2025 — regional hail footprint preview
Storm footprint preview

Local hail summary for the Abilene area: 72.55 square miles of estimated ground-hail footprint; highest mapped band 2+ inches. 0 official hail report(s) within the summary area. Exposure estimates are not confirmed property damage. Open the map to explore the full coverage included in your access. Statistics cover the mapped hail footprint inside the Census boundary of Abilene, TX, not the entire region. The place had 125,182 residents in the 2020 Census. A boundary intersection does not mean the whole community was hit. Estimated housing exposure: 34,439 units in 1-inch-or-larger bands, including 6,299 in 1.5-inch-or-larger bands and 193 in 2-inch-or-larger bands.

Affected states: Abilene area, TX
2+ inRadar size estimate 89,242Population Affected 38,119Houses Affected HailHazards FreeAccount signup
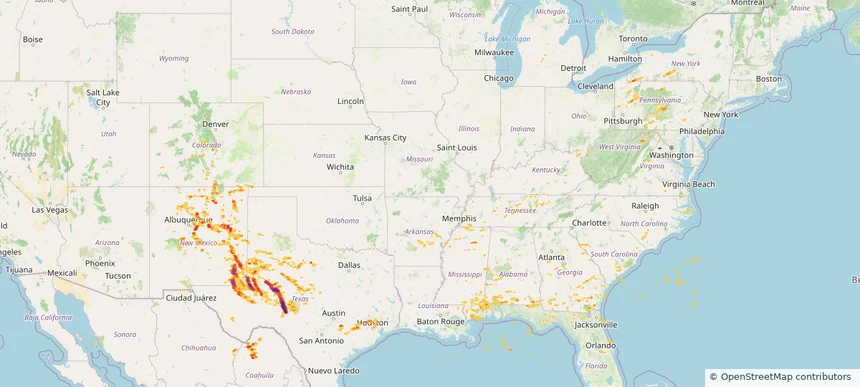
Batavia, IL — June 08, 2025 — regional hail footprint preview
Storm footprint preview

Local hail summary for the Batavia area: 7.81 square miles of estimated ground-hail footprint; highest mapped band 1.5+ inches. 3 official hail report(s) within the summary area. Exposure estimates are not confirmed property damage. Open the map to explore the full coverage included in your access. Statistics cover the mapped hail footprint inside the Census boundary of Batavia, IL, not the entire region. The place had 26,098 residents in the 2020 Census. A boundary intersection does not mean the whole community was hit. Estimated housing exposure: 4,913 units in 1-inch-or-larger bands, including 1,410 in 1.5-inch-or-larger bands and 0 in 2-inch-or-larger bands.

Affected states: Batavia area, IL
1.5+ inRadar size estimate 21,516Population Affected 8,433Houses Affected HailHazards FreeAccount signup
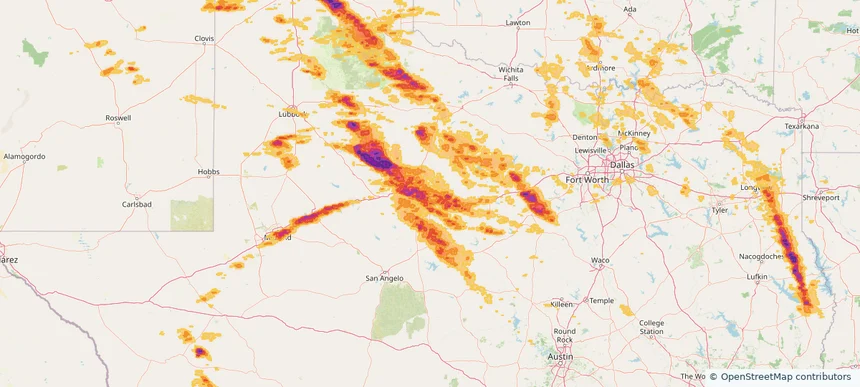
Big Spring, TX — June 08, 2025 — regional hail footprint preview
Storm footprint preview

Local hail summary for the Big Spring area: 16.87 square miles of estimated ground-hail footprint; highest mapped band 2+ inches. 0 official hail report(s) within the summary area. Exposure estimates are not confirmed property damage. Open the map to explore the full coverage included in your access. Statistics cover the mapped hail footprint inside the Census boundary of Big Spring, TX, not the entire region. The place had 26,144 residents in the 2020 Census. A boundary intersection does not mean the whole community was hit. Estimated housing exposure: 9,519 units in 1-inch-or-larger bands, including 7,286 in 1.5-inch-or-larger bands and 1,690 in 2-inch-or-larger bands.

Affected states: Big Spring area, TX
2+ inRadar size estimate 25,393Population Affected 9,519Houses Affected HailHazards FreeAccount signup
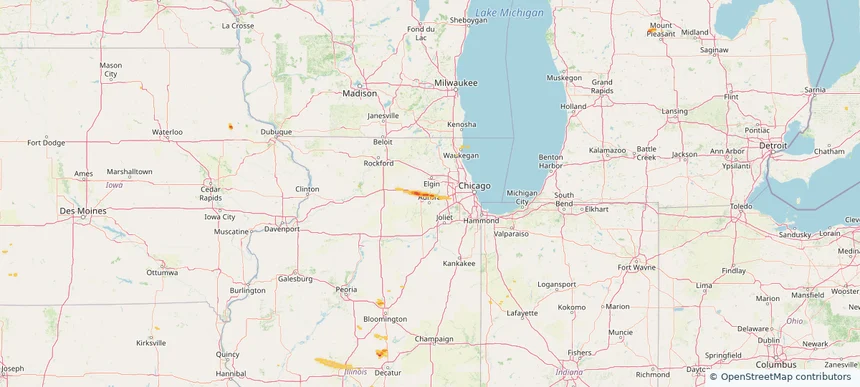
Borger, TX — June 08, 2025 — regional hail footprint preview
Storm footprint preview

Local hail summary for the Borger area: 4.67 square miles of estimated ground-hail footprint; highest mapped band 1.5+ inches. 1 official hail report(s) within the summary area. Exposure estimates are not confirmed property damage. Open the map to explore the full coverage included in your access. Statistics cover the mapped hail footprint inside the Census boundary of Borger, TX, not the entire region. The place had 12,551 residents in the 2020 Census. A boundary intersection does not mean the whole community was hit. Estimated housing exposure: 1,428 units in 1-inch-or-larger bands, including 528 in 1.5-inch-or-larger bands and 0 in 2-inch-or-larger bands.

Affected states: Borger area, TX
1.5+ inRadar size estimate 7,370Population Affected 3,889Houses Affected HailHazards FreeAccount signup
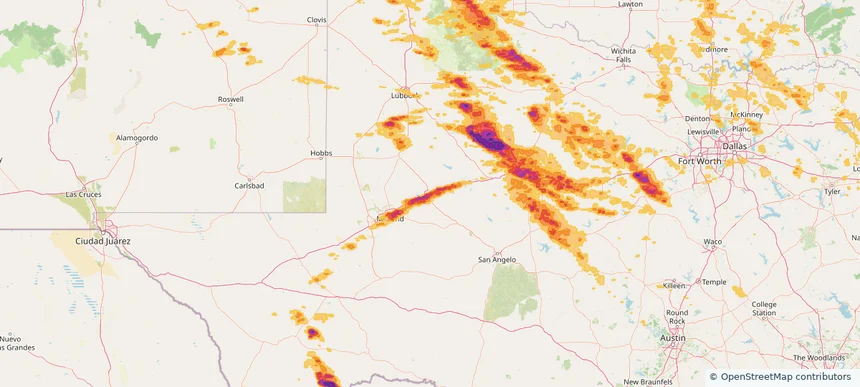
Denton, TX — June 08, 2025 — regional hail footprint preview
Storm footprint preview

Local hail summary for the Denton area: 0.83 square miles of estimated ground-hail footprint; highest mapped band 1+ inches. 0 official hail report(s) within the summary area. Exposure estimates are not confirmed property damage. Open the map to explore the full coverage included in your access. Statistics cover the mapped hail footprint inside the Census boundary of Denton, TX, not the entire region. The place had 139,869 residents in the 2020 Census. A boundary intersection does not mean the whole community was hit. Estimated housing exposure: 121 units in 1-inch-or-larger bands, including 0 in 1.5-inch-or-larger bands and 0 in 2-inch-or-larger bands.

Affected states: Denton area, TX
1+ inRadar size estimate 702Population Affected 207Houses Affected HailHazards FreeAccount signup
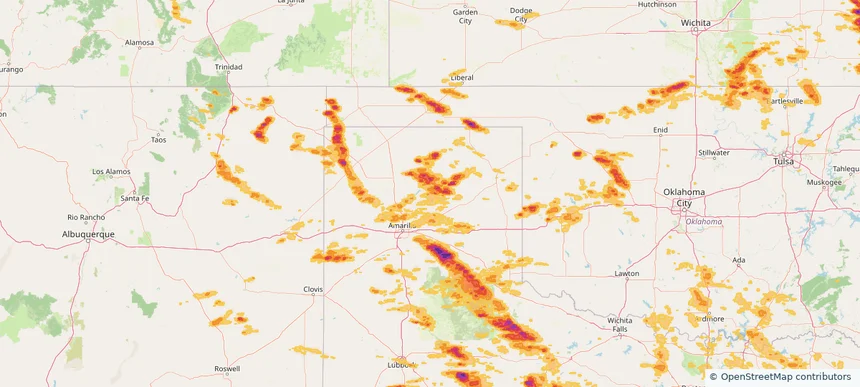
Storm footprint preview

Local hail summary for the Joplin area: 20.73 square miles of estimated ground-hail footprint; highest mapped band 1.5+ inches. 0 official hail report(s) within the summary area. Exposure estimates are not confirmed property damage. Open the map to explore the full coverage included in your access. Statistics cover the mapped hail footprint inside the Census boundary of Joplin, MO, not the entire region. The place had 51,762 residents in the 2020 Census. A boundary intersection does not mean the whole community was hit. Estimated housing exposure: 16,181 units in 1-inch-or-larger bands, including 701 in 1.5-inch-or-larger bands and 0 in 2-inch-or-larger bands.

Affected states: Joplin area, MO
1.5+ inRadar size estimate 39,810Population Affected 19,037Houses Affected HailHazards FreeAccount signup
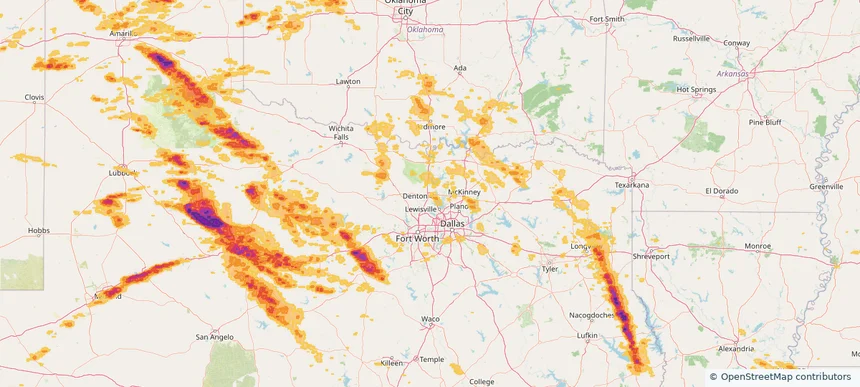
Midland, TX — June 08, 2025 — regional hail footprint preview
Storm footprint preview

Local hail summary for the Midland area: 9.46 square miles of estimated ground-hail footprint; highest mapped band 2+ inches. 1 official hail report(s) within the summary area. Exposure estimates are not confirmed property damage. Open the map to explore the full coverage included in your access. Statistics cover the mapped hail footprint inside the Census boundary of Midland, TX, not the entire region. The place had 132,524 residents in the 2020 Census. A boundary intersection does not mean the whole community was hit. Estimated housing exposure: 6,871 units in 1-inch-or-larger bands, including 4,113 in 1.5-inch-or-larger bands and 0 in 2-inch-or-larger bands.

Affected states: Midland area, TX
2+ inRadar size estimate 18,081Population Affected 6,871Houses Affected HailHazards FreeAccount signup
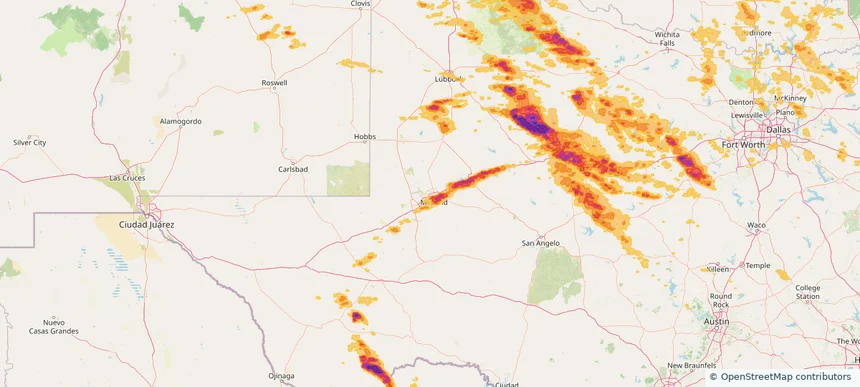
Historical Hail — 2025-06-08 — regional hail footprint preview
Storm footprint preview
Jun 8, 2025 7:00 AM to Jun 9, 2025 7:00 AM CST

Historical Hail — 2025-06-08

Hail as large as 2.30 inches was reported near Batavia, ILLINOIS. Wind up to 115 mph was reported near 4 miles north-northwest of Goree, TX. 43 tornadoes were reported, including one near Vermilion, LOUISIANA. The storm had 43 official hail reports.

Affected states: National, AL, AR, CO, FL, GA, IL, IN, IA, KS, LA, MI, MS, MO, NM, NC, OK, SC, TX, VA, WI
4.12 inRadar size estimate 1,221,571Population Affected 525,492Houses Affected Hail · Wind · TornadoHazards FreeAccount signup
Canyon, TX — June 07, 2025 — regional hail footprint preview
Storm footprint preview

Local hail summary for the Canyon area: 7.88 square miles of estimated ground-hail footprint; highest mapped band 2+ inches. 0 official hail report(s) within the summary area. Exposure estimates are not confirmed property damage. Open the map to explore the full coverage included in your access. Statistics cover the mapped hail footprint inside the Census boundary of Canyon, TX, not the entire region. The place had 14,836 residents in the 2020 Census. A boundary intersection does not mean the whole community was hit. Estimated housing exposure: 6,417 units in 1-inch-or-larger bands, including 6,417 in 1.5-inch-or-larger bands and 5,607 in 2-inch-or-larger bands.

Affected states: Canyon area, TX
2+ inRadar size estimate 14,730Population Affected 6,417Houses Affected HailHazards FreeAccount signup
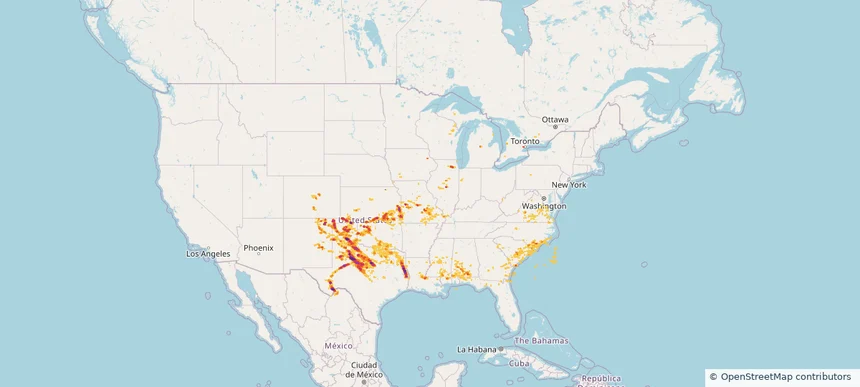
Historical Hail — 2025-06-07 — regional hail footprint preview
Storm footprint preview
Jun 7, 2025 7:00 AM to Jun 8, 2025 7:00 AM CST

Historical Hail — 2025-06-07

Hail as large as 1.75 inches was reported near Vega, TEXAS. Wind up to 102 mph was reported near 1 mile southwest of Hollis Lathem Rese, GA. 48 tornadoes were reported, including one near St. Francois, MISSOURI. The storm had 5 official hail reports.

Affected states: National, AL, AR, GA, IL, IN, KS, KY, LA, MS, MO, NM, NC, OK, SC, TN, TX, VA
3.23 inRadar size estimate 393,455Population Affected 174,749Houses Affected Hail · Wind · TornadoHazards FreeAccount signup
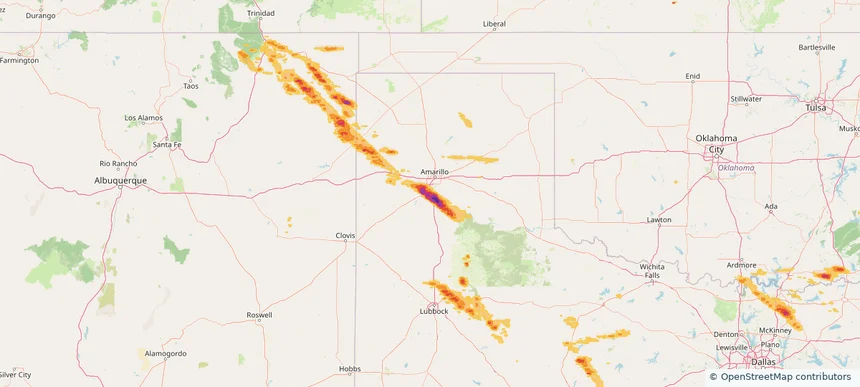
Amarillo, TX — June 06, 2025 — regional hail footprint preview
Storm footprint preview

Local hail summary for the Amarillo area: 15.06 square miles of estimated ground-hail footprint; highest mapped band 1+ inches. 0 official hail report(s) within the summary area. Exposure estimates are not confirmed property damage. Open the map to explore the full coverage included in your access. Statistics cover the mapped hail footprint inside the Census boundary of Amarillo, TX, not the entire region. The place had 200,393 residents in the 2020 Census. A boundary intersection does not mean the whole community was hit. Estimated housing exposure: 12,119 units in 1-inch-or-larger bands, including 0 in 1.5-inch-or-larger bands and 0 in 2-inch-or-larger bands.

Affected states: Amarillo area, TX
1+ inRadar size estimate 47,340Population Affected 22,518Houses Affected HailHazards FreeAccount signup
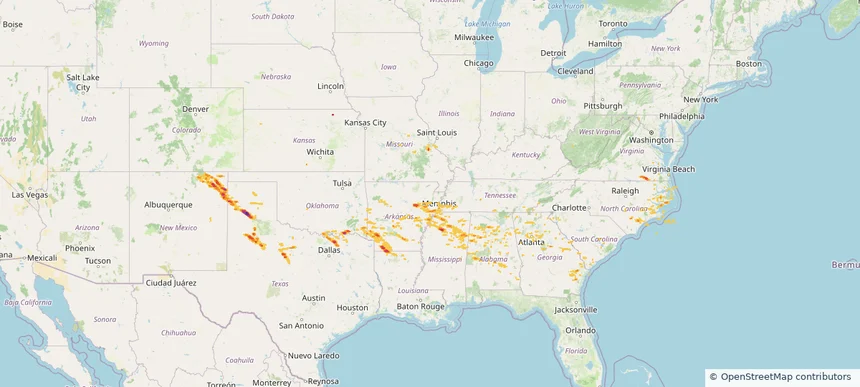
Fruita, CO — June 06, 2025 — regional hail footprint preview
Storm footprint preview

Local hail summary for the Fruita area: 7.85 square miles of estimated ground-hail footprint; highest mapped band 1.5+ inches. 1 official hail report(s) within the summary area. Exposure estimates are not confirmed property damage. Open the map to explore the full coverage included in your access. Statistics cover the mapped hail footprint inside the Census boundary of Fruita, CO, not the entire region. The place had 13,395 residents in the 2020 Census. A boundary intersection does not mean the whole community was hit. Estimated housing exposure: 4,575 units in 1-inch-or-larger bands, including 0 in 1.5-inch-or-larger bands and 0 in 2-inch-or-larger bands.

Affected states: Fruita area, CO
1.5+ inRadar size estimate 12,524Population Affected 5,128Houses Affected HailHazards FreeAccount signup
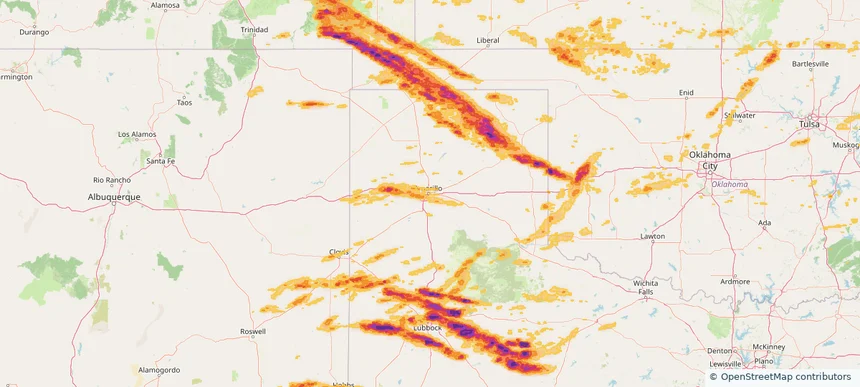
Grand Junction, CO — June 06, 2025 — regional hail footprint preview
Storm footprint preview

Local hail summary for the Grand Junction area: 29.64 square miles of estimated ground-hail footprint; highest mapped band 1.5+ inches. 0 official hail report(s) within the summary area. Exposure estimates are not confirmed property damage. Open the map to explore the full coverage included in your access. Statistics cover the mapped hail footprint inside the Census boundary of Grand Junction, CO, not the entire region. The place had 65,560 residents in the 2020 Census. A boundary intersection does not mean the whole community was hit. Estimated housing exposure: 20,123 units in 1-inch-or-larger bands, including 3,852 in 1.5-inch-or-larger bands and 0 in 2-inch-or-larger bands.

Affected states: Grand Junction area, CO
1.5+ inRadar size estimate 55,922Population Affected 25,526Houses Affected HailHazards FreeAccount signup
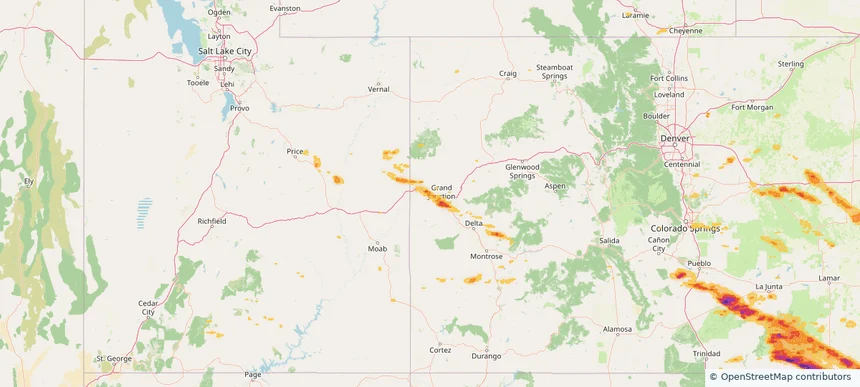
Storm footprint preview

Local hail summary for the Hobbs area: 21.52 square miles of estimated ground-hail footprint; highest mapped band 2+ inches. 1 official hail report(s) within the summary area. Exposure estimates are not confirmed property damage. Open the map to explore the full coverage included in your access. Statistics cover the mapped hail footprint inside the Census boundary of Hobbs, NM, not the entire region. The place had 40,508 residents in the 2020 Census. A boundary intersection does not mean the whole community was hit. Estimated housing exposure: 14,415 units in 1-inch-or-larger bands, including 11,296 in 1.5-inch-or-larger bands and 924 in 2-inch-or-larger bands.

Affected states: Hobbs area, NM
2+ inRadar size estimate 38,549Population Affected 14,850Houses Affected HailHazards FreeAccount signup
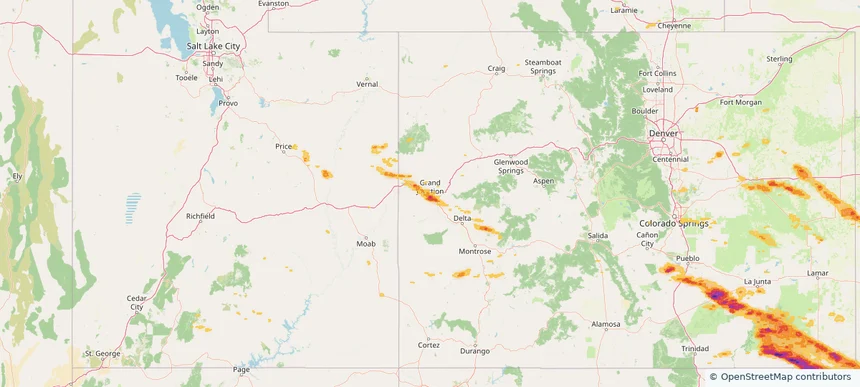
Levelland, TX — June 06, 2025 — regional hail footprint preview
Storm footprint preview

Local hail summary for the Levelland area: 4.99 square miles of estimated ground-hail footprint; highest mapped band 1.5+ inches. 0 official hail report(s) within the summary area. Exposure estimates are not confirmed property damage. Open the map to explore the full coverage included in your access. Statistics cover the mapped hail footprint inside the Census boundary of Levelland, TX, not the entire region. The place had 12,652 residents in the 2020 Census. A boundary intersection does not mean the whole community was hit. Estimated housing exposure: 827 units in 1-inch-or-larger bands, including 3 in 1.5-inch-or-larger bands and 0 in 2-inch-or-larger bands.

Affected states: Levelland area, TX
1.5+ inRadar size estimate 6,091Population Affected 2,550Houses Affected HailHazards FreeAccount signup
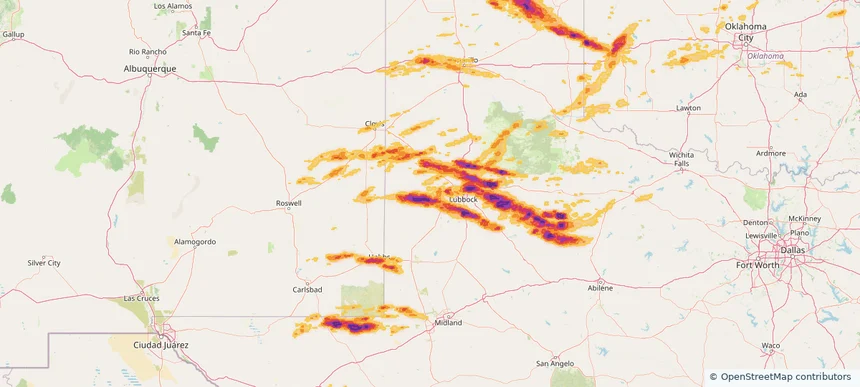
Lubbock, TX — June 06, 2025 — regional hail footprint preview
Storm footprint preview

Local hail summary for the Lubbock area: 45.61 square miles of estimated ground-hail footprint; highest mapped band 2.5+ inches. 1 official hail report(s) within the summary area. Exposure estimates are not confirmed property damage. Open the map to explore the full coverage included in your access. Statistics cover the mapped hail footprint inside the Census boundary of Lubbock, TX, not the entire region. The place had 257,141 residents in the 2020 Census. A boundary intersection does not mean the whole community was hit. Estimated housing exposure: 10,208 units in 1-inch-or-larger bands, including 3,257 in 1.5-inch-or-larger bands and 286 in 2-inch-or-larger bands.

Affected states: Lubbock area, TX
2.5+ inRadar size estimate 44,753Population Affected 19,236Houses Affected HailHazards FreeAccount signup
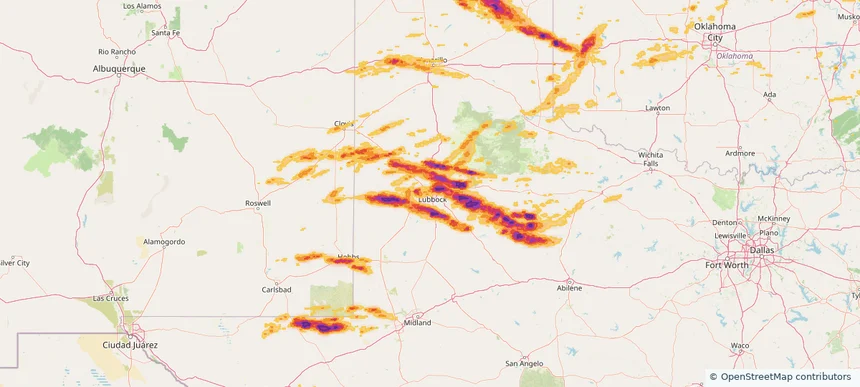
Northampton, MA — June 06, 2025 — regional hail footprint preview
Storm footprint preview

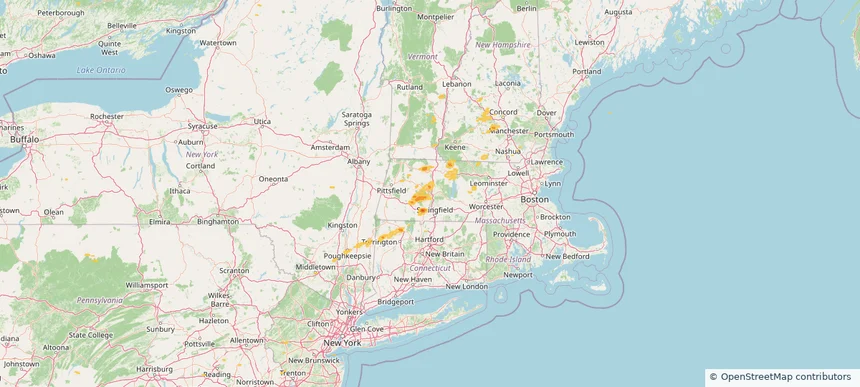
Local hail summary for the Northampton area: 4.61 square miles of estimated ground-hail footprint; highest mapped band 1+ inches. 1 official hail report(s) within the summary area. Exposure estimates are not confirmed property damage. Open the map to explore the full coverage included in your access. Statistics cover the mapped hail footprint inside the Census boundary of Northampton, MA, not the entire region. The place had 29,571 residents in the 2020 Census. A boundary intersection does not mean the whole community was hit. Estimated housing exposure: 124 units in 1-inch-or-larger bands, including 0 in 1.5-inch-or-larger bands and 0 in 2-inch-or-larger bands.

Affected states: Northampton area, MA
1+ inRadar size estimate 1,266Population Affected 502Houses Affected HailHazards FreeAccount signup
Page 85 of 99
‹ 1 84 85 86 99 ›

Frequently asked questions

Can I search hail maps by coverage area?

Yes. The storm library supports coverage-area filtering so you can find hail maps and hail swaths in a target service area.

What kinds of storms appear in the HailMapr library?

The library focuses on published hail events, including ready storm maps and live storms once hail has been detected and a public swath is available.

Are HailMapr storm pages useful for roofers and adjusters?

Yes. They are built to help roofers, adjusters, restoration teams, and property owners review storm footprints before purchase.