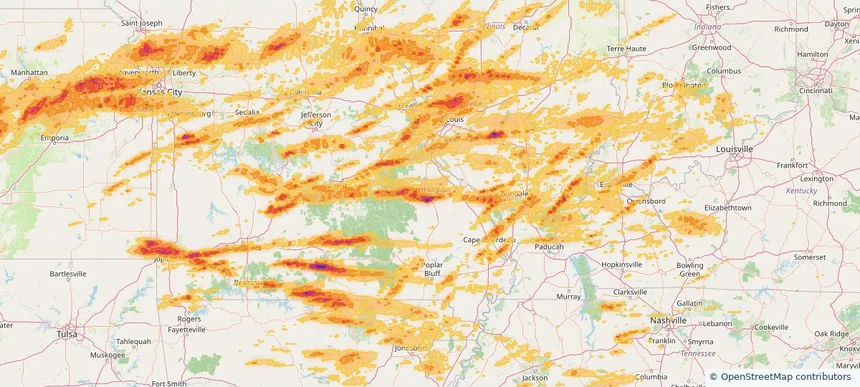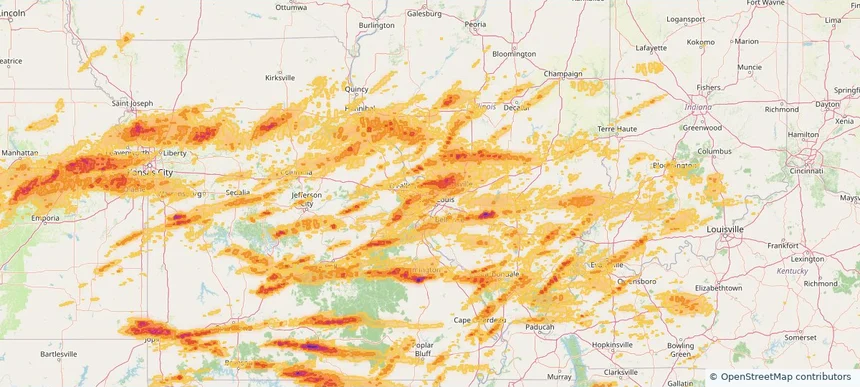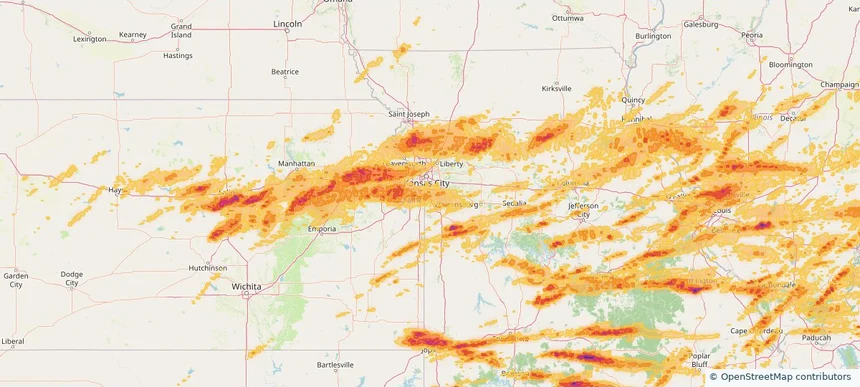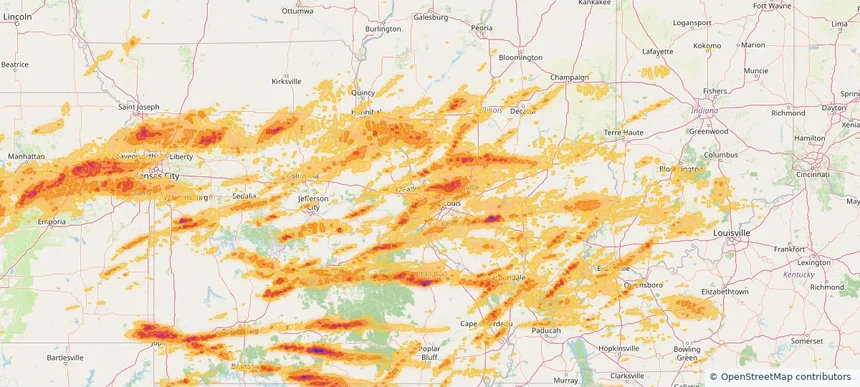
Historical Hail — 2026-05-04
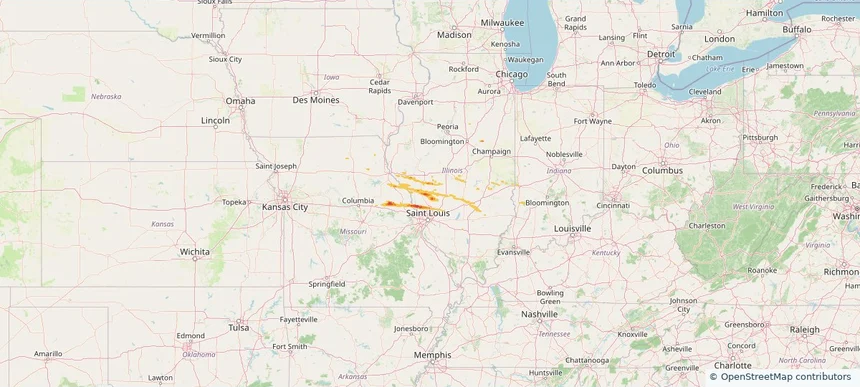
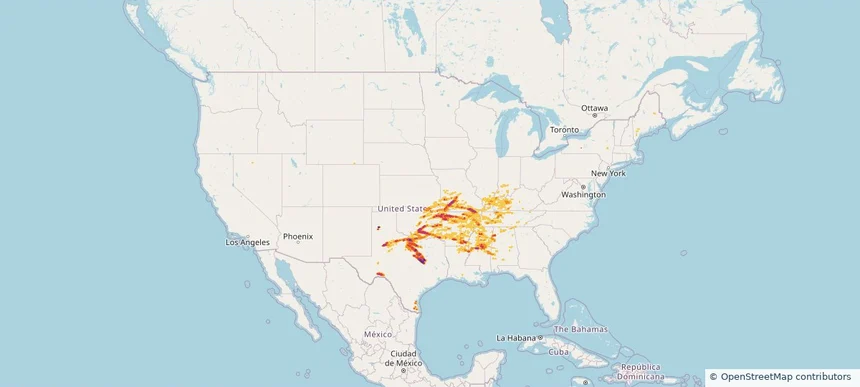
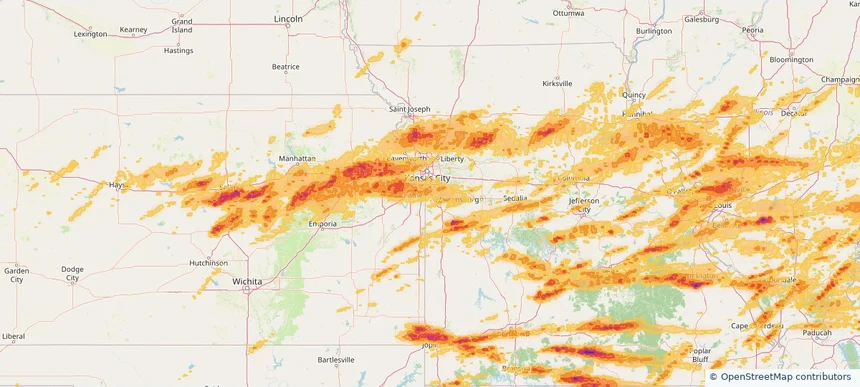
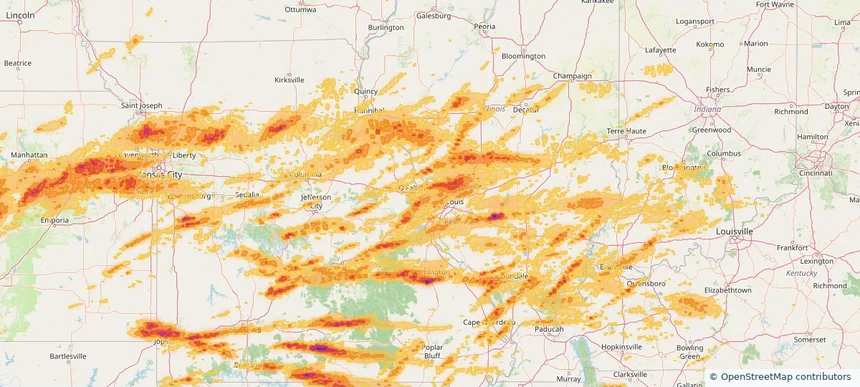
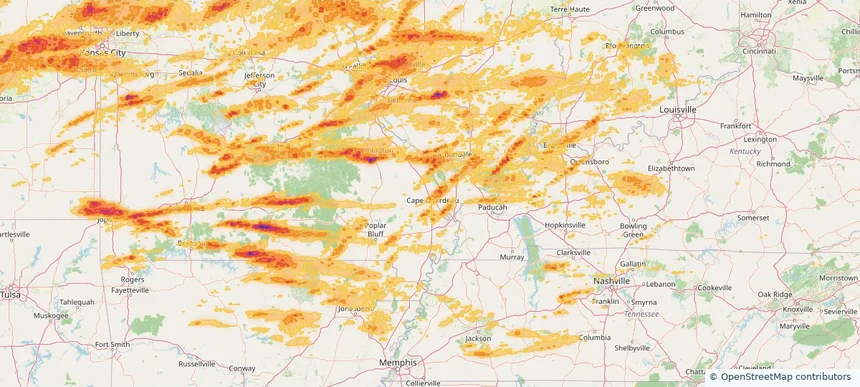
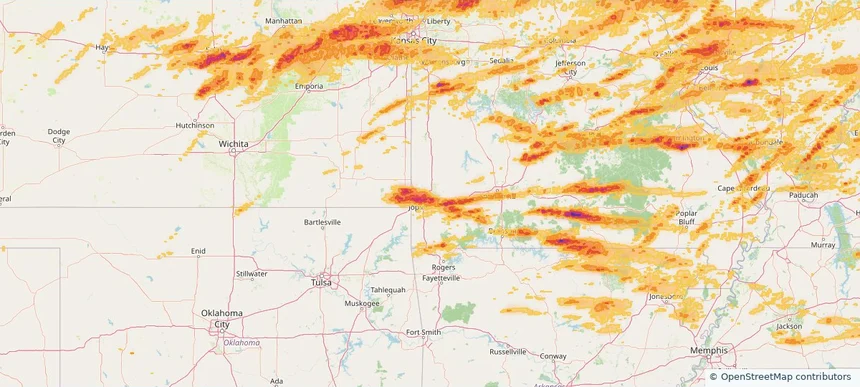
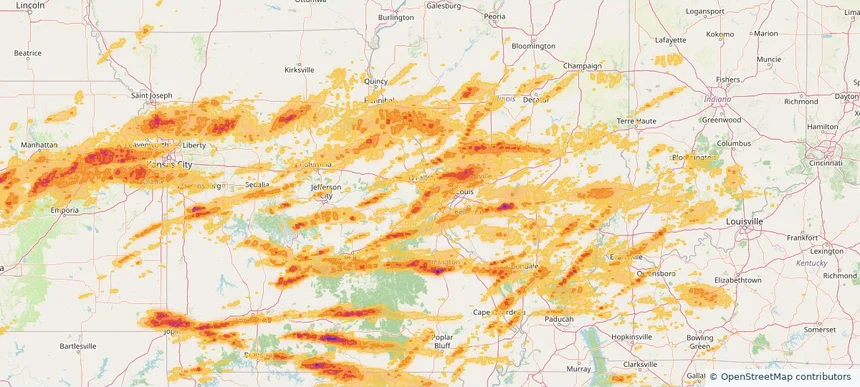
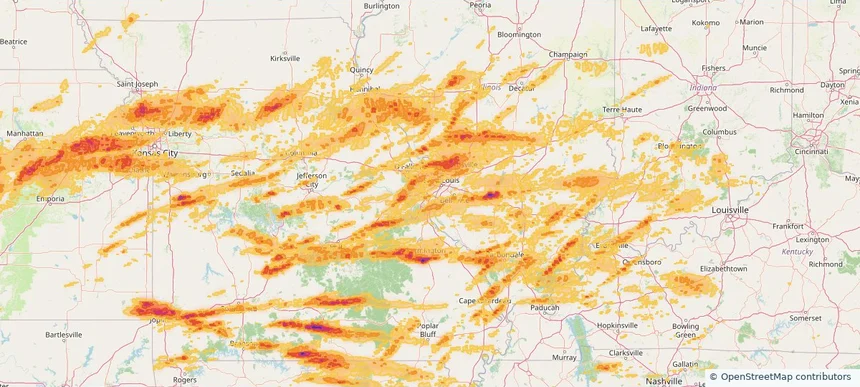
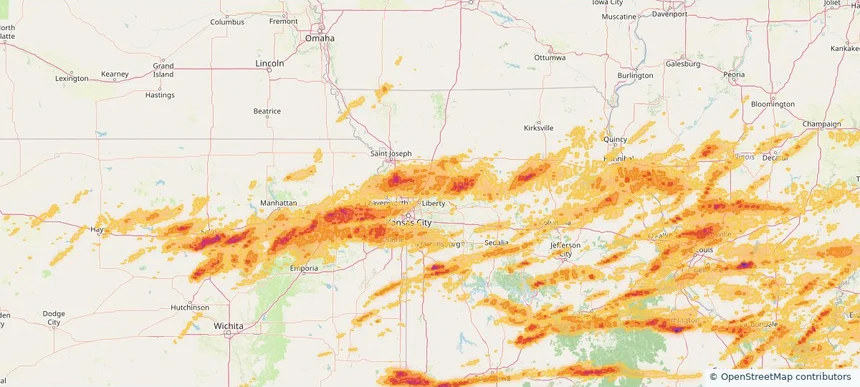
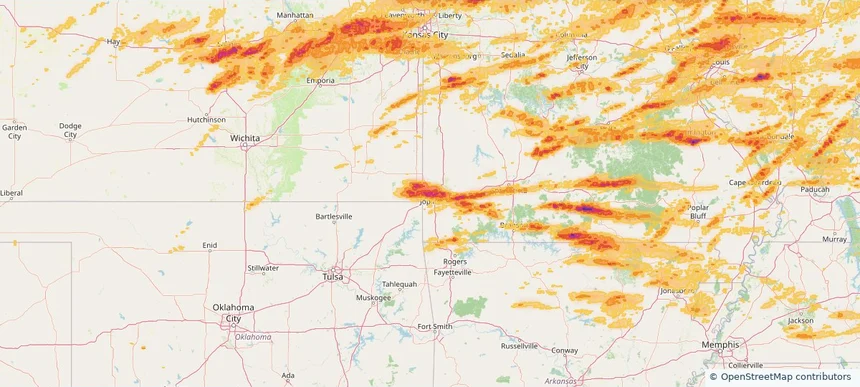
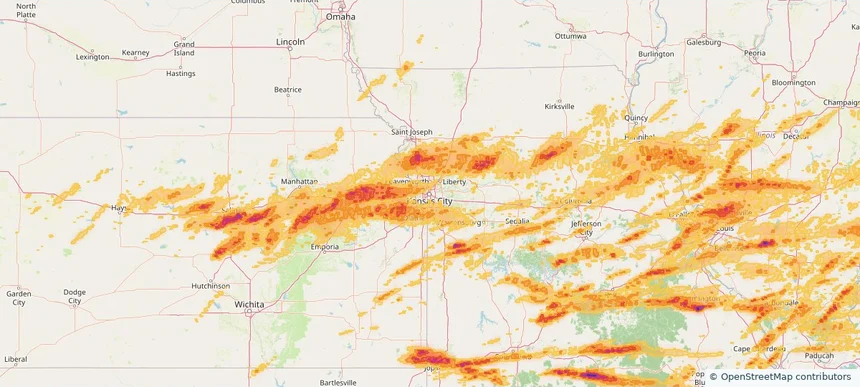
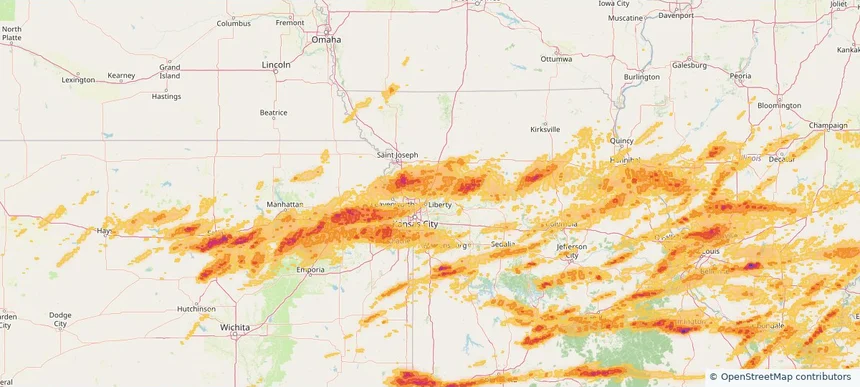
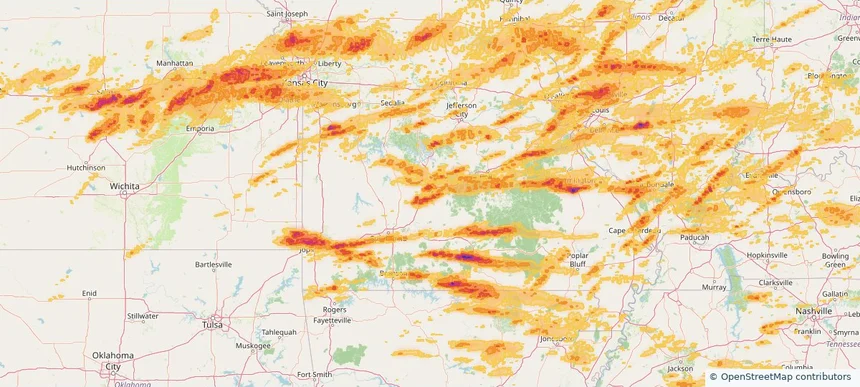
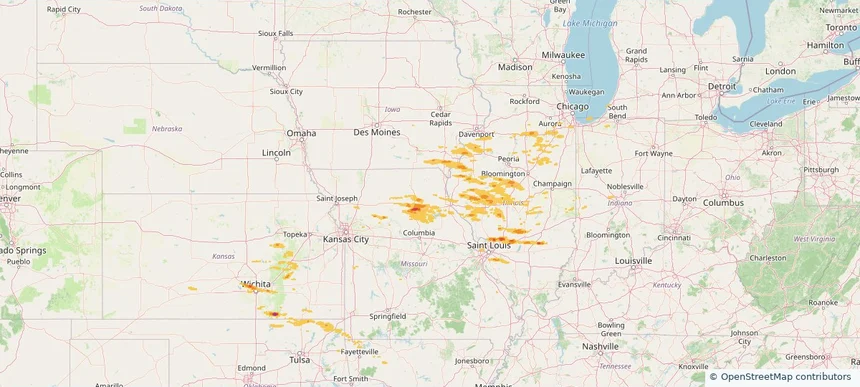
Hail as large as 1.75 inches was reported near Greenville, ILLINOIS. Wind up to 81 mph was reported near 2 miles west of Cambridge, IL. The storm had 13 official hail reports.
Review storm footprints, hail swaths, reports, and replay access. Create a free account to save your setup and move into map access when a storm matters.

Hail as large as 1.75 inches was reported near Greenville, ILLINOIS. Wind up to 81 mph was reported near 2 miles west of Cambridge, IL. The storm had 13 official hail reports.

Hail as large as 1.75 inches was reported near Troy, MISSOURI. The storm had 7 official hail reports.

Local hail summary for the Nixa area: 6.51 square miles of estimated ground-hail footprint; highest mapped band 1+ inches. 1 official hail report(s) within the summary area. Exposure estimates are not confirmed property damage. Open the map to explore the full coverage included in your access. Statistics cover the mapped hail footprint inside the Census boundary of Nixa, MO, not the entire region. The place had 23,257 residents in the 2020 Census. A boundary intersection does not mean the whole community was hit. Estimated housing exposure: 548 units in 1-inch-or-larger bands, including 0 in 1.5-inch-or-larger bands and 0 in 2-inch-or-larger bands.

Local hail summary for the Republic area: 15.58 square miles of estimated ground-hail footprint; highest mapped band 2+ inches. 1 official hail report(s) within the summary area. Exposure estimates are not confirmed property damage. Open the map to explore the full coverage included in your access. Statistics cover the mapped hail footprint inside the Census boundary of Republic, MO, not the entire region. The place had 18,750 residents in the 2020 Census. A boundary intersection does not mean the whole community was hit. Estimated housing exposure: 7,372 units in 1-inch-or-larger bands, including 5,638 in 1.5-inch-or-larger bands and 1,732 in 2-inch-or-larger bands.

Local hail summary for the Springfield area: 63.39 square miles of estimated ground-hail footprint; highest mapped band 2+ inches. 4 official hail report(s) within the summary area. Exposure estimates are not confirmed property damage. Open the map to explore the full coverage included in your access. Statistics cover the mapped hail footprint inside the Census boundary of Springfield, MO, not the entire region. The place had 169,176 residents in the 2020 Census. A boundary intersection does not mean the whole community was hit. Estimated housing exposure: 36,294 units in 1-inch-or-larger bands, including 11,051 in 1.5-inch-or-larger bands and 70 in 2-inch-or-larger bands.

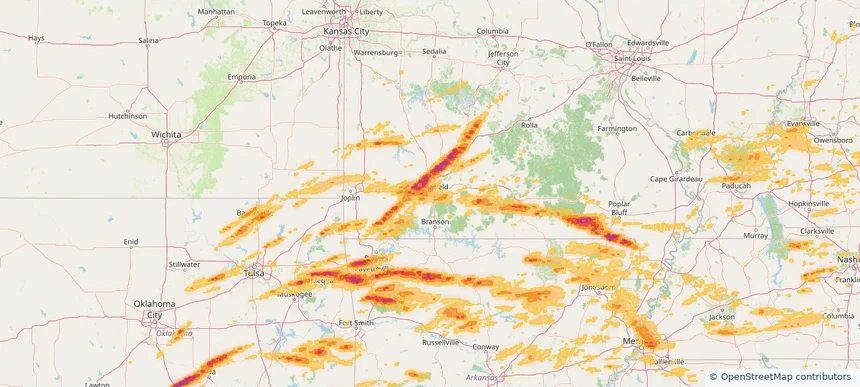
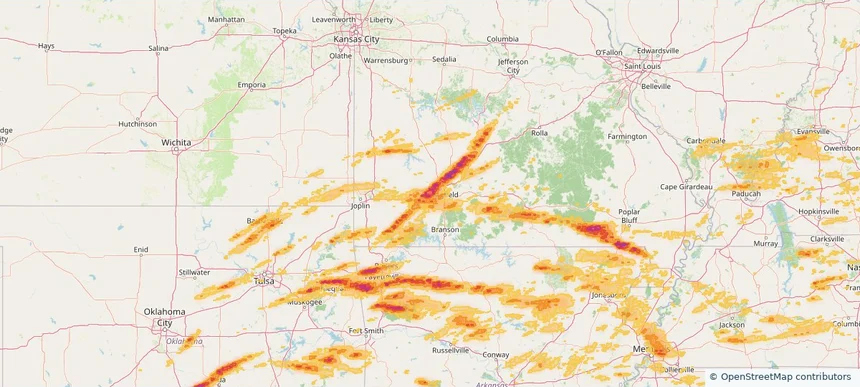
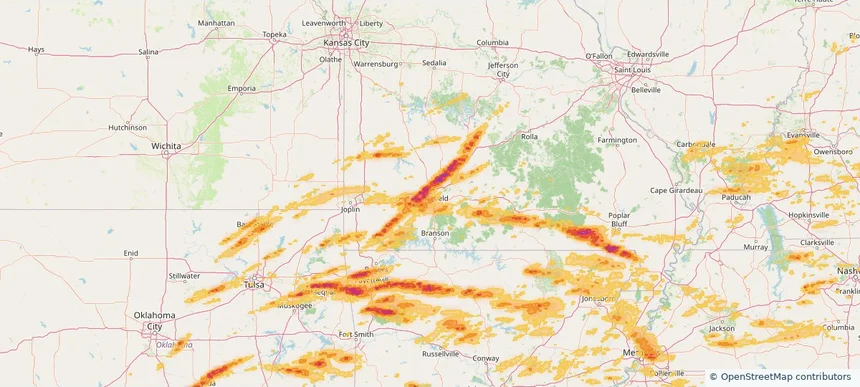
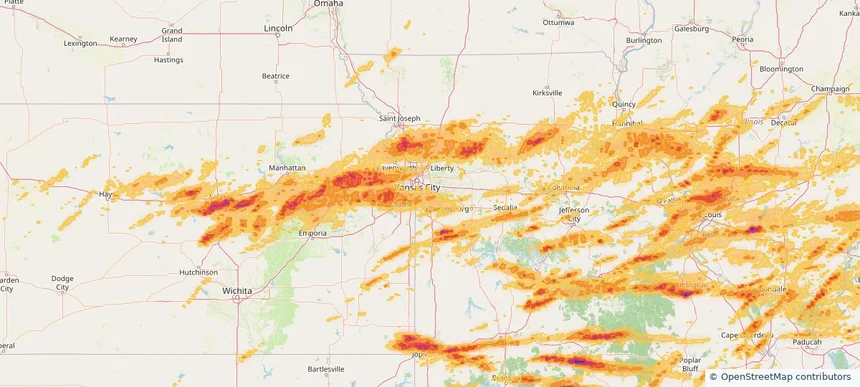
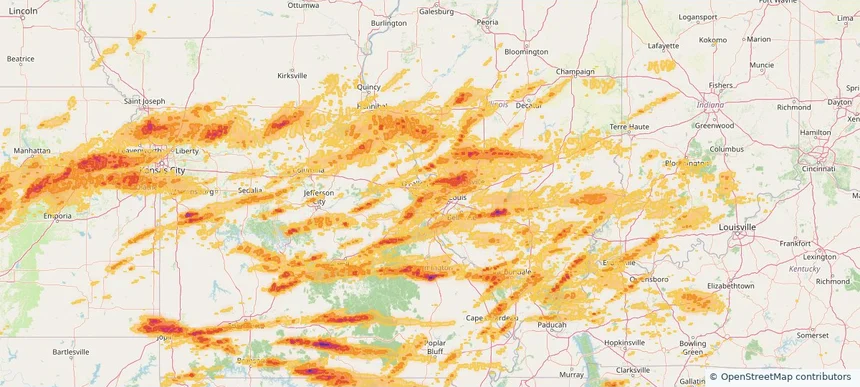
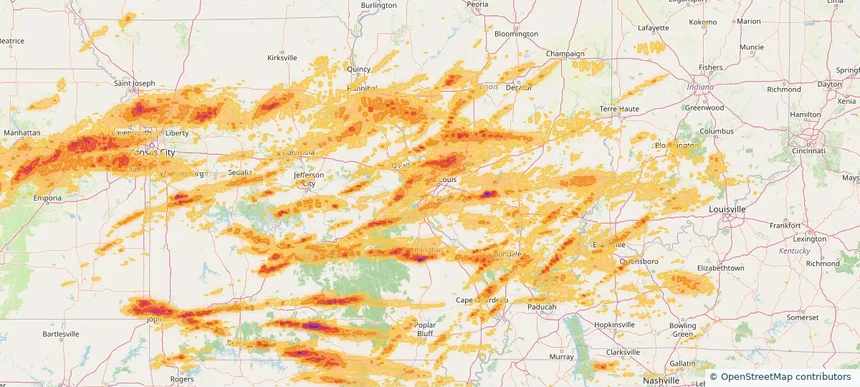
Hail as large as 4.75 inches was reported near 5 miles southeast of Bois D'Arc, MO. Wind up to 89 mph was reported near 2 miles northwest of Lake Village, AR. 27 tornadoes were reported, including one near 2 miles south of Mooresville, IN. The storm had 99 official hail reports.

Local hail summary for the Belton area: 9.29 square miles of estimated ground-hail footprint; highest mapped band 1+ inches. 0 official hail report(s) within the summary area. Exposure estimates are not confirmed property damage. Open the map to explore the full coverage included in your access. Statistics cover the mapped hail footprint inside the Census boundary of Belton, MO, not the entire region. The place had 23,953 residents in the 2020 Census. A boundary intersection does not mean the whole community was hit. Estimated housing exposure: 1,050 units in 1-inch-or-larger bands, including 0 in 1.5-inch-or-larger bands and 0 in 2-inch-or-larger bands.

Local hail summary for the Bridgeton area: 9.72 square miles of estimated ground-hail footprint; highest mapped band 1+ inches. 0 official hail report(s) within the summary area. Exposure estimates are not confirmed property damage. Open the map to explore the full coverage included in your access. Statistics cover the mapped hail footprint inside the Census boundary of Bridgeton, MO, not the entire region. The place had 11,445 residents in the 2020 Census. A boundary intersection does not mean the whole community was hit. Estimated housing exposure: 4,754 units in 1-inch-or-larger bands, including 0 in 1.5-inch-or-larger bands and 0 in 2-inch-or-larger bands.

Local hail summary for the Cape Girardeau area: 2.75 square miles of estimated ground-hail footprint; highest mapped band 1+ inches. 1 official hail report(s) within the summary area. Exposure estimates are not confirmed property damage. Open the map to explore the full coverage included in your access. Statistics cover the mapped hail footprint inside the Census boundary of Cape Girardeau, MO, not the entire region. The place had 39,540 residents in the 2020 Census. A boundary intersection does not mean the whole community was hit. Estimated housing exposure: 528 units in 1-inch-or-larger bands, including 0 in 1.5-inch-or-larger bands and 0 in 2-inch-or-larger bands.

Local hail summary for the Carthage area: 5.60 square miles of estimated ground-hail footprint; highest mapped band 1.5+ inches. 0 official hail report(s) within the summary area. Exposure estimates are not confirmed property damage. Open the map to explore the full coverage included in your access. Statistics cover the mapped hail footprint inside the Census boundary of Carthage, MO, not the entire region. The place had 15,522 residents in the 2020 Census. A boundary intersection does not mean the whole community was hit. Estimated housing exposure: 802 units in 1-inch-or-larger bands, including 45 in 1.5-inch-or-larger bands and 0 in 2-inch-or-larger bands.

Local hail summary for the Chesterfield area: 23.59 square miles of estimated ground-hail footprint; highest mapped band 1.5+ inches. 0 official hail report(s) within the summary area. Exposure estimates are not confirmed property damage. Open the map to explore the full coverage included in your access. Statistics cover the mapped hail footprint inside the Census boundary of Chesterfield, MO, not the entire region. The place had 49,999 residents in the 2020 Census. A boundary intersection does not mean the whole community was hit. Estimated housing exposure: 7,402 units in 1-inch-or-larger bands, including 453 in 1.5-inch-or-larger bands and 0 in 2-inch-or-larger bands.

Local hail summary for the Concord area: 3.68 square miles of estimated ground-hail footprint; highest mapped band 1+ inches. 0 official hail report(s) within the summary area. Exposure estimates are not confirmed property damage. Open the map to explore the full coverage included in your access. Statistics cover the mapped hail footprint inside the Census boundary of Concord, MO, not the entire region. The place had 17,668 residents in the 2020 Census. A boundary intersection does not mean the whole community was hit. Estimated housing exposure: 4,398 units in 1-inch-or-larger bands, including 0 in 1.5-inch-or-larger bands and 0 in 2-inch-or-larger bands.

Local hail summary for the Excelsior Springs area: 4.49 square miles of estimated ground-hail footprint; highest mapped band 1+ inches. 0 official hail report(s) within the summary area. Exposure estimates are not confirmed property damage. Open the map to explore the full coverage included in your access. Statistics cover the mapped hail footprint inside the Census boundary of Excelsior Springs, MO, not the entire region. The place had 10,553 residents in the 2020 Census. A boundary intersection does not mean the whole community was hit. Estimated housing exposure: 200 units in 1-inch-or-larger bands, including 0 in 1.5-inch-or-larger bands and 0 in 2-inch-or-larger bands.

Local hail summary for the Farmington area: 9.55 square miles of estimated ground-hail footprint; highest mapped band 2+ inches. 1 official hail report(s) within the summary area. Exposure estimates are not confirmed property damage. Open the map to explore the full coverage included in your access. Statistics cover the mapped hail footprint inside the Census boundary of Farmington, MO, not the entire region. The place had 18,217 residents in the 2020 Census. A boundary intersection does not mean the whole community was hit. Estimated housing exposure: 2,071 units in 1-inch-or-larger bands, including 746 in 1.5-inch-or-larger bands and 1 in 2-inch-or-larger bands.

Local hail summary for the Ferguson area: 4.28 square miles of estimated ground-hail footprint; highest mapped band 1+ inches. 0 official hail report(s) within the summary area. Exposure estimates are not confirmed property damage. Open the map to explore the full coverage included in your access. Statistics cover the mapped hail footprint inside the Census boundary of Ferguson, MO, not the entire region. The place had 18,527 residents in the 2020 Census. A boundary intersection does not mean the whole community was hit. Estimated housing exposure: 181 units in 1-inch-or-larger bands, including 0 in 1.5-inch-or-larger bands and 0 in 2-inch-or-larger bands.

Local hail summary for the Grandview area: 14.51 square miles of estimated ground-hail footprint; highest mapped band 1+ inches. 0 official hail report(s) within the summary area. Exposure estimates are not confirmed property damage. Open the map to explore the full coverage included in your access. Statistics cover the mapped hail footprint inside the Census boundary of Grandview, MO, not the entire region. The place had 26,209 residents in the 2020 Census. A boundary intersection does not mean the whole community was hit. Estimated housing exposure: 2,164 units in 1-inch-or-larger bands, including 0 in 1.5-inch-or-larger bands and 0 in 2-inch-or-larger bands.

Local hail summary for the Hazelwood area: 4.64 square miles of estimated ground-hail footprint; highest mapped band 1+ inches. 0 official hail report(s) within the summary area. Exposure estimates are not confirmed property damage. Open the map to explore the full coverage included in your access. Statistics cover the mapped hail footprint inside the Census boundary of Hazelwood, MO, not the entire region. The place had 25,458 residents in the 2020 Census. A boundary intersection does not mean the whole community was hit. Estimated housing exposure: 2,848 units in 1-inch-or-larger bands, including 0 in 1.5-inch-or-larger bands and 0 in 2-inch-or-larger bands.

Local hail summary for the Joplin area: 36.85 square miles of estimated ground-hail footprint; highest mapped band 2+ inches. 0 official hail report(s) within the summary area. Exposure estimates are not confirmed property damage. Open the map to explore the full coverage included in your access. Statistics cover the mapped hail footprint inside the Census boundary of Joplin, MO, not the entire region. The place had 51,762 residents in the 2020 Census. A boundary intersection does not mean the whole community was hit. Estimated housing exposure: 23,375 units in 1-inch-or-larger bands, including 19,914 in 1.5-inch-or-larger bands and 11,066 in 2-inch-or-larger bands.

Local hail summary for the Kansas City area: 50.98 square miles of estimated ground-hail footprint; highest mapped band 1+ inches. 0 official hail report(s) within the summary area. Exposure estimates are not confirmed property damage. Open the map to explore the full coverage included in your access. Statistics cover the mapped hail footprint inside the Census boundary of Kansas City, MO, not the entire region. The place had 508,090 residents in the 2020 Census. A boundary intersection does not mean the whole community was hit. Estimated housing exposure: 871 units in 1-inch-or-larger bands, including 0 in 1.5-inch-or-larger bands and 0 in 2-inch-or-larger bands.

Local hail summary for the Kearney area: 8.80 square miles of estimated ground-hail footprint; highest mapped band 1+ inches. 0 official hail report(s) within the summary area. Exposure estimates are not confirmed property damage. Open the map to explore the full coverage included in your access. Statistics cover the mapped hail footprint inside the Census boundary of Kearney, MO, not the entire region. The place had 10,404 residents in the 2020 Census. A boundary intersection does not mean the whole community was hit. Estimated housing exposure: 1,135 units in 1-inch-or-larger bands, including 0 in 1.5-inch-or-larger bands and 0 in 2-inch-or-larger bands.

Local hail summary for the Lebanon area: 7.22 square miles of estimated ground-hail footprint; highest mapped band 1.5+ inches. 1 official hail report(s) within the summary area. Exposure estimates are not confirmed property damage. Open the map to explore the full coverage included in your access. Statistics cover the mapped hail footprint inside the Census boundary of Lebanon, MO, not the entire region. The place had 15,013 residents in the 2020 Census. A boundary intersection does not mean the whole community was hit. Estimated housing exposure: 1,361 units in 1-inch-or-larger bands, including 643 in 1.5-inch-or-larger bands and 0 in 2-inch-or-larger bands.

Local hail summary for the Lee's Summit area: 28.35 square miles of estimated ground-hail footprint; highest mapped band 1+ inches. 0 official hail report(s) within the summary area. Exposure estimates are not confirmed property damage. Open the map to explore the full coverage included in your access. Statistics cover the mapped hail footprint inside the Census boundary of Lee's Summit, MO, not the entire region. The place had 101,108 residents in the 2020 Census. A boundary intersection does not mean the whole community was hit. Estimated housing exposure: 6,613 units in 1-inch-or-larger bands, including 0 in 1.5-inch-or-larger bands and 0 in 2-inch-or-larger bands.

Local hail summary for the Maryland Heights area: 22.56 square miles of estimated ground-hail footprint; highest mapped band 1.5+ inches. 0 official hail report(s) within the summary area. Exposure estimates are not confirmed property damage. Open the map to explore the full coverage included in your access. Statistics cover the mapped hail footprint inside the Census boundary of Maryland Heights, MO, not the entire region. The place had 28,284 residents in the 2020 Census. A boundary intersection does not mean the whole community was hit. Estimated housing exposure: 11,848 units in 1-inch-or-larger bands, including 0 in 1.5-inch-or-larger bands and 0 in 2-inch-or-larger bands.

Local hail summary for the Mehlville area: 1.70 square miles of estimated ground-hail footprint; highest mapped band 1+ inches. 0 official hail report(s) within the summary area. Exposure estimates are not confirmed property damage. Open the map to explore the full coverage included in your access. Statistics cover the mapped hail footprint inside the Census boundary of Mehlville, MO, not the entire region. The place had 28,955 residents in the 2020 Census. A boundary intersection does not mean the whole community was hit. Estimated housing exposure: 749 units in 1-inch-or-larger bands, including 0 in 1.5-inch-or-larger bands and 0 in 2-inch-or-larger bands.
Yes. The storm library supports coverage-area filtering so you can find hail maps and hail swaths in a target service area.
The library focuses on published hail events, including ready storm maps and live storms once hail has been detected and a public swath is available.
Yes. They are built to help roofers, adjusters, restoration teams, and property owners review storm footprints before purchase.