
Port Orange, FL Hail Map — July 12, 2025

Local hail summary for the Port Orange area: 3.10 square miles of estimated ground-hail footprint; highest mapped band 1.5+ inches. 0 official hail report(s) within the summary area. Exposure estimates are not confirmed property damage. Open the map to explore the full coverage included in your access. Statistics cover the mapped hail footprint inside the Census boundary of Port Orange, FL, not the entire region. The place had 62,596 residents in the 2020 Census. A boundary intersection does not mean the whole community was hit. Estimated housing exposure: 1,462 units in 1-inch-or-larger bands, including 717 in 1.5-inch-or-larger bands and 0 in 2-inch-or-larger bands.
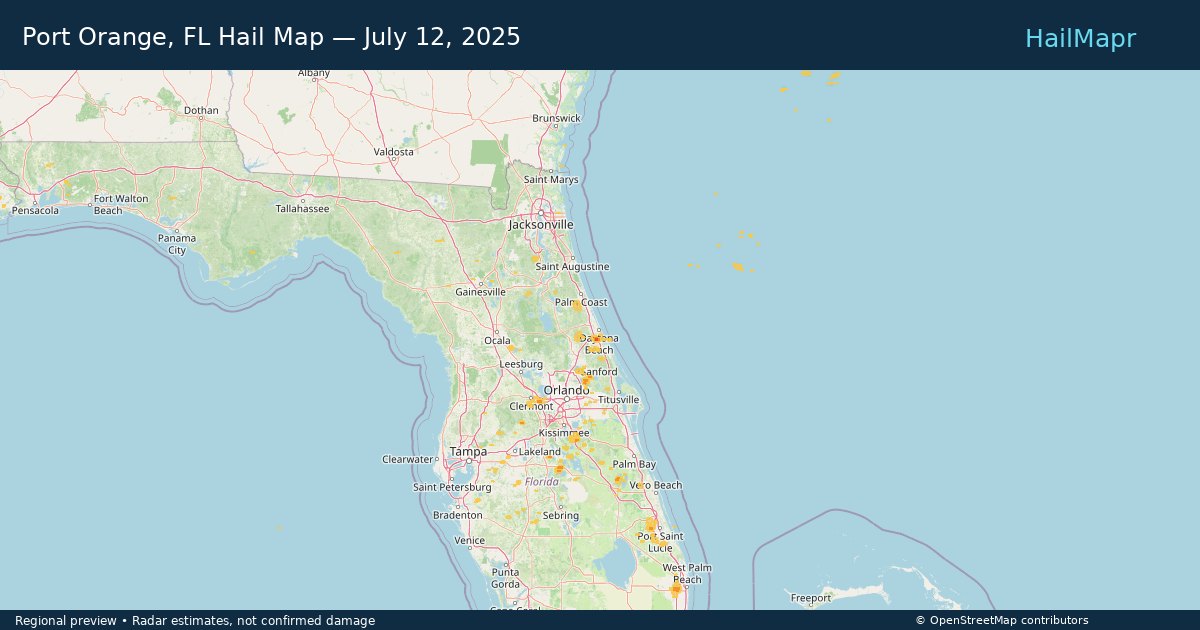
Port Orange area, FL
These totals describe the selected local summary area. Opening the map keeps the full coverage allowed by your account; the summary boundary does not cut off the storm polygons.
| Estimated size band | Area (sq mi) |
|---|---|
| 1.5+ inches | 0.59 |
| 1.0–<1.5 inches | 1.14 |
| 0.5–<1.0 inches | 1.38 |
How the Stone Score works
Experimental estimated housing-exposure index, not a damage rating. Each housing unit is assigned to its highest mapped size band using Census block points; housing units are not a count of individual buildings.
- 1 stone: qualifying local exposure below the higher tiers.
- 2 stones: 100+ units at 1.5″+, or 1,000+ at 1″+.
- 3 stones: 1,000+ units at 1.5″+, or 500+ at 2″+.
- 4 stones: 5,000+ units at 1.5″+, or 2,000+ at 2″+.
- 5 stones: 5,000+ units at 2″+.
Local pages require 100+ units at 1″+, or 25+ at 1.5″+. The highest qualifying tier wins. Unrated means insufficient qualifying exposure or missing data—not no damage.
More hail maps and storm history for Port Orange
Local official hail reports
No official reports within this summary area.
Storm Impact
Potential impact only—not confirmed property damage.
Storm description
Local hail summary for the Port Orange area: 3.10 square miles of estimated ground-hail footprint; highest mapped band 1.5+ inches. 0 official hail report(s) within the summary area. Exposure estimates are not confirmed property damage. Open the map to explore the full coverage included in your access. Statistics cover the mapped hail footprint inside the Census boundary of Port Orange, FL, not the entire region. The place had 62,596 residents in the 2020 Census. A boundary intersection does not mean the whole community was hit. Estimated housing exposure: 1,462 units in 1-inch-or-larger bands, including 717 in 1.5-inch-or-larger bands and 0 in 2-inch-or-larger bands.
Storm snapshot
What you get
- HailMapr Core Replay with step-by-step hail-track playback
- Heatmap and polygon package for the event window
- Available hail reports with source and location details
- Owned access that remains even if subscriptions end
Frequently asked questions
What does the Port Orange, FL — July 12, 2025 hail map show?
This storm page summarizes the mapped hail footprint for Port Orange, FL — July 12, 2025, including affected areas, peak hail size, mapped area, and related storm details.
Who uses HailMapr storm pages?
These pages are useful for roofers, adjusters, restoration teams, and property owners who want a storm-specific hail footprint before purchasing map access.
Does this storm include hail core replay?
Yes. HailMapr storm pages highlight Core Replay access so users can review the event window in more detail.